Bleeding Disorders Treatment Market
ID: MRFR/Pharma/5129-HCR
85 Pages
Rahul Gotadki
Last Updated: May 15, 2026
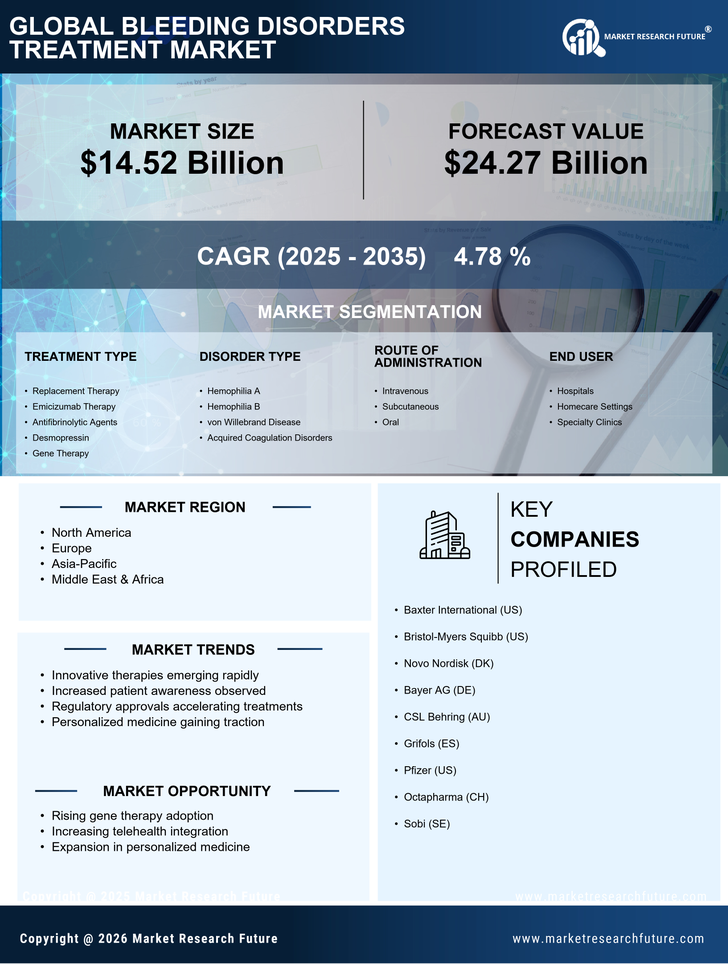
Bleeding Disorders Treatment Market Research Report: Size, Share, Trend Analysis By Treatment Type (Replacement Therapy, Emicizumab Therapy, Antifibrinolytic Agents, Desmopressin, Gene Therapy), By Disorder Type (Hemophilia A, Hemophilia B, von Willebrand Disease, Acquired Coagulation Disorders), By Route of Administration (Intravenous, Subcutaneous, Oral), By End Users (Hospitals, Homecare Settings, Specialty Clinics) and By Regional (North America, Europe, South America, Asia-Pacific, Middle East and Africa) - Growth Outlook & Industry Forecast 2025 To 2035