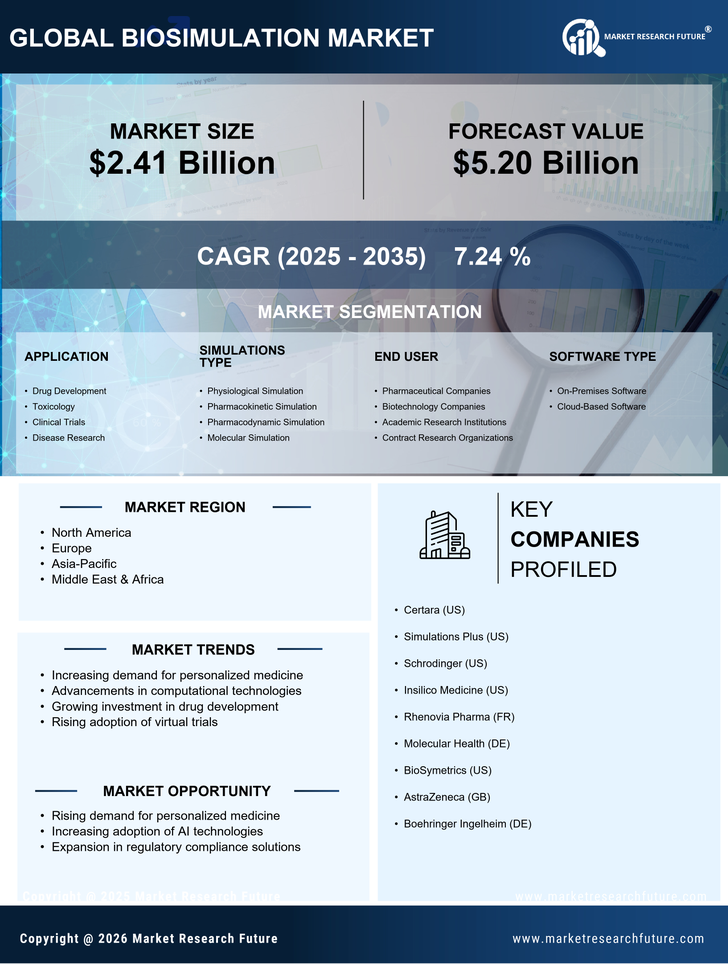
Certified Global Research Member
Isomar fd.webp Wcrc 57.webp
Key Questions Answered
  • Global Market Outlook
  • In-depth analysis of global and regional trends
  • Analyze and identify the major players in the market, their market share, key developments, etc.
  • To understand the capability of the major players based on products offered, financials, and strategies.
  • Identify disrupting products, companies, and trends.
  • To identify opportunities in the market.
  • Analyze the key challenges in the market.
  • Analyze the regional penetration of players, products, and services in the market.
  • Comparison of major players’ financial performance.
  • Evaluate strategies adopted by major players.
  • Recommendations
Why Choose Market Research Future?
  • Vigorous research methodologies for specific market.
  • Knowledge partners across the globe
  • Large network of partner consultants.
  • Ever-increasing/ Escalating data base with quarterly monitoring of various markets
  • Trusted by fortune 500 companies/startups/ universities/organizations
  • Large database of 5000+ markets reports.
  • Effective and prompt pre- and post-sales support.

Biosimulation Market Research Report Information By Product (Software, Services), By Application (Drug Development, Drug Discovery, Others), By Delivery Model (Subscription Models, Ownership Models) and By End Users (Pharmaceutical & Biotechnology Companies, Contract Research Organizations, Research Institutes, Others)- Forecast to 2030


ID: MRFR/HC/7108-HCR | 118 Pages | Author: Kinjoll Dey| April 2024
Leading companies partner with us for data-driven Insights
client_1 client_2 client_3 client_4 client_5 client_6 client_7 client_8 client_9 client_10
Please fill in Business Email for Quick Response

Table of Contents

1. EXECUTIVE SUMMARY

1.1. Market Attractiveness Analysis

1.1.1. Global Biosimulation Market, by Product

1.1.2. Global Biosimulation Market, by Application

1.1.3. Global Biosimulation Market, by Delivery Model

1.1.4. Global Biosimulation Market, by End Users

2. MARKET INTRODUCTION

2.1. Definition

2.2. Scope of the Study

2.2.1. Research Objective

2.2.2. Assumptions

2.2.3. Limitations

3. RESEARCH METHODOLOGY

3.1. Overview

3.2. Data Mining

3.3. Secondary Research

3.4. Primary Research

3.4.1. Breakdown of Primary Respondents

3.5. Forecasting Techniques

3.6. Research Methodology for Market Size Estimation

3.6.1. Bottom-Up Approach

3.6.2. Top-Down Approach

3.7. Data Triangulation

3.8. Validation

4. MARKET DYNAMICS

4.1. Overview

4.2. Drivers

4.3. Restraints

4.4. Opportunities

5. MARKET FACTOR ANALYSIS

5.1. Porter’s Five Forces Analysis

5.1.1. Bargaining Power of Suppliers

5.1.2. Bargaining Power of Buyers

5.1.3. Threat of New Entrants

5.1.4. Threat of Substitutes

5.1.5. Intensity of Rivalry

5.2. Value Chain Analysis

5.2.1. Inputs

5.2.1.1. Software/Solution Development Processes

5.2.2. Outputs

5.2.2.1. Marketing and Distribution

5.2.2.2. Post Sales Services

6. GLOBAL BIOSIMULATION MARKET, BY PRODUCT

6.1. Overview

6.2. Software

6.2.1. PK/PD Modeling and Simulation Software

Market Estimates & Forecast, by Region, 2020-2027

Market Estimates & Forecast, by Country, 2020-2027

6.2.2. Molecular Modeling and Simulation Software

Market Estimates & Forecast, by Region, 2020-2027

Market Estimates & Forecast, by Country, 2020-2027

6.2.3. PBPK Modeling and Simulation Software

Market Estimates & Forecast, by Region, 2020-2027

Market Estimates & Forecast, by Country, 2020-2027

6.2.4. Toxicity Prediction Software

Market Estimates & Forecast, by Region, 2020-2027

Market Estimates & Forecast, by Country, 2020-2027

6.2.5. Trial Design Software

Market Estimates & Forecast, by Region, 2020-2027

Market Estimates & Forecast, by Country, 2020-2027

6.2.6. Others

Market Estimates & Forecast, by Region, 2020-2027

Market Estimates & Forecast, by Country, 2020-2027

6.3. Services

6.3.1. In-House Services

Market Estimates & Forecast, by Region, 2020-2027

Market Estimates & Forecast, by Country, 2020-2027

6.3.2. Contract Services

Market Estimates & Forecast, by Region, 2020-2027

Market Estimates & Forecast, by Country, 2020-2027

7. GLOBAL BIOSIMULATION MARKET, BY APPLICATION

7.1. Overview

7.2. Drug Development

7.2.1. Preclinical Testing

Market Estimates & Forecast, by Region, 2020-2027

Market Estimates & Forecast, by Country, 2020-2027

7.2.1.1. PK/PD

Market Estimates & Forecast, by Region, 2020-2027

Market Estimates & Forecast, by Country, 2020-2027

7.2.1.2. ADME/TOX

Market Estimates & Forecast, by Region, 2020-2027

Market Estimates & Forecast, by Country, 2020-2027

7.2.2. Clinical Trials

Market Estimates & Forecast, by Region, 2020-2027

Market Estimates & Forecast, by Country, 2020-2027

7.3. Drug Discovery

7.3.1. Target Identification and Validation

Market Estimates & Forecast, by Region, 2020-2027

Market Estimates & Forecast, by Country, 2020-2027

7.3.2. Lead Identification and Optimization

Market Estimates & Forecast, by Region, 2020-2027

Market Estimates & Forecast, by Country, 2020-2027

7.4. Others

Market Estimates & Forecast, by Region, 2020-2027

Market Estimates & Forecast, by Country, 2020-2027

8. GLOBAL BIOSIMULATION MARKET, BY DELIVERY MODEL

8.1. Overview

8.2. Subscription Models

Market Estimates & Forecast, by Region, 2020-2027

Market Estimates & Forecast, by Country, 2020-2027

8.3. Ownership Models

Market Estimates & Forecast, by Region, 2020-2027

Market Estimates & Forecast, by Country, 2020-2027

9. GLOBAL BIOSIMULATION MARKET, BY END USERS

9.1. Overview

9.2. Pharmaceutical & Biotechnology Companies

Market Estimates & Forecast, by Region, 2020-2027

Market Estimates & Forecast, by Country, 2020-2027

9.3. Contract Research Organizations

Market Estimates & Forecast, by Region, 2020-2027

Market Estimates & Forecast, by Country, 2020-2027

9.4. Research Institutes

Market Estimates & Forecast, by Region, 2020-2027

Market Estimates & Forecast, by Country, 2020-2027

9.5. Regulatory Authorities

Market Estimates & Forecast, by Region, 2020-2027

Market Estimates & Forecast, by Country, 2020-2027

9.6. Others

Market Estimates & Forecast, by Region, 2020-2027

Market Estimates & Forecast, by Country, 2020-2027

10. GLOBAL BIOSIMULATION MARKET, BY REGION

10.1. Overview

10.2. Americas

10.2.1. North America

10.2.1.1. US

10.2.1.2. Canada

10.2.2. Latin America

10.3. Europe

10.3.1. Western Europe

10.3.1.1. Germany

10.3.1.2. France

10.3.1.3. Italy

10.3.1.4. Spain

10.3.1.5. UK

10.3.1.6. Rest of Western Europe

10.3.2. Eastern Europe

10.4. Asia-Pacific

10.4.1. Japan

10.4.2. China

10.4.3. India

10.4.4. Australia

10.4.5. South Korea

10.4.6. Rest of Asia-Pacific

10.5. Middle East & Africa

10.5.1. Middle East

10.5.2. Africa

11. COMPANY LANDSCAPE

11.1. Overview

11.2. Competitor Dashboard

11.3. Major Growth Strategy in the Global Biosimulation Market

11.4. Competitive Benchmarking

11.5. The Leading Player in terms of Number of Developments in the Global Biosimulation Market

11.6. Key Developments & Growth Strategies

11.6.1. New Product Launch/Service Deployment

11.6.2. Merger & Acquisition

11.6.3. Joint Ventures

11.7. Major Players Financial Matrix & Market Ratio

11.7.1. Sales & Operating Income 2020

11.7.2. Major Players R&D Expenditure 2020

12. COMPANY PROFILES

12.1. Dassault Systèmes

12.1.1. Company Overview

12.1.2. Products/Services Offered

12.1.3. Financial Overview

12.1.4. Key Developments

12.1.5. SWOT Analysis

12.1.6. Key Strategies

12.2. Certara USA, Inc.

12.3. Simulation Plus

12.4. Schrödinger

12.5. Chemical Computing Group

12.6. Physiomics

12.7. In Silico Biosciences

12.8. Advanced Chemistry Development, Inc.

12.9. Genedata AG

12.10. Nuventra Pharma

12.11. Evidera

12.12. Leadinvent Technologies

12.13. LeadScope, Inc.

12.14. Rosa

12.15. INOSIM Software GmbH

12.16. Others

13. APPENDIX

13.1. References

13.2. Related Reports

NOTE:

This table of content is tentative and subject to change as the research progresses.

ï‚¡ In section 12, only the top 10 companies will be profiled. Each company will be profiled based on the Market Overview, Financials, Product Portfolio, Business Strategies, and Recent Developments parameters.

ï‚¡ Please note: The financial details of the company cannot be provided if the information is not available in the public domain and or from reliable sources.

LIST OF TABLES

TABLE 1 GLOBAL BIOSIMULATION MARKET SYNOPSIS, 2020-2027

TABLE 2 GLOBAL BIOSIMULATION MARKET ESTIMATES & FORECAST, 2020-2027 (USD MILLION)

TABLE 3 GLOBAL BIOSIMULATION MARKET, BY PRODUCT, 2020-2027 (USD MILLION)

TABLE 4 GLOBAL BIOSIMULATION MARKET, BY APPLICATION, 2020-2027 (USD MILLION)

TABLE 5 GLOBAL BIOSIMULATION MARKET, BY DELIVERY MODEL, 2020-2027 (USD MILLION)

TABLE 6 GLOBAL BIOSIMULATION MARKET, BY END USERS, 2020-2027 (USD MILLION)

TABLE 7 GLOBAL BIOSIMULATION MARKET, BY REGION, 2020-2027 (USD MILLION)

TABLE 8 NORTH AMERICA: BIOSIMULATION MARKET, BY PRODUCT, 2020-2027 (USD MILLION)

TABLE 9 NORTH AMERICA: BIOSIMULATION MARKET, BY APPLICATION, 2020-2027 (USD MILLION)

TABLE 10 NORTH AMERICA: BIOSIMULATION MARKET, BY DELIVERY MODEL, 2020-2027 (USD MILLION)

TABLE 11 NORTH AMERICA: BIOSIMULATION MARKET, BY END USERS, 2020-2027 (USD MILLION)

TABLE 12 US: BIOSIMULATION MARKET, BY PRODUCT, 2020-2027 (USD MILLION)

TABLE 13 US: BIOSIMULATION MARKET, BY APPLICATION, 2020-2027 (USD MILLION)

TABLE 14 US: BIOSIMULATION MARKET, BY DELIVERY MODEL, 2020-2027 (USD MILLION)

TABLE 15 US: BIOSIMULATION MARKET, BY END USERS, 2020-2027 (USD MILLION)

TABLE 16 CANADA: BIOSIMULATION MARKET, BY PRODUCT, 2020-2027 (USD MILLION)

TABLE 17 CANADA: BIOSIMULATION MARKET, BY APPLICATION 2020-2027 (USD MILLION)

TABLE 18 CANADA: BIOSIMULATION MARKET, BY DELIVERY MODEL, 2020-2027 (USD MILLION)

TABLE 19 CANADA: BIOSIMULATION MARKET, BY END USERS, 2020-2027 (USD MILLION)

TABLE 20 LATIN AMERICA: BIOSIMULATION MARKET, BY PRODUCT, 2020-2027 (USD MILLION)

TABLE 21 LATIN AMERICA: BIOSIMULATION MARKET, BY APPLICATION, 2020-2027 (USD MILLION)

TABLE 22 LATIN AMERICA: BIOSIMULATION MARKET, BY DELIVERY MODEL, 2020-2027 (USD MILLION)

TABLE 23 LATIN AMERICA: BIOSIMULATION MARKET, BY END USERS, 2020-2027 (USD MILLION)

TABLE 24 EUROPE: BIOSIMULATION MARKET, BY PRODUCT, 2020-2027 (USD MILLION)

TABLE 25 EUROPE: BIOSIMULATION MARKET, BY APPLICATION, 2020-2027 (USD MILLION)

TABLE 26 EUROPE: BIOSIMULATION MARKET, BY DELIVERY MODEL, 2020-2027 (USD MILLION)

TABLE 27 EUROPE: BIOSIMULATION MARKET, BY END USERS, 2020-2027 (USD MILLION)

TABLE 28 WESTERN EUROPE: BIOSIMULATION MARKET, BY PRODUCT, 2020-2027 (USD MILLION)

TABLE 29 WESTERN EUROPE: BIOSIMULATION MARKET, BY APPLICATION 2020-2027 (USD MILLION)

TABLE 30 WESTERN EUROPE: BIOSIMULATION MARKET, BY DELIVERY MODEL, 2020-2027 (USD MILLION)

TABLE 31 WESTERN EUROPE: BIOSIMULATION MARKET, BY END USERS, 2020-2027 (USD MILLION)

TABLE 32 EASTERN EUROPE: BIOSIMULATION MARKET, BY PRODUCT, 2020-2027 (USD MILLION)

TABLE 33 EASTERN EUROPE: BIOSIMULATION MARKET, BY APPLICATION 2020-2027 (USD MILLION)

TABLE 34 EASTERN EUROPE: BIOSIMULATION MARKET, BY DELIVERY MODEL, 2020-2027 (USD MILLION)

TABLE 35 EASTERN EUROPE: BIOSIMULATION MARKET, BY END USERS, 2020-2027 (USD MILLION)

TABLE 36 ASIA-PACIFIC: BIOSIMULATION MARKET, BY PRODUCT, 2020-2027 (USD MILLION)

TABLE 37 ASIA-PACIFIC: BIOSIMULATION MARKET, BY APPLICATION, 2020-2027 (USD MILLION)

TABLE 38 ASIA-PACIFIC: BIOSIMULATION MARKET, BY DELIVERY MODEL, 2020-2027 (USD MILLION)

TABLE 39 ASIA-PACIFIC: BIOSIMULATION MARKET, BY END USERS, 2020-2027 (USD MILLION)

TABLE 40 MIDDLE EAST & AFRICA: BIOSIMULATION MARKET, BY PRODUCT, 2020-2027 (USD MILLION)

TABLE 41 MIDDLE EAST & AFRICA: BIOSIMULATION MARKET, BY APPLICATION, 2020-2027 (USD MILLION)

TABLE 42 MIDDLE EAST & AFRICA: BIOSIMULATION MARKET, BY DELIVERY MODEL, 2020-2027 (USD MILLION)

TABLE 43 MIDDLE EAST & AFRICA: BIOSIMULATION MARKET, BY END USERS, 2020-2027 (USD MILLION)

LIST OF FIGURES

FIGURE 1 RESEARCH PROCESS

FIGURE 2 MARKET STRUCTURE FOR THE GLOBAL BIOSIMULATION MARKET

FIGURE 3 MARKET DYNAMICS FOR THE GLOBAL BIOSIMULATION MARKET

FIGURE 4 GLOBAL BIOSIMULATION MARKET SHARE, BY PRODUCT, 2020 (%)

FIGURE 5 GLOBAL BIOSIMULATION MARKET SHARE, BY APPLICATION 2020 (%)

FIGURE 6 GLOBAL BIOSIMULATION MARKET SHARE, BY DELIVERY MODEL 2020 (%)

FIGURE 7 GLOBAL BIOSIMULATION MARKET SHARE, BY END USERS, 2020 (%)

FIGURE 8 GLOBAL BIOSIMULATION MARKET SHARE, BY REGION, 2020 (%)

FIGURE 9 AMERICAS: BIOSIMULATION MARKET SHARE BY REGION, 2020 (%)

FIGURE 10 NORTH AMERICA: BIOSIMULATION MARKET SHARE, BY COUNTRY, 2020 (%)

FIGURE 11 EUROPE: BIOSIMULATION MARKET SHARE, BY REGION, 2020 (%)

FIGURE 12 WESTERN EUROPE: BIOSIMULATION MARKET SHARE, BY COUNTRY, 2020 (%)

FIGURE 13 ASIA-PACIFIC: BIOSIMULATION MARKET SHARE, BY COUNTRY, 2020 (%)

FIGURE 14 MIDDLE EAST & AFRICA: BIOSIMULATION MARKET SHARE, BY COUNTRY, 2020 (%)

FIGURE 15 GLOBAL BIOSIMULATION MARKET: COMPANY SHARE ANALYSIS, 2020 (%)

FIGURE 16 DASSAULT SYSTÈMES: KEY FINANCIALS

FIGURE 17 DASSAULT SYSTÈMES: SEGMENTAL REVENUE

FIGURE 18 DASSAULT SYSTÈMES: REGIONAL REVENUE

FIGURE 19 CERTARA USA, INC.: KEY FINANCIALS

FIGURE 20 CERTARA USA, INC.: SEGMENTAL REVENUE

FIGURE 21 CERTARA USA, INC.: REGIONAL REVENUE

FIGURE 22 SIMULATION PLUS: KEY FINANCIALS

FIGURE 23 SIMULATION PLUS: SEGMENTAL REVENUE

FIGURE 24 SIMULATION PLUS: REGIONAL REVENUE

FIGURE 25 SCHRÖDINGER: KEY FINANCIALS

FIGURE 26 SCHRÖDINGER: SEGMENTAL REVENUE

FIGURE 27 SCHRÖDINGER: REGIONAL REVENUE

FIGURE 28 CHEMICAL COMPUTING GROUP: KEY FINANCIALS

FIGURE 29 CHEMICAL COMPUTING GROUP: SEGMENTAL REVENUE

FIGURE 30 CHEMICAL COMPUTING GROUP: REGIONAL REVENUE

FIGURE 31 PHYSIOMICS: KEY FINANCIALS

FIGURE 32 PHYSIOMICS: SEGMENTAL REVENUE

FIGURE 33 PHYSIOMICS: REGIONAL REVENUE

FIGURE 34 IN SILICO BIOSCIENCES: KEY FINANCIALS

FIGURE 35 IN SILICO BIOSCIENCES: SEGMENTAL REVENUE

FIGURE 36 IN SILICO BIOSCIENCES: REGIONAL REVENUE

FIGURE 37 ADVANCED CHEMISTRY DEVELOPMENT, INC.: KEY FINANCIALS

FIGURE 38 ADVANCED CHEMISTRY DEVELOPMENT, INC.: SEGMENTAL REVENUE

FIGURE 39 ADVANCED CHEMISTRY DEVELOPMENT, INC.: REGIONAL REVENUE

FIGURE 40 GENEDATA AG: KEY FINANCIALS

FIGURE 41 GENEDATA AG: SEGMENTAL REVENUE

FIGURE 42 GENEDATA AG: REGIONAL REVENUE

FIGURE 43 NUVENTRA PHARMA: KEY FINANCIALS

FIGURE 44 NUVENTRA PHARMA: SEGMENTAL REVENUE

FIGURE 45 NUVENTRA PHARMA: REGIONAL REVENUE

FIGURE 46 EVIDERA: KEY FINANCIALS

FIGURE 47 EVIDERA: SEGMENTAL REVENUE

FIGURE 48 EVIDERA: REGIONAL REVENUE

FIGURE 49 LEADINVENT TECHNOLOGIES: KEY FINANCIALS

FIGURE 50 LEADINVENT TECHNOLOGIES: SEGMENTAL REVENUE

FIGURE 51 LEADINVENT TECHNOLOGIES: REGIONAL REVENUE

FIGURE 52 LEADSCOPE, INC.: KEY FINANCIALS

FIGURE 53 LEADSCOPE, INC.: SEGMENTAL REVENUE

FIGURE 54 LEADSCOPE, INC.: REGIONAL REVENUE

FIGURE 55 ROSA: KEY FINANCIALS

FIGURE 56 ROSA: SEGMENTAL REVENUE

FIGURE 57 ROSA: REGIONAL REVENUE

FIGURE 58 INOSIM SOFTWARE GMBH: KEY FINANCIALS

FIGURE 59 INOSIM SOFTWARE GMBH: SEGMENTAL REVENUE

FIGURE 60 INOSIM SOFTWARE GMBH: REGIONAL REVENUE

Purchase Option
Single User $ 4,950
Multiuser License $ 5,950
Enterprise User $ 7,250
Compare Licenses
Tailored for You
  • Dedicated Research on any specifics segment or region.
  • Focused Research on specific players in the market.
  • Custom Report based only on your requirements.
  • Flexibility to add or subtract any chapter in the study.
  • Historic data from 2014 and forecasts outlook till 2040.
  • Flexibility of providing data/insights in formats (PDF, PPT, Excel).
  • Provide cross segmentation in applicable scenario/markets.