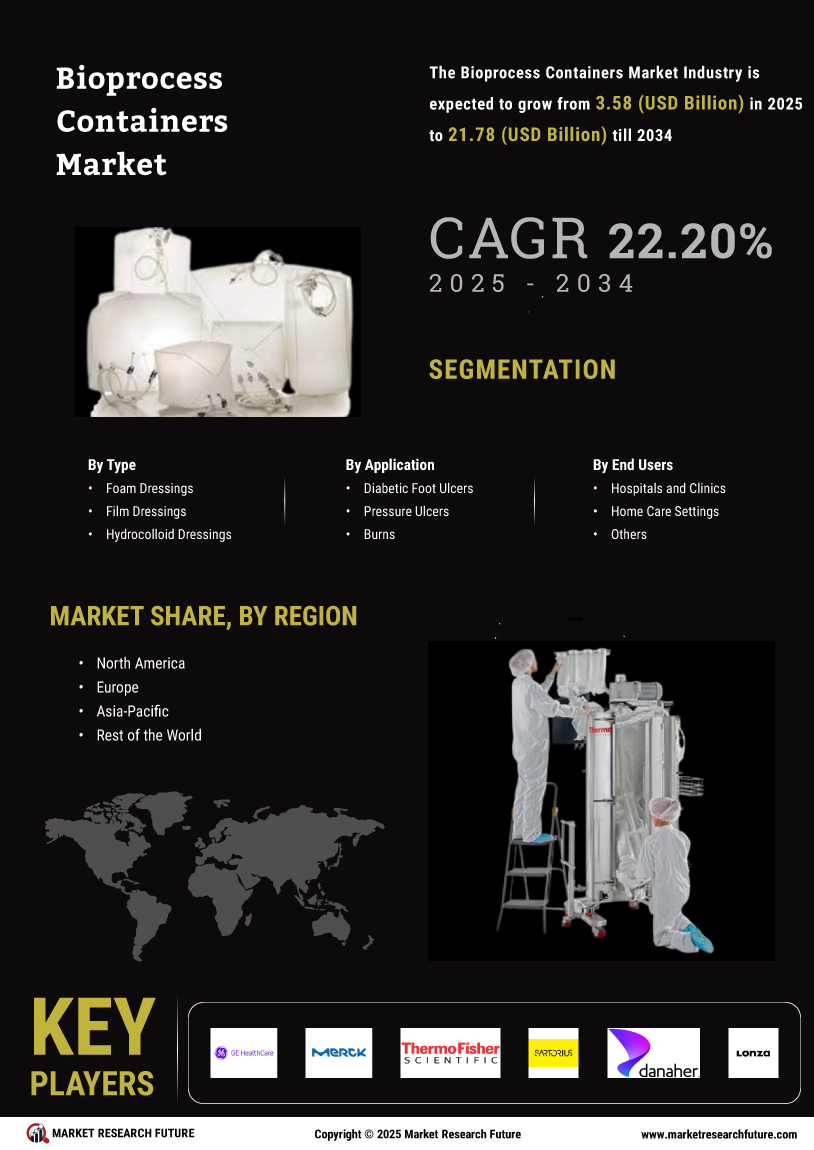
Certified Global Research Member
Isomar fd.webp Wcrc 57.webp
Key Questions Answered
  • Global Market Outlook
  • In-depth analysis of global and regional trends
  • Analyze and identify the major players in the market, their market share, key developments, etc.
  • To understand the capability of the major players based on products offered, financials, and strategies.
  • Identify disrupting products, companies, and trends.
  • To identify opportunities in the market.
  • Analyze the key challenges in the market.
  • Analyze the regional penetration of players, products, and services in the market.
  • Comparison of major players’ financial performance.
  • Evaluate strategies adopted by major players.
  • Recommendations
Why Choose Market Research Future?
  • Vigorous research methodologies for specific market.
  • Knowledge partners across the globe
  • Large network of partner consultants.
  • Ever-increasing/ Escalating data base with quarterly monitoring of various markets
  • Trusted by fortune 500 companies/startups/ universities/organizations
  • Large database of 5000+ markets reports.
  • Effective and prompt pre- and post-sales support.

Bioprocess Containers Market Report by Type (2D Container, 3D Container, Accessories), Application (Production Process, Upstream Process, Downstream Process), End User (Pharmaceutical Companies, Biotechnology Companies), and Region- Forecast till 2032


ID: MRFR/MED/5169-HCR | 100 Pages | Author: Kinjoll Dey| April 2024
Leading companies partner with us for data-driven Insights
client_1 client_2 client_3 client_4 client_5 client_6 client_7 client_8 client_9 client_10
Please fill in Business Email for Quick Response

Table of Contents

Chapter 1. Report Prologue

Chapter 2. Market Introduction

2.1 Definition

2.2 Scope of the Study

2.2.1 Research Objective

2.2.2 Assumptions

2.2.3 Limitations

Chapter 3. Research Methodology

3.1 Introduction

3.2 Primary Research

3.3 Secondary Research

3.4 Market Size Estimation

Chapter 4. Market Dynamics

4.1 Drivers

4.2 Restraints

4.3 Opportunities

4.4 Challenges

4.5 Macroeconomic Indicators

4.6 Technology Trends & Assessment

Chapter 5. Market Factor Analysis

5.1 Porter’s Five Forces Analysis

5.1.1 Bargaining Power of Suppliers

5.1.2 Bargaining Power of Buyers

5.1.3 Threat of New Entrants

5.1.4 Threat of Substitutes

5.1.5 Intensity of Rivalry

5.2 Value Chain Analysis

5.3 Investment Feasibility Analysis

5.4 Pricing Analysis

Chapter 6. Global Bioprocess Containers Market, by Type

6.1 Introduction

6.2 2D Container

Market Estimates & Forecast, by Region, 2023-2030

Market Estimates & Forecast, by Country, 2023-2030

6.3 3D Container

Market Estimates & Forecast, by Region, 2023-2030

Market Estimates & Forecast, by Country, 2023-2030

6.4 Accessories

Market Estimates & Forecast, by Region, 2023-2030

Market Estimates & Forecast, by Country, 2023-2030

Chapter 7. Global Bioprocess Containers Market, by Application

7.1 Introduction

7.2 Production Process

Market Estimates & Forecast, by Region, 2023-2030

Market Estimates & Forecast, by Country, 2023-2030

7.3 Upstream Process

Market Estimates & Forecast, by Region, 2023-2030

Market Estimates & Forecast, by Country, 2023-2030

7.4 Downstream Process

Market Estimates & Forecast, by Region, 2023-2030

Market Estimates & Forecast, by Country, 2023-2030

Chapter 8. Global Bioprocess Containers Market, by End User

8.1 Introduction

8.2 Pharmaceutical Companies

Market Estimates & Forecast, by Region, 2023-2030

Market Estimates & Forecast, by Country, 2023-2030

8.3 Biotechnology Companies

Market Estimates & Forecast, by Region, 2023-2030

Market Estimates & Forecast, by Country, 2023-2030

8.4 Other

Market Estimates & Forecast, by Region, 2023-2030

Market Estimates & Forecast, by Country, 2023-2030

Chapter 9. Global Bioprocess Containers Market, by Region

9.1 Introduction

9.2 Americas

9.2.1 North America

9.2.1.1 US

9.2.1.2 Canada

9.2.2 South America

9.3 Europe

9.3.1 Western Europe

9.3.1.1 Germany

9.3.1.2 France

9.3.1.3 Italy

9.3.1.4 Spain

9.3.1.5 UK

9.3.1.6 Rest of Western Europe

9.3.2 Eastern Europe

9.4 Asia-Pacific

9.4.1 Japan

9.4.2 China

9.4.3 India

9.4.4 Australia

9.4.5 South Korea

9.4.6 Rest of Asia-Pacific

9.5 Middle East & Africa

9.5.1 Middle East

9.5.2 Africa

Chapter 10. Company Landscape

10.1 Introduction

10.2 Market Share Analysis

10.3 Key Development & Strategies

Chapter 11. Company Profiles

11.1 GE Healthcare

11.1.1 Company Overview

11.1.2 Product Overview

11.1.3 Financials Overview

11.1.4 Key Developments

11.1.5 SWOT Analysis

11.2 Merck KGaA

11.2.1 Company Overview

11.2.2 Product Overview

11.2.3 Financial Overview

11.2.4 Key Developments

11.2.5 SWOT Analysis

11.3 Thermo Fisher Scientific

11.3.1 Company Overview

11.3.2 Product Overview

11.3.3 Financial Overview

11.3.4 Key Development

11.3.5 SWOT Analysis

11.4 Sartorius

11.4.1 Company Overview

11.4.2 Product Overview

11.4.3 Financial Overview

11.4.4 Key Development

11.4.5 SWOT Analysis

11.5 Danaher Corporation

11.5.1 Company Overview

11.5.2 Product Overview

11.5.3 Financial overview

11.5.4 Key Developments

11.5.5 SWOT Analysis

11.6 Lonza

11.6.1 Company Overview

11.6.2 Product Overview

11.6.3 Financial Overview

11.6.4 Key Developments

11.6.5 SWOT Analysis

11.7 Fenner PLC

11.7.1 Overview

11.7.2 Product Overview

11.7.3 Financial Overview

11.7.4 Key Developments

11.7.5 SWOT Analysis

11.8 Rim Bio

11.8.1 Overview

11.8.2 Product Overview

11.8.3 Financials

11.8.4 Key Developments

11.8.5 SWOT Analysis

11.9 Fluids Control

11.9.1 Overview

11.9.2 Product Overview

11.9.3 Financials

11.9.4 Key Developments

11.9.5 SWOT Analysis

11.10 Meissner

11.10.1 Overview

11.10.2 Product Overview

11.10.3 Financials

11.10.4 Key Developments

11.10.5 SWOT Analysis

11.11 Others

Chapter 12 MRFR Conclusion

12.1 Key Findings

12.1.1 From CEO’s Viewpoint

12.1.2 Unmet Needs of the Market

12.2 Key Companies to Watch

12.3 Predictions for the Bioprocess Containers Industry

Chapter 13. Appendix

LIST OF TABLES

Table 1 Global Bioprocess Containers Market Synopsis, 2023-2030

Table 2 Global Bioprocess Containers Market Estimates and Forecast, 2023-2030

(USD Million)

Table 3 Global Bioprocess Containers Market, by Region, 2023-2030 (USD Million)

Table 4 Global Bioprocess Containers Market, by Type, 2023-2030 (USD Million)

Table 5 Global Bioprocess Containers Market, by Application, 2023-2030 (USD Million)

Table 7 Global Bioprocess Containers Market, by End User, 2023-2030 (USD Million)

Table 8 North America: Bioprocess Containers Market, by Type, 2023-2030 (USD Million)

Table 9 North America: Bioprocess Containers Market, by Application, 2023-2030 (USD Million)

Table 10 North America: Bioprocess Containers Market, by End User, 2023-2030

(USD Million)

Table 11 US: Bioprocess Containers Market, by Type, 2023-2030

(USD Million)

Table 12 US: Bioprocess Containers Market, by Application, 2023-2030

(USD Million)

Table 13 US: Bioprocess Containers Market, by End User, 2023-2030 (USD Million)

Table 14 Canada: Bioprocess Containers Market, by Type, 2023-2030 (USD

Million)

Table 15 Canada: Bioprocess Containers Market, by Application, 2023-2030 (USD

Million)

Table 16 Canada: Bioprocess Containers Market, by End User, 2023-2030 (USD

Million)

Table 17 South America: Bioprocess Containers Market, by Type, 2023-2030

(USD Million)

Table 18 South America: Bioprocess Containers Market, by Application, 2023-2030

(USD Million)

Table 19 South America: Bioprocess Containers Market, by End User, 2023-2030

(USD Million)

Table 20 Europe: Bioprocess Containers Market, by Type, 2023-2030 (USD

Million)

Table 21 Europe: Bioprocess Containers Market, by Application, 2023-2030 (USD

Million)

Table 22 Europe: Bioprocess Containers Market, by End User, 2023-2030 (USD

Million)

Table 23 Western Europe: Bioprocess Containers Market, by Type, 2023-2030 (USD Million)

Table 24 Western Europe: Bioprocess Containers Market, by Application, 2023-2030 (USD Million)

Table 25 Western Europe: Bioprocess Containers Market, by End-User, 2023-2030

(USD Million)

Table 26 Eastern Europe: Bioprocess Containers Market, by Type, 2023-2030 (USD Million)

Table 27 Eastern Europe: Bioprocess Containers Market, by Application, 2023-2030

(USD Million)

Table 28 Eastern Europe: Bioprocess Containers Market, by End User, 2023-2030

(USD Million)

Table 29 Asia-Pacific: Bioprocess Containers Market, by Type, 2023-2030

(USD Million)

Table 30 Asia-Pacific: Bioprocess Containers Market, by Application , 2023-2030

(USD Million)

Table 31 Asia-Pacific: Bioprocess Containers Market, by End User, 2023-2030 (USD

Million)

Table 32 Middle East & Africa: Bioprocess Containers Market, by Type,

2023-2030 (USD Million)

Table 33 Middle East & Africa: Bioprocess Containers Market, by Application, 2023-2030 (USD Million)

Table 34 Middle East & Africa: Bioprocess Containers Market, by End User, 2023-2030 (USD Million)

LIST OF FIGURES

Figure 1 Research Process

Figure 2 Segmentation for Global Bioprocess Containers Market

Figure 3 Segmentation Market Dynamics for Global Bioprocess Containers Market

Figure 4 Global Bioprocess Containers Market Share, by Type, 2023

Figure 5 Global Bioprocess Containers Market Share, by Application, 2023

Figure 6 Global Bioprocess Containers Market Share, by End User, 2023

Figure 7 Global Bioprocess Containers Market Share, by Region, 2023

Figure 8 North America: Bioprocess Containers Market Share, by Country, 2023

Figure 9 Europe: Bioprocess Containers Market Share, by Country, 2023

Figure 10 Asia-Pacific: Bioprocess Containers Market Share, by Country, 2023

Figure 11 Middle East & Africa: Bioprocess Containers Market Share, by Country, 201

Figure 12 Global Bioprocess Containers Market: Company Share Analysis, 2023 (%)

Figure 13 GE Healthcare: Key Financials

Figure 14 GE Healthcare: Segmental Revenue

Figure 15 GE Healthcare: Geographical Revenue

Figure 16 Merck KGaA: Key Financials

Figure 17 Merck KGaA: Segmental Revenue

Figure 18 Merck KGaA: Geographical Revenue

Figure 19 Thermo Fisher Scientific: Key Financials

Figure 20 Thermo Fisher Scientific: Segmental Revenue

Figure 21 Thermo Fisher Scientific: Geographical Revenue

Figure 22 Sartorius: Key Financials

Figure 23 Sartorius: Segmental Revenue

Figure 24 Sartorius: Geographical Revenue

Figure 25 Danaher Corporation: Key Financials

Figure 26 Danaher Corporation: Segmental Revenue

Figure 27 Danaher Corporation. Geographical Revenue

Figure 28 Lonza: Key Financials

Figure 29 Lonza: Segmental Revenue

Figure 30 Lonza: Geographical Revenue

Figure 31 Fenner PLC: Key Financials

Figure 32 Fenner PLC: Segmental Revenue

Figure 33 Fenner PLC: Geographical Revenue

Figure 34 Rim Bio: Key Financials

Figure 35 Rim Bio: Segmental Revenue

Figure 36 Rim Bio: Geographical Revenue

Figure 37 Fluids Control: Key Financials

Figure 38 Fluids Control: Segmental Revenue

Figure 39 Fluids Control: Geographical Revenue

Figure 40 Meissner: Key Financials

Figure 41 Meissner: Segmental Revenue

Figure 42 Meissner: Geographical Revenue

Purchase Option
Single User $ 4,950
Multiuser License $ 5,950
Enterprise User $ 7,250
Compare Licenses
Tailored for You
  • Dedicated Research on any specifics segment or region.
  • Focused Research on specific players in the market.
  • Custom Report based only on your requirements.
  • Flexibility to add or subtract any chapter in the study.
  • Historic data from 2014 and forecasts outlook till 2040.
  • Flexibility of providing data/insights in formats (PDF, PPT, Excel).
  • Provide cross segmentation in applicable scenario/markets.