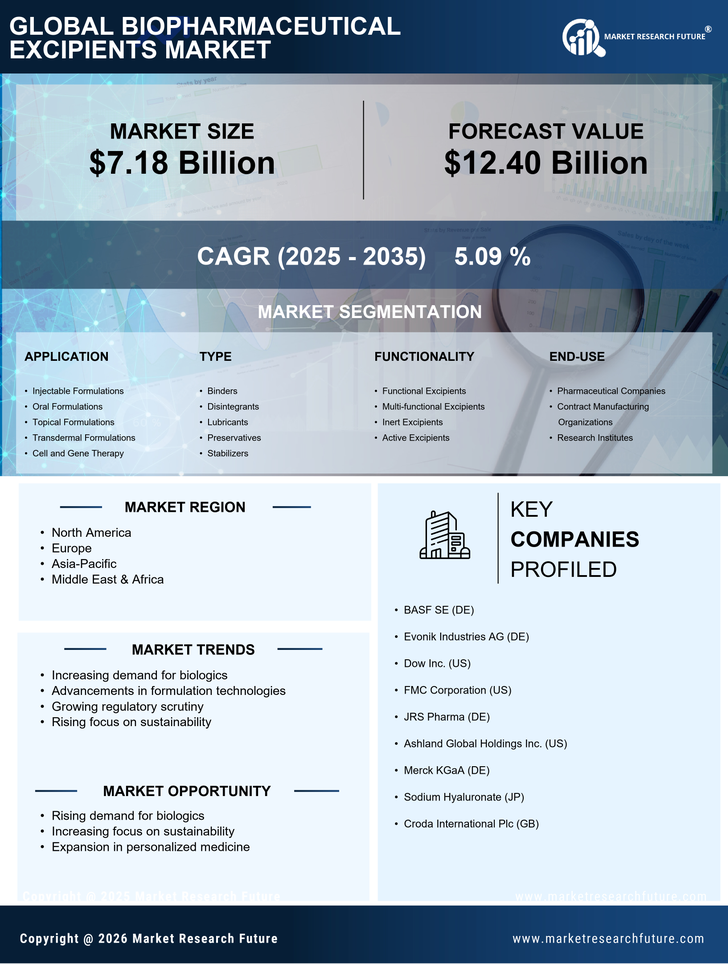
Certified Global Research Member
Isomar fd.webp Wcrc 57.webp
Key Questions Answered
  • Global Market Outlook
  • In-depth analysis of global and regional trends
  • Analyze and identify the major players in the market, their market share, key developments, etc.
  • To understand the capability of the major players based on products offered, financials, and strategies.
  • Identify disrupting products, companies, and trends.
  • To identify opportunities in the market.
  • Analyze the key challenges in the market.
  • Analyze the regional penetration of players, products, and services in the market.
  • Comparison of major players’ financial performance.
  • Evaluate strategies adopted by major players.
  • Recommendations
Why Choose Market Research Future?
  • Vigorous research methodologies for specific market.
  • Knowledge partners across the globe
  • Large network of partner consultants.
  • Ever-increasing/ Escalating data base with quarterly monitoring of various markets
  • Trusted by fortune 500 companies/startups/ universities/organizations
  • Large database of 5000+ markets reports.
  • Effective and prompt pre- and post-sales support.

Biopharmaceutical Excipients Market Size, Trends and Growth Outlook By Product {Solubilizers & Surfactants/Emulsifiers (Triglycerides, Esters), Polyols (Mannitol, Sorbitol), Carbohydrates (Sucrose, Dextrose, Starch), Specialty Excipients}, Formulation (Oral, Topical, Injectables) and Region (North America, Europe, Asia-Pacific, Rest of the World)—Forecast to 2032


ID: MRFR/HC/9128-HCR | 120 Pages | Author: Kinjoll Dey| April 2024
Leading companies partner with us for data-driven Insights
client_1 client_2 client_3 client_4 client_5 client_6 client_7 client_8 client_9 client_10
Please fill in Business Email for Quick Response

TABLE OF CONTENTS

1. REPORT PROLOGUE

2. MARKET INTRODUCTION

2.1. Definition

2.2. Scope of the Study

2.2.1. Research Objective

2.2.2. Assumptions

2.2.3. Limitations

3. RESEARCH METHODOLOGY

3.1. Overview

3.2. Data Mining

3.3. Secondary Research

3.4. Primary Research

3.4.1. Primary Interviews and Information Gathering Process

3.4.2. Breakdown of Primary Respondents

3.5. Forecasting Cellulite Type

3.6. Market Size Estimation

3.6.1. Bottom-Up Approach

3.6.2. Top-Down Approach

3.7. Data Triangulation

3.8. Validation

4. MARKET DYNAMICS

4.1. Overview

4.2. Drivers

4.3. Restraints

4.4. Opportunities

5. MARKET FACTOR ANALYSIS

5.1. Porter’s Five Forces Analysis

5.1.1. Bargaining Power of Suppliers

5.1.2. Bargaining Power of Buyers

5.1.3. Threat of New Entrants

5.1.4. Threat of Substitutes

5.1.5. Intensity of Rivalry

5.2. Value Chain Analysis

5.3. COVID-19 Impact Analysis

5.3.1. Market Impact Analysis

5.3.2. Impact on Supply Chain

5.3.3. Regional Impact

5.3.4. Opportunity and Threat Analysis

6. GLOBAL BIOPHARMACEUTICAL EXCIPIENTS MARKET, BY PRODUCT

6.1. Overview

6.2. Solubilizers & Surfactants/Emulsifiers

Market Estimates & Forecast, by Region, 2023–2032

Market Estimates & Forecast, by Country, 2023–2032

6.2.1. Triglycerides

Market Estimates & Forecast, by Region, 2023–2032

Market Estimates & Forecast, by Country, 2023–2032

6.2.2. Esters

Market Estimates & Forecast, by Region, 2023–2032

Market Estimates & Forecast, by Country, 2023–2032

6.2.3. Others

Market Estimates & Forecast, by Region, 2023–2032

Market Estimates & Forecast, by Country, 2023–2032

6.3. Polyols

Market Estimates & Forecast, by Region, 2023–2032

Market Estimates & Forecast, by Country, 2023–2032

6.3.1. Mannitol

Market Estimates & Forecast, by Region, 2023–2032

Market Estimates & Forecast, by Country, 2023–2032

6.3.2. Sorbitol

Market Estimates & Forecast, by Region, 2023–2032

Market Estimates & Forecast, by Country, 2023–2032

6.3.3. Others

Market Estimates & Forecast, by Region, 2023–2032

Market Estimates & Forecast, by Country, 2023–2032

6.4. Carbohydrates

Market Estimates & Forecast, by Region, 2023–2032

Market Estimates & Forecast, by Country, 2023–2032

6.4.1. Sucrose

Market Estimates & Forecast, by Region, 2023–2032

Market Estimates & Forecast, by Country, 2023–2032

6.4.2. Dextrose

Market Estimates & Forecast, by Region, 2023–2032

Market Estimates & Forecast, by Country, 2023–2032

6.4.3. Starch

Market Estimates & Forecast, by Region, 2023–2032

Market Estimates & Forecast, by Country, 2023–2032

6.4.4. Others

Market Estimates & Forecast, by Region, 2023–2032

Market Estimates & Forecast, by Country, 2023–2032

7. GLOBAL BIOPHARMACEUTICAL EXCIPIENTS MARKET, BY FORMULATION

7.1. Overview

7.2. Oral

Market Estimates & Forecast, by Region, 2023–2032

Market Estimates & Forecast, by Country, 2023–2032

7.3. Topical

Market Estimates & Forecast, by Region, 2023–2032

Market Estimates & Forecast, by Country, 2023–2032

7.4. Injectables

Market Estimates & Forecast, by Region, 2023–2032

Market Estimates & Forecast, by Country, 2023–2032

8. GLOBAL BIOPHARMACEUTICAL EXCIPIENTS MARKET, BY REGION

8.1. Overview

8.2. North America

8.2.1. US

8.2.2. Canada

8.3. Europe

8.3.1. Germany

8.3.2. France

8.3.3. Italy

8.3.4. Spain

8.3.5. UK

8.3.6. Rest of Europe

8.4. Asia-Pacific

8.4.1. Japan

8.4.2. China

8.4.3. India

8.4.4. Australia

8.4.5. South Korea

8.4.6. Rest of Asia-Pacific

8.5. Rest of the World

8.5.1. Middle East

8.5.2. Africa

8.5.3. Latin America

9. COMPANY LANDSCAPE

9.1. Overview

9.2. Competitive Analysis

9.3. Market Share Analysis

9.4. Major Growth Strategy in the Global Biopharmaceutical Excipients Market

9.5. Competitive Benchmarking

9.6. Leading Players in terms of number of developments in the Global Biopharmaceutical Excipients Market

9.7. Key developments and Growth Strategies

9.7.1. New ProductLaunch/Service Deployment

9.7.2. Merger &Acquisitions

9.7.3. Joint Ventures

9.8. Major Players Financial Matrix

9.8.1. Sales & Operating Income, 2020

9.8.2. Major Players R&D Expenditure, 2020

10. COMPANY PROFILES

10.1. Merck KGaA

10.1.1. Company Overview

10.1.2. Product Offered

10.1.3. Financial Overview

10.1.4. Key Developments

10.1.5. SWOT Analysis

10.1.6. Key Strategies

10.2. Colorcon (BPSI Holdings Inc)

10.2.1. Company Overview

10.2.2. Products Offered

10.2.3. Financial Overview

10.2.4. Key Developments

10.2.5. SWOT Analysis

10.2.6. Key Strategies

10.3. BASF SE

10.3.1. Company Overview

10.3.2. Products Offered

10.3.3. Financial Overview

10.3.4. Key Developments

10.3.5. SWOT Analysis

10.3.6. Key Strategies

10.4. Associated British Foods plc

10.4.1. Company Overview

10.4.2. Products Offered

10.4.3. Financial Overview

10.4.4. Key Developments

10.4.5. SWOT Analysis

10.4.6. Key Strategies

10.5. Signet Excipients Pvt. Ltd (IMCD)

10.5.1. Company Overview

10.5.2. Products Offered

10.5.3. Financial Overview

10.5.4. Key Developments

10.5.5. SWOT Analysis

10.5.6. Key Strategies

10.6. Sigachi Industries Limited

10.6.1. Company Overview

10.6.2. Products Offered

10.6.3. Financial Overview

10.6.4. Key Developments

10.6.5. SWOT Analysis

10.6.6. Key Strategies

10.7. Spectrum Chemical Manufacturing Corp.

10.7.1. Company Overview

10.7.2. Products Offered

10.7.3. Financial Overview

10.7.4. Key Developments

10.7.5. SWOT Analysis

10.7.6. Key Strategies

10.8. Roquette Frères

10.8.1. Company Overview

10.8.2. Products Offered

10.8.3. Financial Overview

10.8.4. Key Developments

10.8.5. SWOT Analysis

10.8.6. Key Strategies

10.9. Clariant

10.9.1. Company Overview

10.9.2. Products Offered

10.9.3. Financial Overview

10.9.4. Key Developments

10.9.5. SWOT Analysis

10.9.6. Key Strategies

10.10. DFE Pharma

10.10.1. Company Overview

10.10.2. Products Offered

10.10.3. Financial Overview

10.10.4. Key Developments

10.10.5. SWOT Analysis

10.10.6. Key Strategies

10.11. J. Rettenmaier & Söhne GmbH + Co Kg

10.11.1. Company Overview

10.11.2. Products Offered

10.11.3. Financial Overview

10.11.4. Key Developments

10.11.5. SWOT Analysis

10.11.6. Key Strategies

10.12. Evonik Industries AG

10.12.1. Company Overview

10.12.2. Products Offered

10.12.3. Financial Overview

10.12.4. Key Developments

10.12.5. SWOT Analysis

10.12.6. Key Strategies

11. APPENDIX

11.1. References

11.2. Related Reports

LIST OF TABLES

TABLE 1 GLOBAL BIOPHARMACEUTICAL EXCIPIENTS MARKET SYNOPSIS, 2023–2032

TABLE 2 GLOBAL BIOPHARMACEUTICAL EXCIPIENTS MARKET ESTIMATES &FORECAST, 2023–2032 (USD MILLION)

TABLE 3 GLOBAL BIOPHARMACEUTICAL EXCIPIENTS MARKET, BYPRODUCT, 2023–2032 (USD MILLION)

TABLE 4 GLOBAL BIOPHARMACEUTICAL EXCIPIENTS MARKET, BY FORMULATION, 2023–2032 (USD MILLION)

TABLE 5 NORTH AMERICA: BIOPHARMACEUTICAL EXCIPIENTS MARKET, BY PRODUCT, 2023–2032 (USD MILLION)

TABLE 6 NORTH AMERICA BIOPHARMACEUTICAL EXCIPIENTS MARKET, BY FORMULATION, 2023–2032 (USD MILLION)

TABLE 7 US: BIOPHARMACEUTICAL EXCIPIENTS MARKET, BY PRODUCT, 2023–2032 (USD MILLION)

TABLE 8 US BIOPHARMACEUTICAL EXCIPIENTS MARKET, BY FORMULATION, 2023–2032 (USD MILLION)

TABLE 9 CANADA: BIOPHARMACEUTICAL EXCIPIENTS MARKET, PRODUCT, 2023–2032 (USD MILLION)

TABLE 10 CANADA BIOPHARMACEUTICAL EXCIPIENTS MARKET, BY FORMULATION, 2023–2032 (USD MILLION)

TABLE 11 EUROPE: BIOPHARMACEUTICAL EXCIPIENTS MARKET, BY PRODUCT, 2023–2032 (USD MILLION)

TABLE 12 EUROPE BIOPHARMACEUTICAL EXCIPIENTS MARKET, BY FORMULATION, 2023–2032 (USD MILLION)

TABLE 13 GERMANY: BIOPHARMACEUTICAL EXCIPIENTS MARKET, BY PRODUCT, 2023–2032 (USD MILLION)

TABLE 14 GERMANY: BIOPHARMACEUTICAL EXCIPIENTS MARKET, BY FORMULATION, 2023–2032 (USD MILLION)

TABLE 15 FRANCE: BIOPHARMACEUTICAL EXCIPIENTS MARKET, BY PRODUCT, 2023–2032 (USD MILLION)

TABLE 16 FRANCE: BIOPHARMACEUTICAL EXCIPIENTS MARKET, FORMULATION, 2023–2032 (USD MILLION)

TABLE 17 ITALY: BIOPHARMACEUTICAL EXCIPIENTS MARKET, BY PRODUCT, 2023–2032 (USD MILLION)

TABLE 18 ITALY: BIOPHARMACEUTICAL EXCIPIENTS MARKET, BY FORMULATION, 2023–2032 (USD MILLION)

TABLE 19 SPAIN: BIOPHARMACEUTICAL EXCIPIENTS MARKET, BY PRODUCT, 2023–2032 (USD MILLION)

TABLE 20 SPAIN: BIOPHARMACEUTICAL EXCIPIENTS MARKET, BY FORMULATION, 2023–2032 (USD MILLION)

TABLE 21 UK: BIOPHARMACEUTICAL EXCIPIENTS MARKET, BY PRODUCT, 2023–2032 (USD MILLION)

TABLE 22 UK: BIOPHARMACEUTICAL EXCIPIENTS MARKET, BY FORMULATION, 2023–2032 (USD MILLION)

TABLE 23 REST OF EUROPE: BIOPHARMACEUTICAL EXCIPIENTS MARKET, BY PRODUCT, 2023–2032 (USD MILLION)

TABLE 24 REST OF EUROPE: BIOPHARMACEUTICAL EXCIPIENTS MARKET, BY FORMULATION, 2023–2032 (USD MILLION)

TABLE 25 ASIA-PACIFIC: BIOPHARMACEUTICAL EXCIPIENTS MARKET, BY PRODUCT, 2023–2032 (USD MILLION)

TABLE 26 ASIA-PACIFIC: BIOPHARMACEUTICAL EXCIPIENTS MARKET, BY FORMULATION, 2023–2032 (USD MILLION)

TABLE 27 JAPAN: BIOPHARMACEUTICAL EXCIPIENTS MARKET, BY PRODUCT, 2023–2032 (USD MILLION)

TABLE 28 JAPAN: BIOPHARMACEUTICAL EXCIPIENTS MARKET, BY FORMULATION, 2023–2032 (USD MILLION)

TABLE 29 CHINA: BIOPHARMACEUTICAL EXCIPIENTS MARKET, BY PRODUCT, 2023–2032 (USD MILLION)

TABLE 30 CHINA: BIOPHARMACEUTICAL EXCIPIENTS MARKET, BY FORMULATION, 2023–2032 (USD MILLION)

TABLE 31 INDIA: BIOPHARMACEUTICAL EXCIPIENTS MARKET, BY PRODUCT, 2023–2032 (USD MILLION)

TABLE 32 INDIA: BIOPHARMACEUTICAL EXCIPIENTS MARKET, BY FORMULATION, 2023–2032 (USD MILLION)

TABLE 33 AUSTRALIA: BIOPHARMACEUTICAL EXCIPIENTS MARKET, BY PRODUCT, 2023–2032 (USD MILLION)

TABLE 34 AUSTRALIA: BIOPHARMACEUTICAL EXCIPIENTS MARKET, FORMULATION2023–2032 (USD MILLION)

TABLE 35 SOUTH KOREA: BIOPHARMACEUTICAL EXCIPIENTS MARKET, BY PRODUCT, 2023–2032 (USD MILLION)

TABLE 36 SOUTH KOREA: BIOPHARMACEUTICAL EXCIPIENTS MARKET, BY FORMULATION2023–2032 (USD MILLION)

TABLE 37 REST OF ASIA-PACIFIC: BIOPHARMACEUTICAL EXCIPIENTS MARKET, BY PRODUCT, 2023–2032 (USD MILLION)

TABLE 38 REST OF ASIA-PACIFIC: BIOPHARMACEUTICAL EXCIPIENTS MARKET, BY FORMULATION, 2023–2032 (USD MILLION)

TABLE 39 REST OF THE WORLD: BIOPHARMACEUTICAL EXCIPIENTS MARKET, BY PRODUCT, 2023–2032 (USD MILLION)

TABLE 40 REST OF THE WORLD: BIOPHARMACEUTICAL EXCIPIENTS MARKET, FORMULATION2023–2032 (USD MILLION)

TABLE 41 MIDDLE EAST: BIOPHARMACEUTICAL EXCIPIENTS MARKET, BY PRODUCT, 2023–2032 (USD MILLION)

TABLE 42 MIDDLE EAST: BIOPHARMACEUTICAL EXCIPIENTS MARKET, FORMULATION2023–2032 (USD MILLION)

TABLE 43 AFRICA: BIOPHARMACEUTICAL EXCIPIENTS MARKET, BY PRODUCT, 2023–2032 (USD MILLION)

TABLE 44 AFRICA: BIOPHARMACEUTICAL EXCIPIENTS MARKET, BY FORMULATION2023–2032 (USD MILLION)

TABLE 45 LATIN AMERICA: BIOPHARMACEUTICAL EXCIPIENTS MARKET, BY PRODUCT, 2023–2032 (USD MILLION)

TABLE 46 LATIN AMERICA: BIOPHARMACEUTICAL EXCIPIENTS MARKET, BY FORMULATION2023–2032 (USD MILLION)

LIST OF FIGURES

FIGURE 1 RESEARCH PROCESS

FIGURE 2 MARKET STRUCTURE FOR THE GLOBAL BIOPHARMACEUTICAL EXCIPIENTS MARKET

FIGURE 3 MARKET DYNAMICS FOR THE GLOBAL BIOPHARMACEUTICAL EXCIPIENTS MARKET

FIGURE 4 GLOBAL BIOPHARMACEUTICAL EXCIPIENTS MARKET SHARE, BY PRODUCT, 2020 (%)

FIGURE 5 GLOBAL BIOPHARMACEUTICAL EXCIPIENTS MARKET SHARE, BY FORMULATION, 2020 (%)

FIGURE 6 GLOBAL BIOPHARMACEUTICAL EXCIPIENTS MARKET SHARE, BY REGION, 2020 (%)

FIGURE 7 NORTH AMERICA: BIOPHARMACEUTICAL EXCIPIENTS MARKET SHARE, BY REGION, 2020 (%)

FIGURE 8 EUROPE: BIOPHARMACEUTICAL EXCIPIENTS MARKET SHARE, BY REGION, 2020 (%)

FIGURE 9 ASIA-PACIFIC: BIOPHARMACEUTICAL EXCIPIENTS MARKET SHARE, BY REGION, 2020 (%)

FIGURE 10 REST OF THE WORLD: BIOPHARMACEUTICAL EXCIPIENTS MARKET SHARE, BY REGION, 2020 (%)

FIGURE 11 GLOBAL BIOPHARMACEUTICAL EXCIPIENTS MARKET: COMPANY SHARE ANALYSIS, 2020 (%)

FIGURE 12 MERCK KGAA.: KEY FINANCIALS

FIGURE 13 MERCK KGAA.: SEGMENTAL REVENUE

FIGURE 14 MERCK KGAA.: REGIONAL REVENUE

FIGURE 15 COLORCON: KEY FINANCIALS

FIGURE 16 COLORCON: SEGMENTAL REVENUE

FIGURE 17 COLORCON: REGIONAL REVENUE

FIGURE 18 BASF SE: KEY FINANCIALS

FIGURE 19 BASF SE: SEGMENTAL REVENUE

FIGURE 20 BASF SE: REGIONAL REVENUE

FIGURE 21 ASSOCIATED BRITISH FOODS PLC S: KEY FINANCIALS

FIGURE 22 ASSOCIATED BRITISH FOODS PLC: SEGMENTAL REVENUE

FIGURE 23 ASSOCIATED BRITISH FOODS PLC: REGIONAL REVENUE

FIGURE 24 SIGNET EXCIPIENTS PVT. LTD (IMCD): KEY FINANCIALS

FIGURE 25 SIGNET EXCIPIENTS PVT. LTD (IMCD): SEGMENTAL REVENUE

FIGURE 26 SIGNET EXCIPIENTS PVT. LTD (IMCD): REGIONAL REVENUE

FIGURE 27 SIGACHI INDUSTRIES LIMITED: KEY FINANCIALS

FIGURE 28 SIGACHI INDUSTRIES LIMITED: SEGMENTAL REVENUE

FIGURE 29 SIGACHI INDUSTRIES LIMITED: REGIONAL REVENUE

FIGURE 30 SPECTRUM CHEMICAL MANUFACTURING CORP.: KEY FINANCIALS

FIGURE 31 SPECTRUM CHEMICAL MANUFACTURING CORP.: SEGMENTAL REVENUE

FIGURE 32 SPECTRUM CHEMICAL MANUFACTURING CORP.: REGIONAL REVENUE

FIGURE 33 ROQUETTE FRÈRES: KEY FINANCIALS

FIGURE 34 ROQUETTE FRÈRES: SEGMENTAL REVENUE

FIGURE 35 ROQUETTE FRÈRES: REGIONAL REVENUE

FIGURE 36 CLARIANT: KEY FINANCIALS

FIGURE 37 CLARIANT: SEGMENTAL REVENUE

FIGURE 38 CLARIANT: REGIONAL REVENUE

FIGURE 39 DFE PHARMA: KEY FINANCIALS

FIGURE 40 DFE PHARMA: SEGMENTAL REVENUE

FIGURE 41 DFE PHARMA: REGIONAL REVENUE

FIGURE 42 J. RETTENMAIER & SÖHNE GMBH + CO KG: KEY FINANCIALS

FIGURE 43 J. RETTENMAIER & SÖHNE GMBH + CO KG: SEGMENTAL REVENUE

FIGURE 44 J. RETTENMAIER & SÖHNE GMBH + CO KG: REGIONAL REVENUE

FIGURE 45 EVONIK INDUSTRIES AG: KEY FINANCIALS

FIGURE 46 EVONIK INDUSTRIES AG: SEGMENTAL REVENUE

FIGURE 47 EVONIK INDUSTRIES AG: REGIONAL REVENUE

Purchase Option
Single User $ 4,950
Multiuser License $ 5,950
Enterprise User $ 7,250
Compare Licenses
Tailored for You
  • Dedicated Research on any specifics segment or region.
  • Focused Research on specific players in the market.
  • Custom Report based only on your requirements.
  • Flexibility to add or subtract any chapter in the study.
  • Historic data from 2014 and forecasts outlook till 2040.
  • Flexibility of providing data/insights in formats (PDF, PPT, Excel).
  • Provide cross segmentation in applicable scenario/markets.