ID: MRFR/HC/9128-HCR | June 2021 | Region: Global | 120 Pages
TABLE OF CONTENTS
1. REPORT PROLOGUE
2. MARKET INTRODUCTION
2.1. Definition
2.2. Scope of the Study
2.2.1. Research Objective
2.2.2. Assumptions
2.2.3. Limitations
3. RESEARCH METHODOLOGY
3.1. Overview
3.2. Data Mining
3.3. Secondary Research
3.4. Primary Research
3.4.1. Primary Interviews and Information Gathering Process
3.4.2. Breakdown of Primary Respondents
3.5. Forecasting Cellulite Type
3.6. Market Size Estimation
3.6.1. Bottom-Up Approach
3.6.2. Top-Down Approach
3.7. Data Triangulation
3.8. Validation
4. MARKET DYNAMICS
4.1. Overview
4.2. Drivers
4.3. Restraints
4.4. Opportunities
5. MARKET FACTOR ANALYSIS
5.1. Porter’s Five Forces Analysis
5.1.1. Bargaining Power of Suppliers
5.1.2. Bargaining Power of Buyers
5.1.3. Threat of New Entrants
5.1.4. Threat of Substitutes
5.1.5. Intensity of Rivalry
5.2. Value Chain Analysis
5.3. COVID-19 Impact Analysis
5.3.1. Market Impact Analysis
5.3.2. Impact on Supply Chain
5.3.3. Regional Impact
5.3.4. Opportunity and Threat Analysis
6. GLOBAL BIOPHARMACEUTICAL EXCIPIENTS MARKET, BY PRODUCT
6.1. Overview
6.2. Solubilizers & Surfactants/Emulsifiers
Market Estimates & Forecast, by Region, 2018–2027
Market Estimates & Forecast, by Country, 2018–2027
6.2.1. Triglycerides
Market Estimates & Forecast, by Region, 2018–2027
Market Estimates & Forecast, by Country, 2018–2027
6.2.2. Esters
Market Estimates & Forecast, by Region, 2018–2027
Market Estimates & Forecast, by Country, 2018–2027
6.2.3. Others
Market Estimates & Forecast, by Region, 2018–2027
Market Estimates & Forecast, by Country, 2018–2027
6.3. Polyols
Market Estimates & Forecast, by Region, 2018–2027
Market Estimates & Forecast, by Country, 2018–2027
6.3.1. Mannitol
Market Estimates & Forecast, by Region, 2018–2027
Market Estimates & Forecast, by Country, 2018–2027
6.3.2. Sorbitol
Market Estimates & Forecast, by Region, 2018–2027
Market Estimates & Forecast, by Country, 2018–2027
6.3.3. Others
Market Estimates & Forecast, by Region, 2018–2027
Market Estimates & Forecast, by Country, 2018–2027
6.4. Carbohydrates
Market Estimates & Forecast, by Region, 2018–2027
Market Estimates & Forecast, by Country, 2018–2027
6.4.1. Sucrose
Market Estimates & Forecast, by Region, 2018–2027
Market Estimates & Forecast, by Country, 2018–2027
6.4.2. Dextrose
Market Estimates & Forecast, by Region, 2018–2027
Market Estimates & Forecast, by Country, 2018–2027
6.4.3. Starch
Market Estimates & Forecast, by Region, 2018–2027
Market Estimates & Forecast, by Country, 2018–2027
6.4.4. Others
Market Estimates & Forecast, by Region, 2018–2027
Market Estimates & Forecast, by Country, 2018–2027
7. GLOBAL BIOPHARMACEUTICAL EXCIPIENTS MARKET, BY FORMULATION
7.1. Overview
7.2. Oral
Market Estimates & Forecast, by Region, 2018–2027
Market Estimates & Forecast, by Country, 2018–2027
7.3. Topical
Market Estimates & Forecast, by Region, 2018–2027
Market Estimates & Forecast, by Country, 2018–2027
7.4. Injectables
Market Estimates & Forecast, by Region, 2018–2027
Market Estimates & Forecast, by Country, 2018–2027
8. GLOBAL BIOPHARMACEUTICAL EXCIPIENTS MARKET, BY REGION
8.1. Overview
8.2. North America
8.2.1. US
8.2.2. Canada
8.3. Europe
8.3.1. Germany
8.3.2. France
8.3.3. Italy
8.3.4. Spain
8.3.5. UK
8.3.6. Rest of Europe
8.4. Asia-Pacific
8.4.1. Japan
8.4.2. China
8.4.3. India
8.4.4. Australia
8.4.5. South Korea
8.4.6. Rest of Asia-Pacific
8.5. Rest of the World
8.5.1. Middle East
8.5.2. Africa
8.5.3. Latin America
9. COMPANY LANDSCAPE
9.1. Overview
9.2. Competitive Analysis
9.3. Market Share Analysis
9.4. Major Growth Strategy in the Global Biopharmaceutical Excipients Market
9.5. Competitive Benchmarking
9.6. Leading Players in terms of number of developments in the Global Biopharmaceutical Excipients Market
9.7. Key developments and Growth Strategies
9.7.1. New ProductLaunch/Service Deployment
9.7.2. Merger &Acquisitions
9.7.3. Joint Ventures
9.8. Major Players Financial Matrix
9.8.1. Sales & Operating Income, 2020
9.8.2. Major Players R&D Expenditure, 2020
10. COMPANY PROFILES
10.1. Merck KGaA
10.1.1. Company Overview
10.1.2. Product Offered
10.1.3. Financial Overview
10.1.4. Key Developments
10.1.5. SWOT Analysis
10.1.6. Key Strategies
10.2. Colorcon (BPSI Holdings Inc)
10.2.1. Company Overview
10.2.2. Products Offered
10.2.3. Financial Overview
10.2.4. Key Developments
10.2.5. SWOT Analysis
10.2.6. Key Strategies
10.3. BASF SE
10.3.1. Company Overview
10.3.2. Products Offered
10.3.3. Financial Overview
10.3.4. Key Developments
10.3.5. SWOT Analysis
10.3.6. Key Strategies
10.4. Associated British Foods plc
10.4.1. Company Overview
10.4.2. Products Offered
10.4.3. Financial Overview
10.4.4. Key Developments
10.4.5. SWOT Analysis
10.4.6. Key Strategies
10.5. Signet Excipients Pvt. Ltd (IMCD)
10.5.1. Company Overview
10.5.2. Products Offered
10.5.3. Financial Overview
10.5.4. Key Developments
10.5.5. SWOT Analysis
10.5.6. Key Strategies
10.6. Sigachi Industries Limited
10.6.1. Company Overview
10.6.2. Products Offered
10.6.3. Financial Overview
10.6.4. Key Developments
10.6.5. SWOT Analysis
10.6.6. Key Strategies
10.7. Spectrum Chemical Manufacturing Corp.
10.7.1. Company Overview
10.7.2. Products Offered
10.7.3. Financial Overview
10.7.4. Key Developments
10.7.5. SWOT Analysis
10.7.6. Key Strategies
10.8. Roquette Frères
10.8.1. Company Overview
10.8.2. Products Offered
10.8.3. Financial Overview
10.8.4. Key Developments
10.8.5. SWOT Analysis
10.8.6. Key Strategies
10.9. Clariant
10.9.1. Company Overview
10.9.2. Products Offered
10.9.3. Financial Overview
10.9.4. Key Developments
10.9.5. SWOT Analysis
10.9.6. Key Strategies
10.10. DFE Pharma
10.10.1. Company Overview
10.10.2. Products Offered
10.10.3. Financial Overview
10.10.4. Key Developments
10.10.5. SWOT Analysis
10.10.6. Key Strategies
10.11. J. Rettenmaier & Söhne GmbH + Co Kg
10.11.1. Company Overview
10.11.2. Products Offered
10.11.3. Financial Overview
10.11.4. Key Developments
10.11.5. SWOT Analysis
10.11.6. Key Strategies
10.12. Evonik Industries AG
10.12.1. Company Overview
10.12.2. Products Offered
10.12.3. Financial Overview
10.12.4. Key Developments
10.12.5. SWOT Analysis
10.12.6. Key Strategies
11. APPENDIX
11.1. References
11.2. Related Reports
 
LIST OF TABLES
TABLE 1 GLOBAL BIOPHARMACEUTICAL EXCIPIENTS MARKET SYNOPSIS, 2018–2027
TABLE 2 GLOBAL BIOPHARMACEUTICAL EXCIPIENTS MARKET ESTIMATES &FORECAST, 2018–2027 (USD MILLION)
TABLE 3 GLOBAL BIOPHARMACEUTICAL EXCIPIENTS MARKET, BYPRODUCT, 2018–2027 (USD MILLION)
TABLE 4 GLOBAL BIOPHARMACEUTICAL EXCIPIENTS MARKET, BY FORMULATION, 2018–2027 (USD MILLION)
TABLE 5 NORTH AMERICA: BIOPHARMACEUTICAL EXCIPIENTS MARKET, BY PRODUCT, 2018–2027 (USD MILLION)
TABLE 6 NORTH AMERICA BIOPHARMACEUTICAL EXCIPIENTS MARKET, BY FORMULATION, 2018–2027 (USD MILLION)
TABLE 7 US: BIOPHARMACEUTICAL EXCIPIENTS MARKET, BY PRODUCT, 2018–2027 (USD MILLION)
TABLE 8 US BIOPHARMACEUTICAL EXCIPIENTS MARKET, BY FORMULATION, 2018–2027 (USD MILLION)
TABLE 9 CANADA: BIOPHARMACEUTICAL EXCIPIENTS MARKET, PRODUCT, 2018–2027 (USD MILLION)
TABLE 10 CANADA BIOPHARMACEUTICAL EXCIPIENTS MARKET, BY FORMULATION, 2018–2027 (USD MILLION)
TABLE 11 EUROPE: BIOPHARMACEUTICAL EXCIPIENTS MARKET, BY PRODUCT, 2018–2027 (USD MILLION)
TABLE 12 EUROPE BIOPHARMACEUTICAL EXCIPIENTS MARKET, BY FORMULATION, 2018–2027 (USD MILLION)
TABLE 13 GERMANY: BIOPHARMACEUTICAL EXCIPIENTS MARKET, BY PRODUCT, 2018–2027 (USD MILLION)
TABLE 14 GERMANY: BIOPHARMACEUTICAL EXCIPIENTS MARKET, BY FORMULATION, 2018–2027 (USD MILLION)
TABLE 15 FRANCE: BIOPHARMACEUTICAL EXCIPIENTS MARKET, BY PRODUCT, 2018–2027 (USD MILLION)
TABLE 16 FRANCE: BIOPHARMACEUTICAL EXCIPIENTS MARKET, FORMULATION, 2018–2027 (USD MILLION)
TABLE 17 ITALY: BIOPHARMACEUTICAL EXCIPIENTS MARKET, BY PRODUCT, 2018–2027 (USD MILLION)
TABLE 18 ITALY: BIOPHARMACEUTICAL EXCIPIENTS MARKET, BY FORMULATION, 2018–2027 (USD MILLION)
TABLE 19 SPAIN: BIOPHARMACEUTICAL EXCIPIENTS MARKET, BY PRODUCT, 2018–2027 (USD MILLION)
TABLE 20 SPAIN: BIOPHARMACEUTICAL EXCIPIENTS MARKET, BY FORMULATION, 2018–2027 (USD MILLION)
TABLE 21 UK: BIOPHARMACEUTICAL EXCIPIENTS MARKET, BY PRODUCT, 2018–2027 (USD MILLION)
TABLE 22 UK: BIOPHARMACEUTICAL EXCIPIENTS MARKET, BY FORMULATION, 2018–2027 (USD MILLION)
TABLE 23 REST OF EUROPE: BIOPHARMACEUTICAL EXCIPIENTS MARKET, BY PRODUCT, 2018–2027 (USD MILLION)
TABLE 24 REST OF EUROPE: BIOPHARMACEUTICAL EXCIPIENTS MARKET, BY FORMULATION, 2018–2027 (USD MILLION)
TABLE 25 ASIA-PACIFIC: BIOPHARMACEUTICAL EXCIPIENTS MARKET, BY PRODUCT, 2018–2027 (USD MILLION)
TABLE 26 ASIA-PACIFIC: BIOPHARMACEUTICAL EXCIPIENTS MARKET, BY FORMULATION, 2018–2027 (USD MILLION)
TABLE 27 JAPAN: BIOPHARMACEUTICAL EXCIPIENTS MARKET, BY PRODUCT, 2018–2027 (USD MILLION)
TABLE 28 JAPAN: BIOPHARMACEUTICAL EXCIPIENTS MARKET, BY FORMULATION, 2018–2027 (USD MILLION)
TABLE 29 CHINA: BIOPHARMACEUTICAL EXCIPIENTS MARKET, BY PRODUCT, 2018–2027 (USD MILLION)
TABLE 30 CHINA: BIOPHARMACEUTICAL EXCIPIENTS MARKET, BY FORMULATION, 2018–2027 (USD MILLION)
TABLE 31 INDIA: BIOPHARMACEUTICAL EXCIPIENTS MARKET, BY PRODUCT, 2018–2027 (USD MILLION)
TABLE 32 INDIA: BIOPHARMACEUTICAL EXCIPIENTS MARKET, BY FORMULATION, 2018–2027 (USD MILLION)
TABLE 33 AUSTRALIA: BIOPHARMACEUTICAL EXCIPIENTS MARKET, BY PRODUCT, 2018–2027 (USD MILLION)
TABLE 34 AUSTRALIA: BIOPHARMACEUTICAL EXCIPIENTS MARKET, FORMULATION2018–2027 (USD MILLION)
TABLE 35 SOUTH KOREA: BIOPHARMACEUTICAL EXCIPIENTS MARKET, BY PRODUCT, 2018–2027 (USD MILLION)
TABLE 36 SOUTH KOREA: BIOPHARMACEUTICAL EXCIPIENTS MARKET, BY FORMULATION2018–2027 (USD MILLION)
TABLE 37 REST OF ASIA-PACIFIC: BIOPHARMACEUTICAL EXCIPIENTS MARKET, BY PRODUCT, 2018–2027 (USD MILLION)
TABLE 38 REST OF ASIA-PACIFIC: BIOPHARMACEUTICAL EXCIPIENTS MARKET, BY FORMULATION, 2018–2027 (USD MILLION)
TABLE 39 REST OF THE WORLD: BIOPHARMACEUTICAL EXCIPIENTS MARKET, BY PRODUCT, 2018–2027 (USD MILLION)
TABLE 40 REST OF THE WORLD: BIOPHARMACEUTICAL EXCIPIENTS MARKET, FORMULATION2018–2027 (USD MILLION)
TABLE 41 MIDDLE EAST: BIOPHARMACEUTICAL EXCIPIENTS MARKET, BY PRODUCT, 2018–2027 (USD MILLION)
TABLE 42 MIDDLE EAST: BIOPHARMACEUTICAL EXCIPIENTS MARKET, FORMULATION2018–2027 (USD MILLION)
TABLE 43 AFRICA: BIOPHARMACEUTICAL EXCIPIENTS MARKET, BY PRODUCT, 2018–2027 (USD MILLION)
TABLE 44 AFRICA: BIOPHARMACEUTICAL EXCIPIENTS MARKET, BY FORMULATION2018–2027 (USD MILLION)
TABLE 45 LATIN AMERICA: BIOPHARMACEUTICAL EXCIPIENTS MARKET, BY PRODUCT, 2018–2027 (USD MILLION)
TABLE 46 LATIN AMERICA: BIOPHARMACEUTICAL EXCIPIENTS MARKET, BY FORMULATION2018–2027 (USD MILLION)
LIST OF FIGURES
FIGURE 1 RESEARCH PROCESS
FIGURE 2 MARKET STRUCTURE FOR THE GLOBAL BIOPHARMACEUTICAL EXCIPIENTS MARKET
FIGURE 3 MARKET DYNAMICS FOR THE GLOBAL BIOPHARMACEUTICAL EXCIPIENTS MARKET
FIGURE 4 GLOBAL BIOPHARMACEUTICAL EXCIPIENTS MARKET SHARE, BY PRODUCT, 2020 (%)
FIGURE 5 GLOBAL BIOPHARMACEUTICAL EXCIPIENTS MARKET SHARE, BY FORMULATION, 2020 (%)
FIGURE 6 GLOBAL BIOPHARMACEUTICAL EXCIPIENTS MARKET SHARE, BY REGION, 2020 (%)
FIGURE 7 NORTH AMERICA: BIOPHARMACEUTICAL EXCIPIENTS MARKET SHARE, BY REGION, 2020 (%)
FIGURE 8 EUROPE: BIOPHARMACEUTICAL EXCIPIENTS MARKET SHARE, BY REGION, 2020 (%)
FIGURE 9 ASIA-PACIFIC: BIOPHARMACEUTICAL EXCIPIENTS MARKET SHARE, BY REGION, 2020 (%)
FIGURE 10 REST OF THE WORLD: BIOPHARMACEUTICAL EXCIPIENTS MARKET SHARE, BY REGION, 2020 (%)
FIGURE 11 GLOBAL BIOPHARMACEUTICAL EXCIPIENTS MARKET: COMPANY SHARE ANALYSIS, 2020 (%)
FIGURE 12 MERCK KGAA.: KEY FINANCIALS
FIGURE 13 MERCK KGAA.: SEGMENTAL REVENUE
FIGURE 14 MERCK KGAA.: REGIONAL REVENUE
FIGURE 15 COLORCON: KEY FINANCIALS
FIGURE 16 COLORCON: SEGMENTAL REVENUE
FIGURE 17 COLORCON: REGIONAL REVENUE
FIGURE 18 BASF SE: KEY FINANCIALS
FIGURE 19 BASF SE: SEGMENTAL REVENUE
FIGURE 20 BASF SE: REGIONAL REVENUE
FIGURE 21 ASSOCIATED BRITISH FOODS PLC S: KEY FINANCIALS
FIGURE 22 ASSOCIATED BRITISH FOODS PLC: SEGMENTAL REVENUE
FIGURE 23 ASSOCIATED BRITISH FOODS PLC: REGIONAL REVENUE
FIGURE 24 SIGNET EXCIPIENTS PVT. LTD (IMCD): KEY FINANCIALS
FIGURE 25 SIGNET EXCIPIENTS PVT. LTD (IMCD): SEGMENTAL REVENUE
FIGURE 26 SIGNET EXCIPIENTS PVT. LTD (IMCD): REGIONAL REVENUE
FIGURE 27 SIGACHI INDUSTRIES LIMITED: KEY FINANCIALS
FIGURE 28 SIGACHI INDUSTRIES LIMITED: SEGMENTAL REVENUE
FIGURE 29 SIGACHI INDUSTRIES LIMITED: REGIONAL REVENUE
FIGURE 30 SPECTRUM CHEMICAL MANUFACTURING CORP.: KEY FINANCIALS
FIGURE 31 SPECTRUM CHEMICAL MANUFACTURING CORP.: SEGMENTAL REVENUE
FIGURE 32 SPECTRUM CHEMICAL MANUFACTURING CORP.: REGIONAL REVENUE
FIGURE 33 ROQUETTE FRÈRES: KEY FINANCIALS
FIGURE 34 ROQUETTE FRÈRES: SEGMENTAL REVENUE
FIGURE 35 ROQUETTE FRÈRES: REGIONAL REVENUE
FIGURE 36 CLARIANT: KEY FINANCIALS
FIGURE 37 CLARIANT: SEGMENTAL REVENUE
FIGURE 38 CLARIANT: REGIONAL REVENUE
FIGURE 39 DFE PHARMA: KEY FINANCIALS
FIGURE 40 DFE PHARMA: SEGMENTAL REVENUE
FIGURE 41 DFE PHARMA: REGIONAL REVENUE
FIGURE 42 J. RETTENMAIER & SÖHNE GMBH + CO KG: KEY FINANCIALS
FIGURE 43 J. RETTENMAIER & SÖHNE GMBH + CO KG: SEGMENTAL REVENUE
FIGURE 44 J. RETTENMAIER & SÖHNE GMBH + CO KG: REGIONAL REVENUE
FIGURE 45 EVONIK INDUSTRIES AG: KEY FINANCIALS
FIGURE 46 EVONIK INDUSTRIES AG: SEGMENTAL REVENUE
FIGURE 47 EVONIK INDUSTRIES AG: REGIONAL REVENUE
$3,114.6 million
6.8%
North America
2020-2027
Biopharmaceutical Excipients Market Overview:
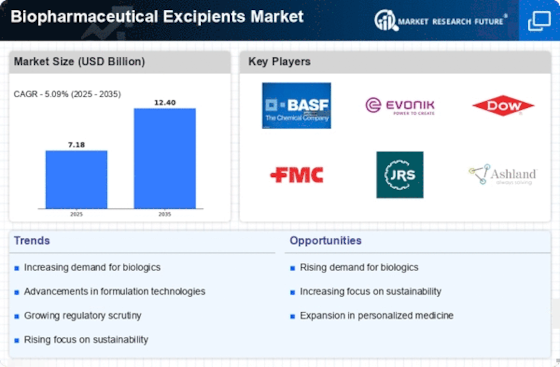
The biopharmaceutical excipients market is expected to cross USD 3,114.6 million by 2027 at a CAGR of~6.8%. A biopharmaceutical excipient is an inert drug delivery substance methodologically prepared with the medically active ingredient that further processes the drug delivery in the recipient's system. Excipients are stable and reproducible, pharmacologically inert, and cost-effective. They are composed of corn, wheat, sugar, minerals, and othersuch substances. Biopharmaceutical excipients are available in different types of formulations such as capsules, topical creams, tablets, gels, injectables, and transdermal patches. In addition, these types of excipients provide accurate dosing of potent ingredients, offer mechanical strength to the ingredients, increase the surface area for the active ingredient, protect the medication from the environmental reaction, and mask the texture, smell, and taste of the drug.
Biopharmaceutical excipients are experiencing high demand due to increasing production of drugs during the pandemic outbreak, supporting government policies, and introduction of partial subsidy schemes minimizing production costs. The outbreak of the coronavirus across the globe created huge demands for specialized medicines that further drive excipient sales. The market players offer specific excipients for biopharmaceuticals that are composed of sucrose, sodium chloride, magnesium chloride hexahydrate, and disodium edetate dehydrate. Moreover, the increasing number of patients getting diagnosed with chronic disease is creating possibilities for the biopharmaceutical excipients manufacturers. The market growth is driven by the above-mentioned factors and is expected to accelerate during the forecast period.
COVID-19 Analysis
COVID-19 has impacted various industry verticals across the globe. The pandemic spread led to the closure of manufacturing units, transportation of raw materials, and distribution channels throughout the globe. During the initial days of lockdown, the production of drugs and health-related products ceased to avoid the spread of disease. The government authorities mandate the guidelines to restrict the ongoing R&D activities and biopharmaceutical manufacturing. However, the demand for generic and specialty medicines rose due to the increasing number of corona cases and existing patients diagnosed with chronic diseases. The pharmaceutical production was carried out with special guidelines, and the research laboratories were functional with a limited workforce.
The increasing number of COVID cases impulsed government authorities to manufacture drugs in a large volume to treat the affected patients. However, the manufacturing units were working with a low workforce as the employees and daily wagers traveled back to their hometown, limiting the production capacity of the organizations. The government authorities promised to provide meals, insurance and, higher wages for immediate deployment of the workforce in pharmaceutical manufacturing units. This created an opportunity for the biopharmaceutical excipient manufacturers and augmented the product sales during the pandemic outbreak.
Market Dynamics
Drivers
Increasing demand for sucrose-based excipients for medicine formulation
Growing demand for lipid excipient for the production of COVID vaccines
Rising demand for stable and economical excipient for generic medicines
Market Restraints
Concerns pertaining to the adverse effects of biopharmaceutical excipients
Technology Analysis
Nanotechnology is significantly being used in the development of advanced excipients. The use of nanotechnology will alter the size of the excipients from capsules and tablets to solidified micelles. The emergence of such technology aims to improve the drug delivery of medicines. Additionally, nanotech can be used to improve the hindered release of formulations. According to a study in the Journal of Pharmaceutical Sciences, the porous magnesium carbonate excipient can control the release of active pharmaceutical ingredients. Moreover, the introduction of 3D printing aims at augmenting the production of new generation excipient. It is used for the fabrication of the immediate release pharmaceutical tablets. The emergence of such technologies is propelling the biopharmaceutical excipients market.
Segment Overview
By Product
By Formulation
Regional Analysis
North America
Increasing demand for medicines across the region is driving the North America biopharmaceutical excipients market
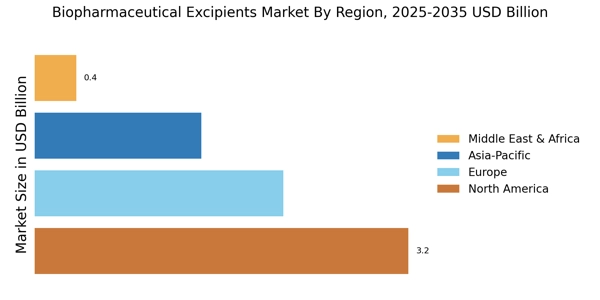
North America held the largest share of the global biopharmaceutical excipient market in 2020 due to the increasing manufacturing of generic and specialty drugs, growing investments in R&D activities, and the establishment of technically advanced research centers. The prominent players are involved in the diversification of their distribution channel and expansion of their manufacturing facilities across the region, engaging in mergers and acquisitions, and introduction of new product variants for business growth.
Asia Pacific
Supportive government policiesarepropelling the Asia-Pacific biopharmaceutical excipient market
The Asia-Pacific biopharmaceutical excipients market is projected to be the fastest-growing regional market due to the up-gradation of pharmaceutical manufacturing units, an increasing number of biopharmaceutical investors, supportive government policies for the production of medicines, and deployment of nanotech labs for innovation of advanced excipients. Moreover, other factors supporting the biopharmaceutical excipient market include substantial investments by industry players and the innovation of machines to produce a high volume of excipients in a limited time. Such factors are expected to propel the market growth during the forecast period.
Competitive Landscape
Colorcon (US) is one of the leading players in the biopharmaceutical excipients market, offering products such as starch 1500, startab, starcap, and ambaerlite, and duolite ion exchange resin. These excipients can stabilize moisture-sensitive drugs, offer low dose content uniformity, and are compliant with regulatory standards. In addition, products such as startab are compressible starch excipients that provide excellent flow and compressibility. The product is manufactured at GMP facilities and is compliant with government guidelines. Moreover, satrcap a maize starch excipient, offers high flow and low adhesion functionality. Starcap provides lasting stability to reactive drugs. Furthermore, the company introduced ion-exchange resin-based excipients that are applied for taste masking, solubility enhancing, drug stabilizing, and abuse deterrence.
Industry players are coming up with various commercial strategies to augment their market footprint. The organizations are capitalizing on innovations and product launches to expand their product portfolio, further driving the biopharmaceutical excipients market. In addition, the market players are offering contractual agreements, approvals from government authorities, collaborations, funding, product promotions, and partnering with other players to expand their global footprint.
List of Key Companies Covered in this Report:
Report Overview
The study covers the existing short-term and long-term market effect, as well as helping decision-makers to draught short-term and long-term plans for businesses by region. The report covers major regions in North America, Europe, Asia-Pacific, and the Rest of the World. The report analyzes market drivers, restraints, opportunities, challenges, Porter's Five Forces, Value Chain, and impact of COVID on the market.
Scope of the Report & Segmentation
By Product
By Formulation
Report Attribute/Metric | Details |
---|---|
Market Size | 2027:~USD 3,114.6Million |
CAGR | ~6.8% |
Base Year | 2020 |
Forecast Period | 2021-2027 |
Historical Data | 2018-2019 |
Forecast Units | Value (USD Million) |
Report Coverage | Revenue Forecast, Competitive Landscape, Growth Factors, and Trends |
Segments Covered | Treatment Procedure, Cellulite Type and End Use |
Geographies Covered | North America, Europe, Asia-Pacific, and Rest of the World (RoW) |
Key Vendors | Merck KGaA (Germany), Colorcon (BPSI Holdings Inc.) (U.S.), BASF SE(Germany), Associated British Foods plc (UK), Signet Excipients Pvt. Ltd (IMCD) (Netherlands), Sigachi Industries Limited (Hyderabad), Spectrum Chemical Manufacturing Corp. (U.S.), Roquette Frères (Roquette Frères) Clariant (Switzerland), DFE Pharma (Germany) J. Rettenmaier&SöhneGmbh + Co Kg (Germany) Evonik Industries AG (Germany) |
Key Market Opportunities | The emrgence of 3D pinters for customized drug manufacturing |
Key Market Drivers | Increasing demand of sucrose based excipients for medicine formulation |