Bioliquid Heat & Power Generation Market Segmentation
Bioliquid Heat & Power Generation Market By Bioliquid Heat & Power Generation Market (USD Billion, 2025-2035)
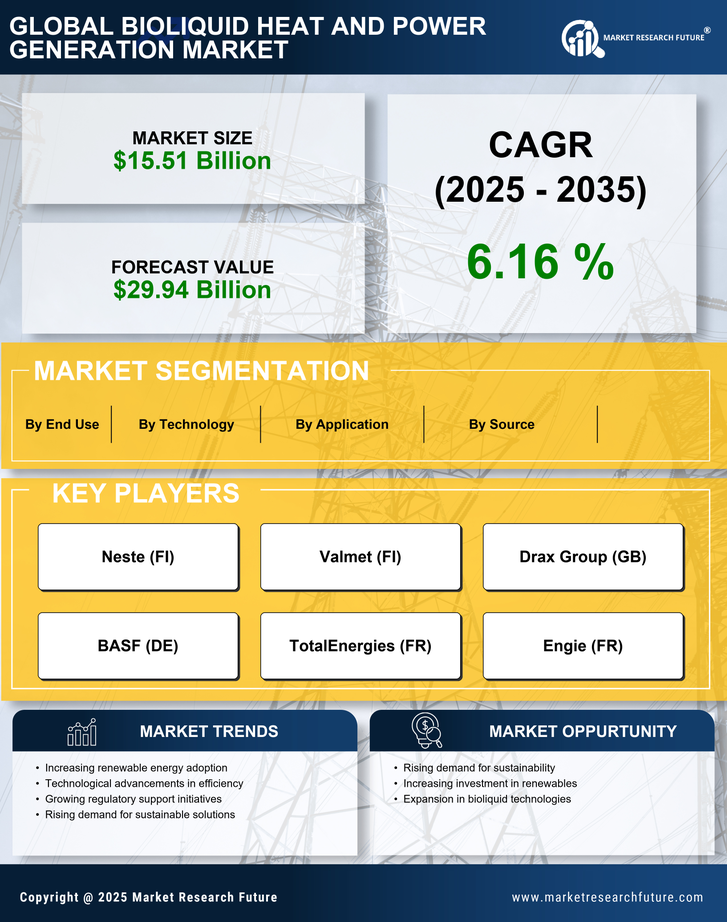
- Thermal Energy Conversion
- Internal Combustion Engine
- Gas Turbine
- Microbial Fuel Cell
Bioliquid Heat & Power Generation Market By Source (USD Billion, 2025-2035)
- Bioethanol
- Biodiesel
- Biogas
- Vegetable Oil
Bioliquid Heat & Power Generation Market By Application (USD Billion, 2025-2035)
- District Heating
- Combined Heat and Power
- Power Generation
Bioliquid Heat & Power Generation Market By End Use (USD Billion, 2025-2035)
- Residential
- Commercial
- Industrial