Table of Contents
1. EXECUTIVE SUMMARY
2. MARKET INTRODUCTION
2.1. Market Definition
2.2. Scope of the Study
2.2.1. Research Objectives
2.2.2. Assumptions & Limitations
2.3. Market Structure
3. MARKET RESEARCH METHODOLOGY
3.1. Research Process
3.2. Secondary Research
3.3. Primary Research
3.4. Forecast Model
4. MARKET LANDSCAPE
4.1. Supply Chain Analysis
4.1.1. Raw Material Suppliers
4.1.2. Manufacturers/Producers
4.1.3. Distributors/Retailers/Wholesalers/E-Commerce
4.1.4. Distribution Channels
4.2. Porter’s Five Forces Analysis
4.2.1. Threat of New Entrants
4.2.2. Bargaining Power of Buyers
4.2.3. Bargaining Power of Suppliers
4.2.4. Threat of Substitutes
4.2.5. Internal Rivalry
5. MARKET DYNAMICS OF THE GLOBAL BIODEGRADABLE TABLEWARE MARKET
5.1. Introduction
5.2. Drivers
5.3. Restraints
5.4. Opportunities
5.5. Challenges
6. GLOBAL BIODEGRADABLE TABLEWARE MARKET, BY PRODUCT TYPE
6.1. Introduction
6.1.1. Market Estimates & Forecast, by Product Type, 2023–2030
6.1.2. Market Estimates & Forecast, by Region, 2023–2030
6.2. Plates
6.2.1. Plates: Market Estimates & Forecast, 2023–2030
6.2.2. Plates: Market Estimates & Forecast, by Region, 2023–2030
6.3. Bowls
6.3.1. Bowls: Market Estimates & Forecast, 2023–2030
6.3.2. Bowls: Market Estimates & Forecast, by Region, 2023–2030
6.4. Cups
6.4.1. Cups: Market Estimates & Forecast, 2023–2030
6.4.2. Cups: Market Estimates & Forecast, by Region, 2023–2030
6.5. Cutlery
6.5.1. Cutlery: Market Estimates & Forecast, 2023–2030
6.5.2. Cutlery: Market Estimates & Forecast, by Region, 2023–2030
6.6. Others
6.6.1. Others: Market Estimates & Forecast, 2023–2030
6.6.2. Others: Market Estimates & Forecast, by Region, 2023–2030
7. GLOBAL BIODEGRADABLE TABLEWARE MARKET, BY MATERIAL TYPE
7.1. Introduction
7.1.1. Market Estimates & Forecast, by Material Type, 2023–2030
7.1.2. Market Estimates & Forecast, by Region, 2023–2030
7.2. Paper
7.2.1. Paper: Market Estimates & Forecast, 2023–2030
7.2.2. Paper: Market Estimates & Forecast, by Region, 2023–2030
7.3. Bioplastic
7.3.1. Bioplastic: Market Estimates & Forecast, 2023–2030
7.3.2. Bioplastic: Market Estimates & Forecast, by Region, 2023–2030
7.4. Wood
7.4.1. Wood: Market Estimates & Forecast, 2023–2030
7.4.2. Wood: Market Estimates & Forecast, by Region, 2023–2030
7.5. Others
7.5.1. Others: Market Estimates & Forecast, 2023–2030
7.5.2. Others: Market Estimates & Forecast, by Region, 2023–2030
8. GLOBAL BIODEGRADABLE TABLEWARE MARKET, BY DISTRIBUTION CHANNEL
8.1. Introduction
8.1.1. Market Estimates & Forecast, by Distribution Channel, 2023–2030
8.1.2. Market Estimates & Forecast, by Region, 2023–2030
8.2. Store-Based
8.2.1. Store-Based: Market Estimates & Forecast, 2023–2030
8.2.2. Store-Based: Market Estimates & Forecast, by Region, 2023–2030
8.2.3. Supermarkets & Hypermarkets
8.2.3.1. Supermarkets & Hypermarkets: Market Estimates & Forecast, 2023–2030
8.2.3.2. Supermarkets & Hypermarkets: Market Estimates & Forecast, by Region, 2023–2030
8.2.4. Convenience Stores
8.2.4.1. Convenience Stores: Market Estimates & Forecast, 2023–2030
8.2.4.2. Convenience Stores: Market Estimates & Forecast, by Region, 2023–2030
8.2.5. Others
8.2.5.1. Others: Market Estimates & Forecast, 2023–2030
8.2.5.2. Others: Market Estimates & Forecast, by Region, 2023–2030
8.3. Non-Store-Based
8.3.1. Non-Store-Based: Market Estimates & Forecast, 2023–2030
8.3.2. Non-Store-Based: Market Estimates & Forecast, by Region, 2023–2030
9. GLOBAL BIODEGRADABLE TABLEWARE MARKET, BY REGION
9.1. Introduction
9.2. North America
9.2.1. Market Estimates & Forecast, 2023–2030
9.2.2. Market Estimates & Forecast, by Product Type, 2023–2030
9.2.3. Market Estimates & Forecast, by Material Type, 2023–2030
9.2.4. Market Estimates & Forecast, by Distribution Channel, 2023–2030
9.2.5. Market Estimates & Forecast, by Country, 2023–2030
9.2.6. US
9.2.6.1. Market Estimates & Forecast, by Product Type, 2023–2030
9.2.6.2. Market Estimates & Forecast, by Material Type, 2023–2030
9.2.6.3. Market Estimates & Forecast, by Distribution Channel, 2023–2030
9.2.7. Canada
9.2.7.1. Market Estimates & Forecast, by Product Type, 2023–2030
9.2.7.2. Market Estimates & Forecast, by Material Type, 2023–2030
9.2.7.3. Market Estimates & Forecast, by Distribution Channel, 2023–2030
9.2.8. Mexico
9.2.8.1. Market Estimates & Forecast, by Product Type, 2023–2030
9.2.8.2. Market Estimates & Forecast, by Material Type, 2023–2030
9.2.8.3. Market Estimates & Forecast, by Distribution Channel, 2023–2030
9.3. Europe
9.3.1. Market Estimates & Forecast, 2023–2030
9.3.2. Market Estimates & Forecast, by Product Type, 2023–2030
9.3.3. Market Estimates & Forecast, by Material Type, 2023–2030
9.3.4. Market Estimates & Forecast, by Distribution Channel, 2023–2030
9.3.5. Market Estimates & Forecast, by Country, 2023–2030
9.3.6. Germany
9.3.6.1. Market Estimates & Forecast, by Product Type, 2023–2030
9.3.6.2. Market Estimates & Forecast, by Material Type, 2023–2030
9.3.6.3. Market Estimates & Forecast, by Distribution Channel, 2023–2030
9.3.7. UK
9.3.7.1. Market Estimates & Forecast, by Product Type, 2023–2030
9.3.7.2. Market Estimates & Forecast, by Material Type, 2023–2030
9.3.7.3. Market Estimates & Forecast, by Distribution Channel, 2023–2030
9.3.8. France
9.3.8.1. Market Estimates & Forecast, by Product Type, 2023–2030
9.3.8.2. Market Estimates & Forecast, by Material Type, 2023–2030
9.3.8.3. Market Estimates & Forecast, by Distribution Channel, 2023–2030
9.3.9. Spain
9.3.9.1. Market Estimates & Forecast, by Product Type, 2023–2030
9.3.9.2. Market Estimates & Forecast, by Material Type, 2023–2030
9.3.9.3. Market Estimates & Forecast, by Distribution Channel, 2023–2030
9.3.10. Italy
9.3.10.1. Market Estimates & Forecast, by Product Type, 2023–2030
9.3.10.2. Market Estimates & Forecast, by Material Type, 2023–2030
9.3.10.3. Market Estimates & Forecast, by Distribution Channel, 2023–2030
9.3.11. Rest of Europe
9.3.11.1. Market Estimates & Forecast, by Product Type, 2023–2030
9.3.11.2. Market Estimates & Forecast, by Material Type, 2023–2030
9.3.11.3. Market Estimates & Forecast, by Distribution Channel, 2023–2030
9.4. Asia-Pacific
9.4.1. Market Estimates & Forecast, 2023–2030
9.4.2. Market Estimates & Forecast, by Product Type, 2023–2030
9.4.3. Market Estimates & Forecast, by Material Type, 2023–2030
9.4.4. Market Estimates & Forecast, by Distribution Channel, 2023–2030
9.4.5. Market Estimates & Forecast, by Country, 2023–2030
9.4.6. China
9.4.6.1. Market Estimates & Forecast, by Product Type, 2023–2030
9.4.6.2. Market Estimates & Forecast, by Material Type, 2023–2030
9.4.6.3. Market Estimates & Forecast, by Distribution Channel, 2023–2030
9.4.7. Japan
9.4.7.1. Market Estimates & Forecast, by Product Type, 2023–2030
9.4.7.2. Market Estimates & Forecast, by Material Type, 2023–2030
9.4.7.3. Market Estimates & Forecast, by Distribution Channel, 2023–2030
9.4.8. India
9.4.8.1. Market Estimates & Forecast, by Product Type, 2023–2030
9.4.8.2. Market Estimates & Forecast, by Material Type, 2023–2030
9.4.8.3. Market Estimates & Forecast, by Distribution Channel, 2023–2030
9.4.9. Australia & New Zealand
9.4.9.1. Market Estimates & Forecast, by Product Type, 2023–2030
9.4.9.2. Market Estimates & Forecast, by Material Type, 2023–2030
9.4.9.3. Market Estimates & Forecast, by Distribution Channel, 2023–2030
9.4.10. Rest of Asia-Pacific
9.4.10.1. Market Estimates & Forecast, by Product Type, 2023–2030
9.4.10.2. Market Estimates & Forecast, by Material Type, 2023–2030
9.4.10.3. Market Estimates & Forecast, by Distribution Channel, 2023–2030
9.5. Rest of the World
9.5.1. Market Estimates & Forecast, 2023–2030
9.5.2. Market Estimates & Forecast, by Product Type, 2023–2030
9.5.3. Market Estimates & Forecast, by Material Type, 2023–2030
9.5.4. Market Estimates & Forecast, by Distribution Channel, 2023–2030
9.5.5. Market Estimates & Forecast, by Region, 2023–2030
9.5.6. South America
9.5.6.1. Market Estimates & Forecast, by Product Type, 2023–2030
9.5.6.2. Market Estimates & Forecast, by Material Type, 2023–2030
9.5.6.3. Market Estimates & Forecast, by Distribution Channel, 2023–2030
9.5.7. Middle East
9.5.7.1. Market Estimates & Forecast, by Product Type, 2023–2030
9.5.7.2. Market Estimates & Forecast, by Material Type, 2023–2030
9.5.7.3. Market Estimates & Forecast, by Distribution Channel, 2023–2030
9.5.8. Africa
9.5.8.1. Market Estimates & Forecast, by Product Type, 2023–2030
9.5.8.2. Market Estimates & Forecast, by Material Type, 2023–2030
9.5.8.3. Market Estimates & Forecast, by Distribution Channel, 2023–2030
10. COMPETITIVE LANDSCAPE
10.1. Introduction
10.2. Market Strategy
10.3. Key Development Analysis
(Expansions/Mergers & Acquisitions/Joint Ventures/New Product Developments/Agreements/Investments)
11. COMPANY PROFILES
11.1. Huhtamäki Oyj
11.1.1. Company Overview
11.1.2. Financial Updates
11.1.3. Product/Business Segment Overview
11.1.4. Strategies
11.1.5. Key Developments
11.1.6. SWOT Analysis
11.2. Dart Container Corporation
11.2.1. Company Overview
11.2.2. Financial Updates
11.2.3. Product/Business Segment Overview
11.2.4. Strategies
11.2.5. Key Developments
11.2.6. SWOT Analysis
11.3. Georgia-Pacific LLC
11.4. Company Overview
11.4.1. Financial Updates
11.4.2. Product/Business Segment Overview
11.4.3. Strategies
11.4.4. Key Developments
11.4.5. SWOT Analysis
11.5. Lollicup USA Inc.
11.5.1. Company Overview
11.5.2. Financial Updates
11.5.3. Product/Business Segment Overview
11.5.4. Strategies
11.5.5. Key Developments
11.5.6. SWOT Analysis
11.6. Solia, Inc.
11.6.1. Company Overview
11.6.2. Financial Updates
11.6.3. Product/Business Segment Overview
11.6.4. Strategies
11.6.5. Key Developments
11.6.6. SWOT Analysis
11.7. Natural Tableware
11.7.1. Company Overview
11.7.2. Financial Updates
11.7.3. Product/Business Segment Overview
11.7.4. Strategies
11.7.5. Key Developments
11.7.6. SWOT Analysis
11.8. Reynolds Consumer Products LLC
11.8.1. Company Overview
11.8.2. Financial Updates
11.8.3. Product/Business Segment Overview
11.8.4. Strategies
11.8.5. Key Developments
11.8.6. SWOT Analysis
11.9. Pactiv LLC
11.9.1. Company Overview
11.9.2. Financial Updates
11.9.3. Product/Business Segment Overview
11.9.4. Strategies
11.9.5. Key Developments
11.9.6. SWOT Analysis
11.10. Eco Guardian
11.10.1. Company Overview
11.10.2. Financial Updates
11.10.3. Product/Business Segment Overview
11.10.4. Strategies
11.10.5. Key Developments
11.10.6. SWOT Analysis
11.11. Genpak, LLC
11.11.1. Company Overview
11.11.2. Financial Updates
11.11.3. Product/Business Segment Overview
11.11.4. Strategies
11.11.5. Key Developments
11.11.6. SWOT Analysis
11.12. Biotrem
11.12.1. Company Overview
11.12.2. Financial Updates
11.12.3. Product/Business Segment Overview
11.12.4. Strategies
11.12.5. Key Developments
11.12.6. SWOT Analysis
11.13. Better Earth LLC
11.13.1. Company Overview
11.13.2. Financial Updates
11.13.3. Product/Business Segment Overview
11.13.4. Strategies
11.13.5. Key Developments
11.13.6. SWOT Analysis
11.14. Vegware
11.14.1. Company Overview
11.14.2. Financial Updates
11.14.3. Product/Business Segment Overview
11.14.4. Strategies
11.14.5. Key Developments
11.14.6. SWOT Analysis
11.15. Papstar GmbH
11.15.1. Company Overview
11.15.2. Financial Updates
11.15.3. Product/Business Segment Overview
11.15.4. Strategies
11.15.5. Key Developments
11.15.6. SWOT Analysis
11.16. Bionatic GmbH & Co. KG (Germany)
11.16.1. Company Overview
11.16.2. Financial Updates
11.16.3. Product/Business Segment Overview
11.16.4. Strategies
11.16.5. Key Developments
11.16.6. SWOT Analysis
12. APPENDIX
12.1. General Sources & References
12.2. List of Abbreviations
LIST OF TABLES
Table 1 Global Biodegradable Tableware Market, by Region, 2023–2030 (USD Million)
Table 2 Global Biodegradable Tableware Market, by Product Type, 2023–2030 (USD Million)
Table 3 Global Biodegradable Tableware Market, by Material Type, 2023–2030 (USD Million)
Table 4 Global Biodegradable Tableware Market, by Distribution Channel, 2023–2030 (USD Million)
Table 5 North America: Biodegradable Tableware Market, by Country, 2023–2030 (USD Million)
Table 6 North America: Biodegradable Tableware Market, by Product Type, 2023–2030 (USD Million)
Table 7 North America: Biodegradable Tableware Market, by Material Type, 2023–2030 (USD Million)
Table 8 North America: Biodegradable Tableware Market, by Distribution Channel, 2023–2030 (USD Million)
Table 9 US: Biodegradable Tableware Market, by Product Type, 2023–2030 (USD Million)
Table 10 US: Biodegradable Tableware Market, by Material Type, 2023–2030 (USD Million)
Table 11 US: Biodegradable Tableware Market, by Distribution Channel, 2023–2030 (USD Million)
Table 12 Canada: Biodegradable Tableware Market, by Product Type, 2023–2030 (USD Million)
Table 13 Canada: Biodegradable Tableware Market, by Material Type, 2023–2030 (USD Million)
Table 14 Canada: Biodegradable Tableware Market, by Distribution Channel, 2023–2030 (USD Million)
Table 15 Mexico: Biodegradable Tableware Market, by Product Type, 2023–2030 (USD Million)
Table 16 Mexico: Biodegradable Tableware Market, by Material Type, 2023–2030 (USD Million)
Table 17 Mexico: Biodegradable Tableware Market, by Distribution Channel, 2023–2030 (USD Million)
Table 18 Europe: Biodegradable Tableware Market, by Country, 2023–2030 (USD Million)
Table 19 Europe: Biodegradable Tableware Market, by Product Type, 2023–2030 (USD Million)
Table 20 Europe: Biodegradable Tableware Market, by Material Type, 2023–2030 (USD Million)
Table 21 Europe: Biodegradable Tableware Market, by Distribution Channel, 2023–2030 (USD Million)
Table 22 Germany: Biodegradable Tableware Market, by Product Type, 2023–2030 (USD Million)
Table 23 Germany: Biodegradable Tableware Market, by Material Type, 2023–2030 (USD Million)
Table 24 Germany: Biodegradable Tableware Market, by Distribution Channel, 2023–2030 (USD Million)
Table 25 France: Biodegradable Tableware Market, by Product Type, 2023–2030 (USD Million)
Table 26 France: Biodegradable Tableware Market, by Material Type, 2023–2030 (USD Million)
Table 27 France: Biodegradable Tableware Market, by Distribution Channel, 2023–2030 (USD Million)
Table 28 Italy: Biodegradable Tableware Market, by Product Type, 2023–2030 (USD Million)
Table 29 Italy: Biodegradable Tableware Market, by Material Type, 2023–2030 (USD Million)
Table 30 Italy: Biodegradable Tableware Market, by Distribution Channel, 2023–2030 (USD Million)
Table 31 Spain: Biodegradable Tableware Market, by Product Type, 2023–2030 (USD Million)
Table 32 Spain: Biodegradable Tableware Market, by Material Type, 2023–2030 (USD Million)
Table 33 Spain: Biodegradable Tableware Market, by Distribution Channel, 2023–2030 (USD Million)
Table 34 UK: Biodegradable Tableware Market, by Product Type, 2023–2030 (USD Million)
Table 35 UK: Biodegradable Tableware Market, by Material Type, 2023–2030 (USD Million)
Table 36 UK: Biodegradable Tableware Market, by Distribution Channel, 2023–2030 (USD Million)
Table 37 Rest of Europe: Biodegradable Tableware Market, by Product Type, 2023–2030 (USD Million)
Table 38 Rest of Europe: Biodegradable Tableware Market, by Material Type, 2023–2030 (USD Million)
Table 39 Rest of Europe: Biodegradable Tableware Market, by Distribution Channel, 2023–2030 (USD Million)
Table 40 Asia-Pacific: Biodegradable Tableware Market, by Country, 2023–2030 (USD Million)
Table 41 Asia-Pacific: Biodegradable Tableware Market, by Product Type, 2023–2030 (USD Million)
Table 42 Asia-Pacific: Biodegradable Tableware Market, by Material Type, 2023–2030 (USD Million)
Table 43 Asia-Pacific: Biodegradable Tableware Market, by Distribution Channel, 2023–2030 (USD Million)
Table 44 China: Biodegradable Tableware Market, by Product Type, 2023–2030 (USD Million)
Table 45 China: Biodegradable Tableware Market, by Material Type, 2023–2030 (USD Million)
Table 46 China: Biodegradable Tableware Market, by Distribution Channel, 2023–2030 (USD Million)
Table 47 India: Biodegradable Tableware Market, by Product Type, 2023–2030 (USD Million)
Table 48 India: Biodegradable Tableware Market, by Material Type, 2023–2030 (USD Million)
Table 49 India: Biodegradable Tableware Market, by Distribution Channel, 2023–2030 (USD Million)
Table 50 Japan: Biodegradable Tableware Market, by Product Type, 2023–2030 (USD Million)
Table 51 Japan: Biodegradable Tableware Market, by Material Type, 2023–2030 (USD Million)
Table 52 Japan: Biodegradable Tableware Market, by Distribution Channel, 2023–2030 (USD Million)
Table 53 Rest of Asia-Pacific: Biodegradable Tableware Market, by Product Type, 2023–2030 (USD Million)
Table 54 Rest of Asia-Pacific: Biodegradable Tableware Market, by Material Type, 2023–2030 (USD Million)
Table 55 Rest of Asia-Pacific: Biodegradable Tableware Market, by Distribution Channel, 2023–2030 (USD Million)
Table 56 Rest of the World (RoW): Biodegradable Tableware Market, by Country, 2023–2030 (USD Million)
Table 57 Rest of the World (RoW): Biodegradable Tableware Market, by Product Type, 2023–2030 (USD Million)
Table 58 Rest of the World (RoW): Biodegradable Tableware Market, by Material Type, 2023–2030 (USD Million)
Table 59 Rest of the World (RoW): Biodegradable Tableware Market, by Distribution Channel, 2023–2030 (USD Million)
Table 60 South America: Biodegradable Tableware Market, by Product Type, 2023–2030 (USD Million)
Table 61 South America: Biodegradable Tableware Market, by Material Type, 2023–2030 (USD Million)
Table 62 South America: Biodegradable Tableware Market, by Distribution Channel, 2023–2030 (USD Million)
Table 63 Middle East: Biodegradable Tableware Market, by Product Type, 2023–2030 (USD Million)
Table 64 Middle East: Biodegradable Tableware Market, by Material Type, 2023–2030 (USD Million)
Table 65 Middle East: Biodegradable Tableware Market, by Distribution Channel, 2023–2030 (USD Million)
Table 66 Africa: Biodegradable Tableware Market, by Product Type, 2023–2030 (USD Million)
Table 67 Africa: Biodegradable Tableware Market, by Material Type, 2023–2030 (USD Million)
Table 68 Africa: Biodegradable Tableware Market, by Distribution Channel, 2023–2030 (USD Million)
LIST OF FIGURES
FIGURE 1 Global 
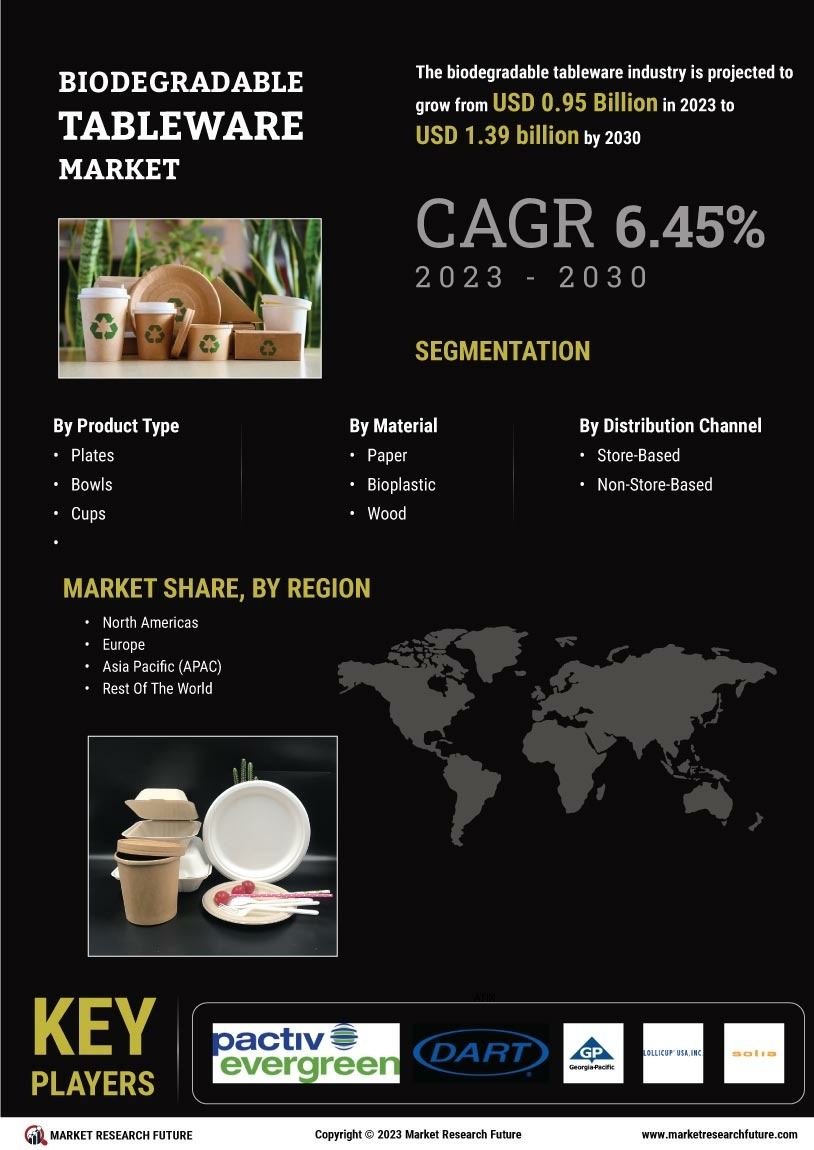
Biodegradable Tableware Market Segmentation
FIGURE 2 Forecast Research Methodology
FIGURE 3 Five Forces Analysis of the Global Biodegradable Tableware Market
FIGURE 4 Value Chain of the Global Biodegradable Tableware Market
FIGURE 5 Share of the Global Biodegradable Tableware Market in 2022, by Region (%)
FIGURE 6 Global Biodegradable Tableware Market, by Region, 2023–2030
FIGURE 7 Global Biodegradable Tableware Market, by Product Type, 2023–2030
FIGURE 8 Share of the Biodegradable Tableware Market, by Product Type, 2023–2030 (%)
FIGURE 9 Global Biodegradable Tableware Market Type, by Material Type, 2023–2030
FIGURE 10 Share of the Biodegradable Tableware Market, by Material Type, 2023–2030 (%)
FIGURE 10 Global Biodegradable Tableware Market, by Distribution Channel, 2023–2030
FIGURE 11 Share of the Biodegradable Tableware Market, by Distribution Channel, 2023–2030 (%)