ID: MRFR/E&P/0983-HCR | February 2021 | Region: Global | 111 pages
Market Scenario
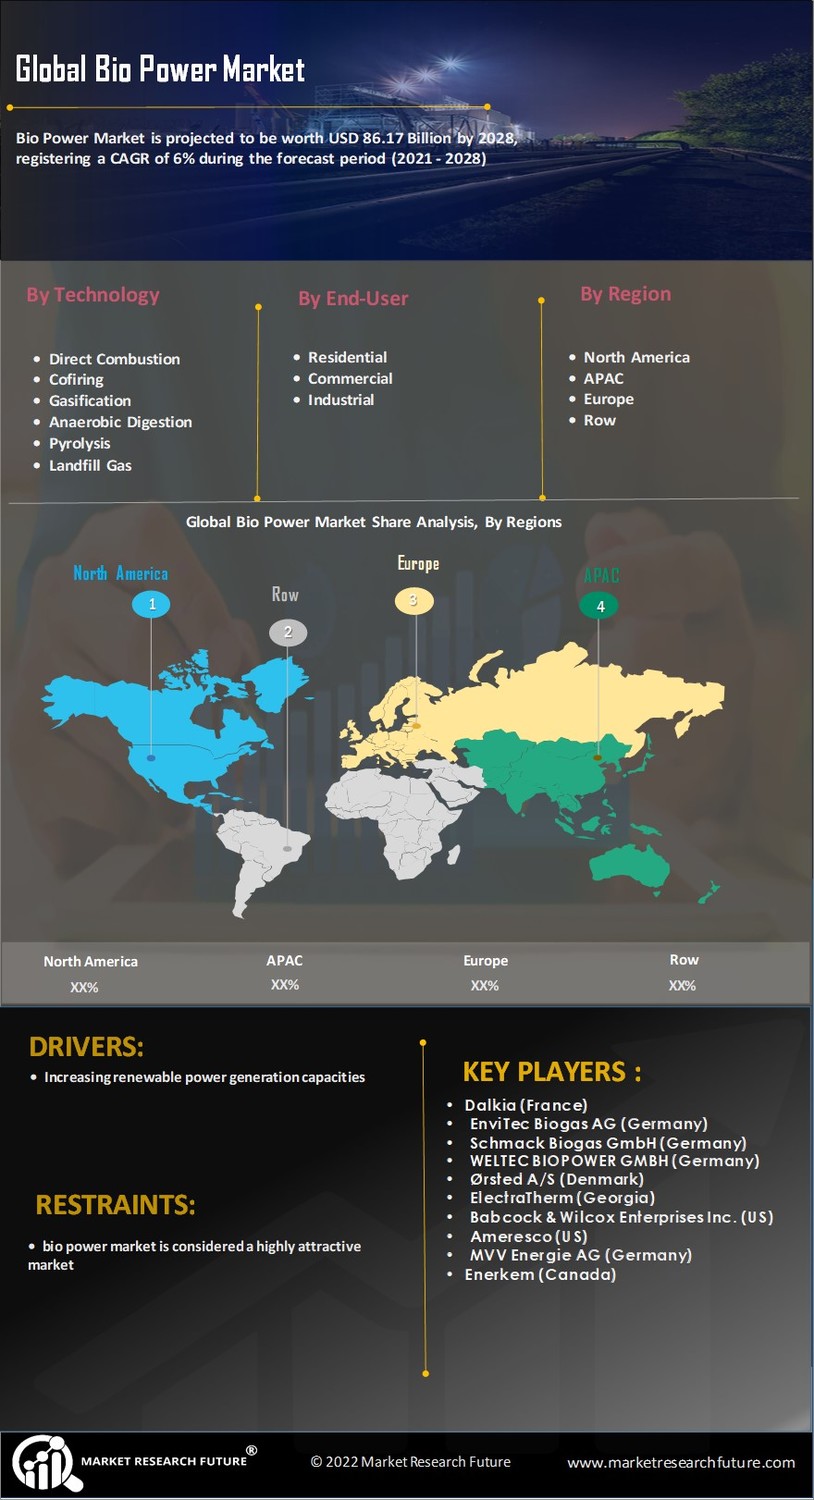
Biomass is a fuel that is developed from organic materials, a renewable and sustainable source of energy which is used to create electricity or other forms of power. Biomass power is carbon neutral electricity generated from renewable organic waste. The three methods to release the energy stored in biomass to produce biopower are burning, bacterial decay, and conversion to gas/liquid fuel. The global biomass power market is driven by reduction of carbon emissions and rising demand for renewable energy worldwide. Renewable energy industry is currently witnessing a significant surge in their demand which is primarily due to the increasing demand for clean and efficient energy. Favorable government regulations regarding renewable sources of energy and development in technology has made these renewable sources cost effective, thereby driving the demand of biomass power market. For instance, A 10.3 MW capacity of bio power project has been developed at Tyseley, Birmingham in UK, which is one of the major commercial scale power projects using advanced biomass gasification technology. A biomass gasification based power generation technology also holds significant potential especially in developing economies where the enormous amount of biomass wastes for landfill can be used for clean power generation abundantly.
Global biomass power market is an emerging market and is expected to witness high growth over the forecast period owing to technological advancements and increasing focus on research and development to provide biomass for power generation in the form of clean energy. Increasing use of biomass such as plant and manure materials to produce electricity and generate biomass fuels for transportation is expected to contribute to the industry growth over the forecast period. Governments across the globe are taking steps towards increasing renewable power generation capacities, thereby driving the need for clean energy power projects. This is expected to create growth opportunities for the global bio power market. However, the factors such as higher cost at initial stage can restraint the gowth of bio power market.
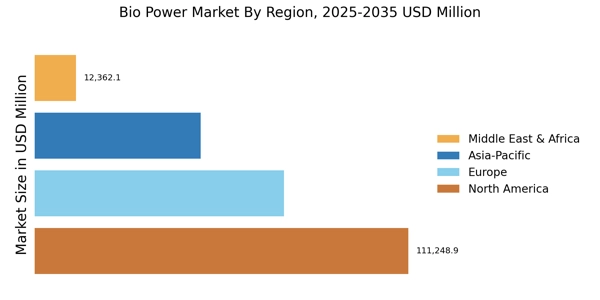
North America is the largest market for bio power. Countries such as US and Canada are driving the bio power market owing to increasing investments in renewable sector, efforts for installation of renewable energy resources, and the availability of advanced technology. Europe is likely to evolve as one of the most lucrative markets during the forecast period driven by regulatory support for power generation through renewable energy resources. For instance, according to bloomberg new energy finance report 2017, Europe invested USD 57.4 billion in clean energy technologies which is likely to present business opportunities for bio power projects.
The Global Bio Power Market has been segmented based on technology, end-user, and region. On the basis of technology, the market is segmented into direct combustion, cofiring, gasification, anaerobic digestion, pyrolysis, and landfill gas. Direct combustion segment dominated the market in 2017. On the basis of end-user, the market is segmented as residential, commercial, industrial, and others. Industrial segment had a larger market share in the year 2017 and is expected to dominate the global bio power market during the forecast period due to rising use of renewable power sources for power generation, paper & pulp, and textile industries.
To maintain the market position and to drive the market growth, various dynamic and diversified international organizations, domestic organizations and as well as new entrants are contributing heavily to maintain the competitiveness. Market leaders are innovating continuously and increasingly seeking market expansion through various strategic mergers and acquisitions, new product launches, and innovation in technology. These factors are expected to offer market growth opportunities for the global bio power market.
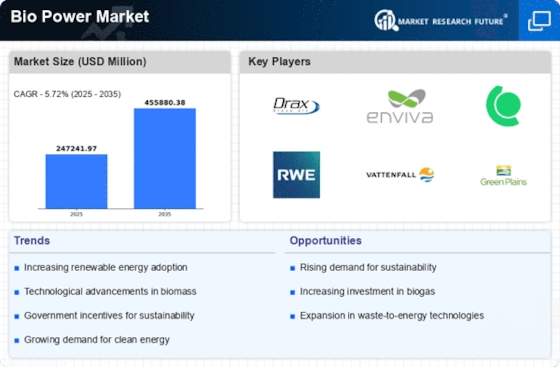
The Global Bio Power Market is expected to expand at ~5.7% CAGR during the forecast period.
Market Segmentation
Intended Audience:
The intended audience for the bio power market is bio power generators, power utilities, residential customers, industrial customers, bio power suppliers, research and development (R&D) companies, renewable energy research scholars, government and associations, educational institutes and universities, and market research and consulting firms.
Key Players
The key players of the Global Bio Power Market are Dalkia (France), EnviTec Biogas AG (Germany), Schmack Biogas GmbH (Germany), WELTEC BIOPOWER GMBH (Germany), Ørsted A/S (Denmark), ElectraTherm (Georgia), Babcock & Wilcox Enterprises, Inc. (US), Ameresco (US), MVV Energie AG (Germany), and Enerkem (Canada).
Frequently Asked Questions (FAQ) :
Global biomass power market is to witness high growth due to technological advancements and swelling focus on research and development to afford biomass for power generation in the form of clean energy.
North America is the largest market for bio power.
Europe invested USD 57.4 billion in clean energy technologies.
The market will be evolving at 5.7% CAGR.
EnviTec Biogas AG (Germany), Dalkia (France), WELTEC BIOPOWER GMBH (Germany), Schmack Biogas GmbH (Germany), Ørsted A/S (Denmark) are the main competitors of the market.
Table of Contents
1 Executive Summary
2 Market Introduction
2.1 Market Definition
2.2 Scope of the Study
2.3 Market Structure
3 Research Methodology
3.1 Primary Research
3.2 Secondary Research
3.3 Market size Estimation
3.4 Forecast Model
3.5 List of Assumptions
3.6 Limitations of the study
4 Market Insights
5 Market Dynamics
5.1 Introduction
5.2 Market Drivers
5.3 Market Restraints
5.4 Market Opportunities
5.5 Value Chain/Supply Chain Analysis
5.6 Porter’s Five Forces Analysis
5.6.1 Threat of New Entrants
5.6.2 Bargaining Power of Buyers
5.6.3 Bargaining Power of Suppliers
5.6.4 Threat of Substitutes
5.6.5 Intensity of Rivalry
6 Global Bio Power Market, By Technology
6.1 Introduction
6.2 Direct Combustion
6.2.1 Market Estimates & Forecast, 2020-2027
6.2.2 Market Estimates & Forecast by Region, 2020-2027
6.3 Cofiring
6.3.1 Market Estimates & Forecast, 2020-2027
6.3.2 Market Estimates & Forecast by Region, 2020-2027
6.4 Gasification
6.4.1 Market Estimates & Forecast, 2020-2027
6.4.2 Market Estimates & Forecast by Region, 2020-2027
6.5 Anaerobic digestion
6.5.1 Market Estimates & Forecast, 2020-2027
6.5.2 Market Estimates & Forecast by Region, 2020-2027
6.6 Pyrolysis
6.6.1 Market Estimates & Forecast, 2020-2027
6.6.2 Market Estimates & Forecast by Region, 2020-2027
6.7 Landfill gas
6.7.1 Market Estimates & Forecast, 2020-2027
6.7.2 Market Estimates & Forecast by Region, 2020-2027
7 Global Bio Power Market, By End-User
7.1 Introduction
7.2 Residential
7.2.1 Market Estimates & Forecast, 2020-2027
7.2.2 Market Estimates & Forecast by Region, 2020-2027
7.3 Commercial
7.3.1 Market Estimates & Forecast, 2020-2027
7.3.2 Market Estimates & Forecast by Region, 2020-2027
7.4 Industrial
7.4.1 Market Estimates & Forecast, 2020-2027
7.4.2 Market Estimates & Forecast by Region, 2020-2027
7.5 Others
7.5.1 Market Estimates & Forecast, 2020-2027
7.5.2 Market Estimates & Forecast by Region, 2020-2027
8 Global Bio Power Market, By Region
8.1 Introduction
8.2 North America
8.2.1 Market Estimates & Forecast, By Country, 2020-2027
8.2.2 Market Estimates & Forecast, By Technology, 2020-2027
8.2.3 Market Estimates & Forecast, By End-User, 2020-2027
8.2.4 US
8.2.4.1 Market Estimates & Forecast, By Technology, 2020-2027
8.2.4.2 Market Estimates & Forecast, By End-User, 2020-2027
8.2.5 Canada
8.2.5.1 Market Estimates & Forecast, By Technology, 2020-2027
8.2.5.2 Market Estimates & Forecast, By End-User, 2020-2027
8.2.6 Mexico
8.2.6.1 Market Estimates & Forecast, By Technology, 2020-2027
8.2.6.2 Market Estimates & Forecast, By End-User, 2020-2027
8.3 Europe
8.3.1 Market Estimates & Forecast, By Country, 2020-2027
8.3.2 Market Estimates & Forecast, By Technology, 2020-2027
8.3.3 Market Estimates & Forecast, By End-User, 2020-2027
8.3.4 UK
8.3.4.1 Market Estimates & Forecast, By Technology, 2020-2027
8.3.4.2 Market Estimates & Forecast, By End-User, 2020-2027
8.3.5 Germany
8.3.5.1 Market Estimates & Forecast, By Technology, 2020-2027
8.3.5.2 Market Estimates & Forecast, By End-User, 2020-2027
8.3.6 France
8.3.6.1 Market Estimates & Forecast, By Technology, 2020-2027
8.3.6.2 Market Estimates & Forecast, By End-User, 2020-2027
8.3.7 Italy
8.3.7.1 Market Estimates & Forecast, By Technology, 2020-2027
8.3.7.2 Market Estimates & Forecast, By End-User, 2020-2027
8.3.8 Rest of Europe
8.3.8.1 Market Estimates & Forecast, By Technology, 2020-2027
8.3.8.2 Market Estimates & Forecast, By End-User, 2020-2027
8.4 Asia-Pacific
8.4.1 Market Estimates & Forecast, By Country, 2020-2027
8.4.2 Market Estimates & Forecast, By Technology, 2020-2027
8.4.3 Market Estimates & Forecast, By End-User, 2020-2027
8.4.4 China
8.4.4.1 Market Estimates & Forecast, By Technology, 2020-2027
8.4.4.2 Market Estimates & Forecast, By End-User, 2020-2027
8.4.5 Japan
8.4.5.1 Market Estimates & Forecast, By Technology, 2020-2027
8.4.5.2 Market Estimates & Forecast, By End-User, 2020-2027
8.4.6 India
8.4.6.1 Market Estimates & Forecast, By Technology, 2020-2027
8.4.6.2 Market Estimates & Forecast, By End-User, 2020-2027
8.4.7 Rest of Asia-Pacific
8.4.7.1 Market Estimates & Forecast, By Technology, 2020-2027
8.4.7.2 Market Estimates & Forecast, By End-User, 2020-2027
8.5 Middle East & Africa
8.5.1 Market Estimates & Forecast, By Country, 2020-2027
8.5.2 Market Estimates & Forecast, By Technology, 2020-2027
8.5.3 Market Estimates & Forecast, By End-User, 2020-2027
8.5.4 UAE
8.5.4.1 Market Estimates & Forecast, By Technology, 2020-2027
8.5.4.2 Market Estimates & Forecast, By End-User, 2020-2027
8.5.5 Saudi Arabia
8.5.5.1 Market Estimates & Forecast, By Technology, 2020-2027
8.5.5.2 Market Estimates & Forecast, By End-User, 2020-2027
8.5.6 South Africa
8.5.6.1 Market Estimates & Forecast, By Technology, 2020-2027
8.5.6.2 Market Estimates & Forecast, By End-User, 2020-2027
8.5.7 Rest of Middle East & Africa
8.5.7.1 Market Estimates & Forecast, By Technology, 2020-2027
8.5.7.2 Market Estimates & Forecast, By End-User, 2020-2027
8.6 South America
8.6.1 Market Estimates & Forecast, By Country, 2020-2027
8.6.2 Market Estimates & Forecast, By Technology, 2020-2027
8.6.3 Market Estimates & Forecast, By End-User, 2020-2027
8.6.4 Brazil
8.6.4.1 Market Estimates & Forecast, By Technology, 2020-2027
8.6.4.2 Market Estimates & Forecast, By End-User, 2020-2027
8.6.5 Argentina
8.6.5.1 Market Estimates & Forecast, By Technology, 2020-2027
8.6.5.2 Market Estimates & Forecast, By End-User, 2020-2027
8.6.6 Rest of South America
8.6.6.1 Market Estimates & Forecast, By Technology, 2020-2027
8.6.6.2 Market Estimates & Forecast, By End-User, 2020-2027
9 Competitive Landscape
9.1 Competitive Scenario
9.2 Competitive Benchmarking of the Global Bio Power Market
9.3 Major Growth Strategy in the Global Bio Power Market
9.4 Market Share Analysis: Global Bio Power Market
9.5 Schlumberger: The Leading Player in terms of Number of Developments in Global Bio Power Market
9.6 New Product Development
9.7 Mergers & Acquisitions
9.8 Contracts & Agreements
9.9 Expansions & Investments
10 Company Profile
10.1 Dalkia (France)
10.1.1 Company Overview
10.1.2 Product/Services Offered
10.1.3 Key Developments
10.1.4 SWOT Analysis
10.1.5 Strategy
10.2 EnviTec Biogas AG (Germany)
10.2.1 Company Overview
10.2.2 Product/Services Offered
10.2.3 Key Developments
10.2.4 SWOT Analysis
10.2.5 Strategy
10.3 Schmack Biogas GmbH (Germany)
10.3.1 Company Overview
10.3.2 Product/Services Offered
10.3.3 Key Developments
10.3.4 SWOT Analysis
10.3.5 Strategy
10.4 WELTEC BIOPOWER GMBH (Germany)
10.4.1 Company Overview
10.4.2 Product/Services Offered
10.4.3 Key Developments
10.4.4 SWOT Analysis
10.4.5 Strategy
10.5 Ørsted A/S (Denmark)
10.5.1 Company Overview
10.5.2 Product/Services Offered
10.5.3 Key Developments
10.5.4 SWOT Analysis
10.5.5 Strategy
10.6 ElectraTherm (Georgia)
10.6.1 Company Overview
10.6.2 Product/Services Offered
10.6.3 Key Developments
10.6.4 SWOT Analysis
10.6.5 Strategy
10.7 Babcock & Wilcox Enterprises, Inc. (US)
10.7.1 Company Overview
10.7.2 Product/Services Offered
10.7.3 Key Developments
10.7.4 SWOT Analysis
10.7.5 Strategy
10.8 Ameresco (US)
10.8.1 Company Overview
10.8.2 Product/Services Offered
10.8.3 Key Developments
10.8.4 SWOT Analysis
10.8.5 Strategy
10.9 MVV Energie AG (Germany)
10.9.1 Company Overview
10.9.2 Product/Services Offered
10.9.3 Key Developments
10.9.4 SWOT Analysis
10.9.5 Strategy
10.10 Enerkem (Canada)
10.10.1 Company Overview
10.10.2 Product/Services Offered
10.10.3 Key Developments
10.10.4 SWOT Analysis
10.10.5 Strategy
Note: The companies listed above are based on initial secondary research, the detailed list of players will be covered in the final study and according to the client requirement.
List of Tables
Table 1 Global Bio Power Market: By Region, 2020-2027
Table 2 North America Bio Power Market: By Country, 2020-2027
Table 3 Europe Bio Power Market: By Country, 2020-2027
Table 4 Asia-Pacific Bio Power Market: By Country, 2020-2027
Table 5 Middle East & Africa Bio Power Market: By Country, 2020-2027
Table 6 South America Bio Power Market: By Country, 2020-2027
Table 7 Global Bio Power Market By Technology: By Regions, 2020-2027
Table 8 North America Bio Power Market By Technology: By Country, 2020-2027
Table 9 Europe Bio Power Market By Technology: By Country, 2020-2027
Table 10 Asia-Pacific Bio Power Market By Technology: By Country, 2020-2027
Table 11 Middle East & Africa Bio Power Market By Technology: By Country, 2020-2027
Table 12 South America Bio Power Market By Technology: By Country, 2020-2027
Table 13 Global Bio Power Market, By End-User, By Regions, 2020-2027
Table 14 North America Bio Power Market, By End-User, By Country, 2020-2027
Table 15 Europe Bio Power Market, By End-User, By Country, 2020-2027
Table 16 Asia-Pacific Bio Power Market, By End-User, By Country, 2020-2027
Table 17 Middle East & Africa Bio Power Market, By End-User, By Country, 2020-2027
Table 18 South America Bio Power Market, By End-User, By Country, 2020-2027
Table 19 Global Bio Power Market: By Region, 2020-2027
Table 20 North America: Bio Power Market, By Country
Table 21 North America: Bio Power Market, By Technology
Table 22 North America: Bio Power Market, By End-User
Table 23 Europe: Bio Power Market, By Country
Table 24 Europe: Bio Power Market, By Technology
Table 25 Europe: Bio Power Market, By End-User
Table 26 Asia-Pacific: Bio Power Market, By Country
Table 27 Asia-Pacific: Bio Power Market, By Technology
Table 28 Asia-Pacific: Bio Power Market, By End-User
Table 29 Middle East & Africa: Bio Power Market, By Region
Table 30 Middle East & Africa: Bio Power Market, By Technology
Table 31 Middle East & Africa: Bio Power Market, By End-User
Table 32 South America: Bio Power Market, By Region
Table 33 South America: Bio Power Market, By Technology
Table 34 South America: Bio Power Market, By End-User
List of Figures
Figure 1 Research Process of MRFR
Figure 2 Top Down & Bottom Up Approach
Figure 3 Market Dynamics
Figure 4 Impact Analysis: Market Drivers
Figure 5 Impact Analysis: Market Restraints
Figure 6 Porter’s Five Forces Analysis
Figure 7 Value Chain Analysis
Figure 8 Global Bio Power Market Share, By Technology, 2020 (%)
Figure 9 Global Bio Power Market, By Technology, 2020-2027 (USD Million)
Figure 10 Global Bio Power Market Share, By End-User, 2020 (%)
Figure 11 Global Bio Power Market, By End-User, 2020-2027 (USD Million)
Figure 12 Global Bio Power Market Share (%), BY REGION, 2020
Figure 13 Global Bio Power Market, BY REGION, 2020-2027 (USD Million)
Figure 14 North America Bio Power Market Share (%), 2020
Figure 15 North America Bio Power Market by Country, 2020-2027 (USD Million)
Figure 16 Europe Bio Power Market Share (%), 2020
Figure 17 Europe Bio Power Market by Country, 2020-2027 (USD Million)
Figure 18 Asia-Pacific Bio Power Market Share (%), 2020
Figure 19 Asia-Pacific Bio Power Market by Country, 2020-2027 (USD Million)
Figure 20 Middle East & Africa Bio Power Market Share (%), 2020
Figure 21 Middle East & Africa Bio Power Market by Country, 2020-2027 (USD Million)
Figure 22 South America Bio Power Market Share (%), 2020
Figure 23 South America Bio Power Market by Country, 2020-2027 (USD Million)