Bio Fuels Market Segmentation
Bio Fuels Market By Application (USD Billion, 2025-2035)
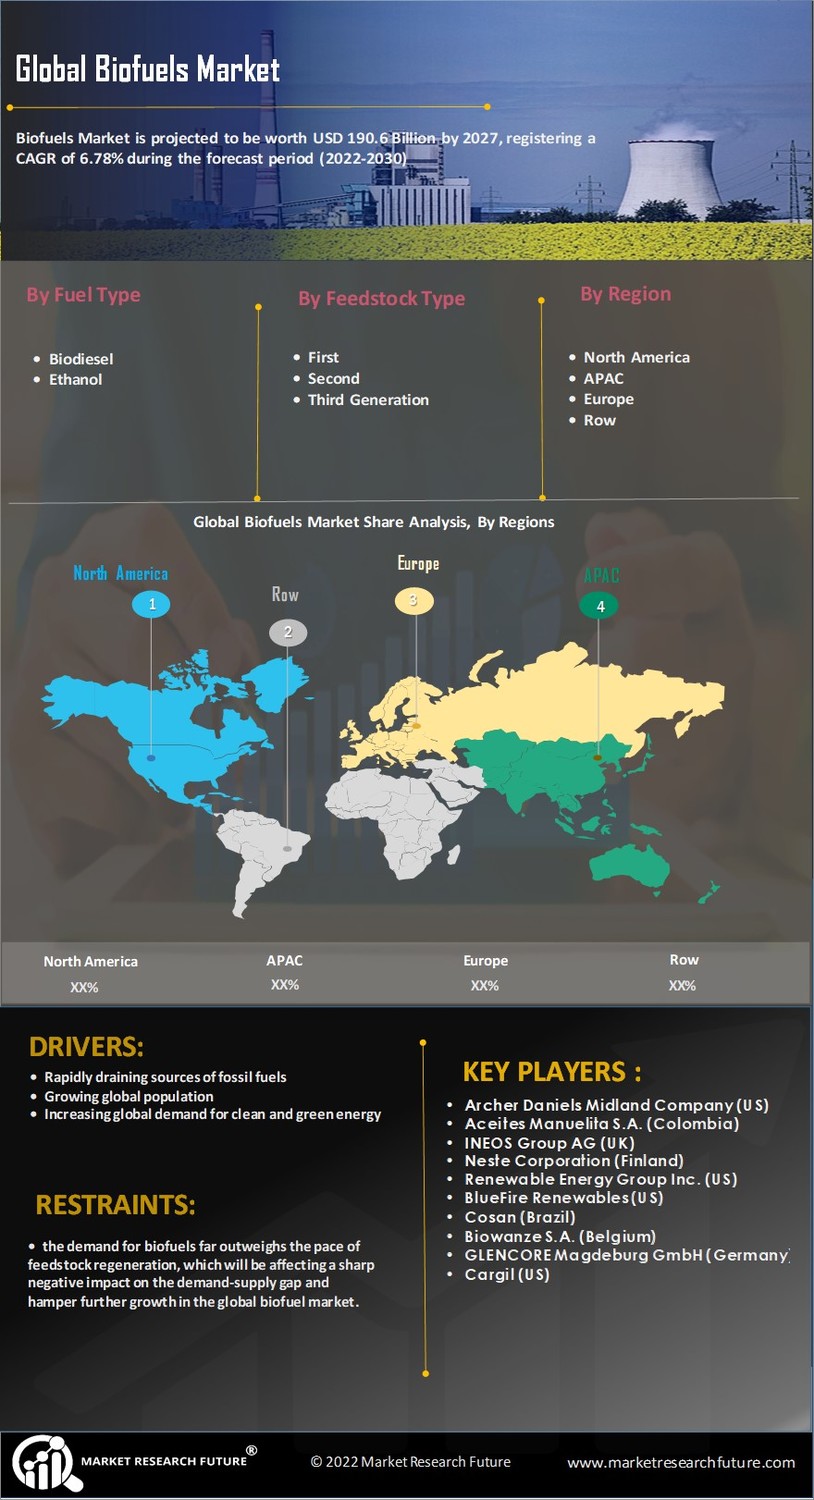
- Transportation
- Power Generation
- Industrial
- Residential
Bio Fuels Market By Feedstock Type (USD Billion, 2025-2035)
- Vegetable Oils
- Animal Fats
- Waste Oils
- Starch
Bio Fuels Market By Production Technology (USD Billion, 2025-2035)
- Fermentation
- Transesterification
- Gasification
- Hydrothermal Liquefaction
Bio Fuels Market By End Use (USD Billion, 2025-2035)
- Automotive
- Aviation
- Marine
- Heating
Bio Fuels Market By Blend Type (USD Billion, 2025-2035)
- Biodiesel
- Bioethanol
- Biobutanol
- Biogas