ID: MRFR/HC/6366-HCR | February 2021 | Region: Global | 160 pages
Market Scenario
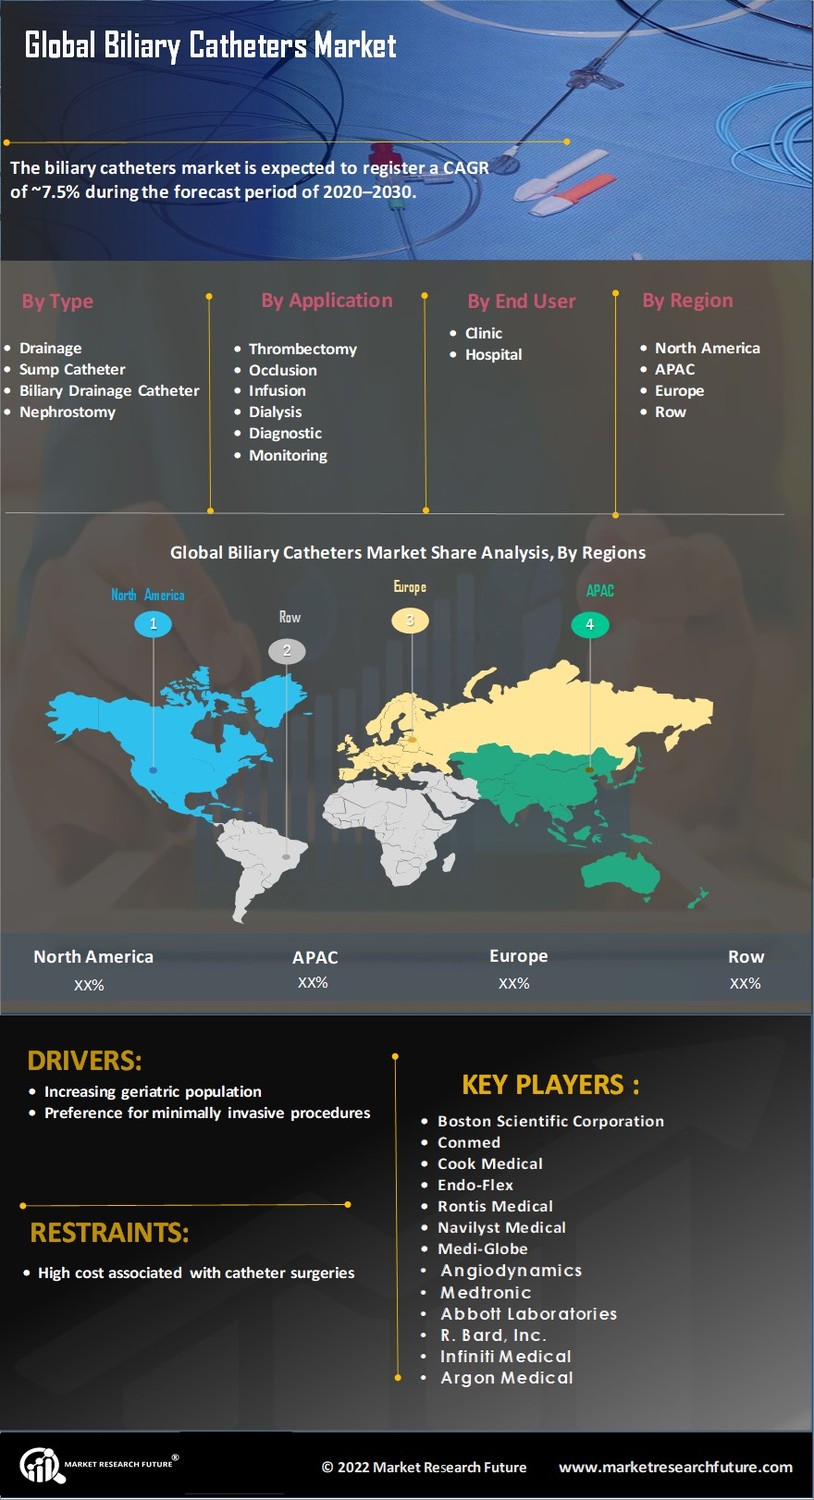
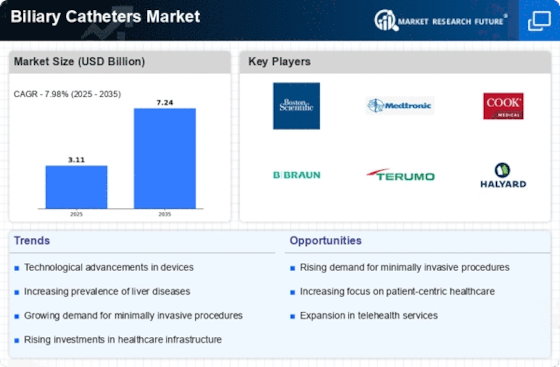
The Global Biliary Catheters Market is projected to grow significantly over the forecast period. It is estimated that the global biliary catheters market is expected to register a CAGR of ~7% during the forecast period of 2019–2024.
A biliary drain is a tube to drain bile from your liver. This skilled procedure is performed by an interventional radiologist. The tube or catheter is placed through the skin and into the liver. The device used for drainage is also called a biliary stent or biliary catheter. Treatment of diseases such as liver cirrhosis and cholangitis level are majorly performed by biliary catheter and are expected to drive the growth of the market. Factors such as high cost associated with catheter surgeries are limiting the growth of the market. For instance, according to the report published by the Centers for Disease Control and Prevention (CDC) 2014, it was observed that nearly 5% of cases of the urinary tract infection were associated with catheters. Moreover, major companies in the market are involved in new product launches to strengthen their position in the market.
Segmentation
The global biliary catheters market is segmented on the basis of type, application, and end user.
The biliary catheters market by type is categorized into multi-purpose drainage, multi-purpose drainage sump catheter, biliary drainage catheter, nephrostomy catheter, ureteral stent, and others.
Based on Application, the global biliary catheters market is segmented into thrombectomy, drainage, occlusion, infusion, aspirating, dialysis, diagnostic, monitoring, stent delivery, and dilatation.
On the basis of end user, the market is segmented into clinics, hospital, and others.
On the basis of region, the global biliary catheters market is segmented into the Americas, Europe, Asia-Pacific, and the Middle East and Africa. The Americas is sub-segmented into North America and Latin America. The North American region is further segmented into the US and Canada. The European region is divided into two, namely, Western Europe and Eastern Europe. Western Europe is further classified into Germany, Italy, France, the UK, Spain, and the rest of Western Europe. The Asia-Pacific region is sub-segmented into Japan, China, India, Australia, South Korea, and the rest of Asia-Pacific. The biliary catheters market in the Middle East and Africa has been segmented into the Middle East and Africa.
Key players
Some of the key players in the global biliary catheters market are Boston Scientific Corporation, Conmed, Cook Medical, Endo-Flex, Rontis Medical, Navilyst Medical, Medi-Globe, Angiodynamics, Medtronic, Abbott Laboratories, C.R. Bard, Inc., Infiniti Medical, Argon Medical, Johnson & Johnson, Merit Medical Endotek, Olympus Corporation, Angio Dynamics, Merit Medical, and others.
Regional Market Summary
Global Biliary Catheters Market Share (%), by Region, 2018
Sources: Centers for Disease Control and Prevention (CDC), US Department of Health and Human Services, National Institutes of Health
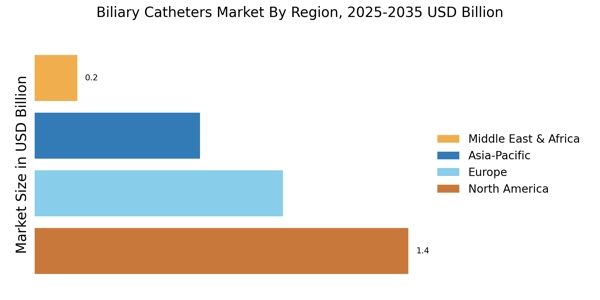
It is projected that the Americas dominated the global biliary catheters market owing to the growth of the market in the North American region. This is largely attributed to factors such as well-established healthcare infrastructure and the increase in adoption of surgical catheter systems across various healthcare settings will support market growth in this region. Europe is expected to hold the second largest share in the biliary catheters market owing to the introduction of advanced robot-assisted laparoscopic procedures and quality of treatment of existing and new medical indications.
Asia-Pacific was projected to be the fastest growing region for the global biliary catheters market. With the growth of the overall minimal invasive surgeries (MIS) in the region headed by technology giants like Japan and China, the availability of catheters has also increased. The Middle East and Africa holds the least share in the global biliary catheters market due to the presence of economically diverse countries, and fewer initiatives taken by the government.
Global Biliary Catheters Market, by Type
Global Biliary Catheters Market, by Application
Global Biliary Catheters Market, by End User
Global Biliary Catheters Market, by Region
Global Biliary Catheters Market, Key Players
Intended Audience
Frequently Asked Questions (FAQ) :
Biliary catheters market is projected to grow at a 7% CAGR between 2019-2024.
The Americas is expected to dominate the biliary catheters market.
Preference for minimally invasive procedure is the key factor driving the biliary catheters market.
High initial costs may limit the biliary catheters market growth.
End users of biliary catheters market include hospitals, clinics, and others.
Table of Contents:
Chapter 1. Report Prologue
Chapter 2. Market Introduction
2.1 Definition
2.2 Scope of the Study
2.2.1 Research Objective
2.2.2 Assumptions
2.2.3 Limitations
Chapter 3. Research Methodology
3.1 Overview
3.2 Primary Research
3.3 Secondary Research
3.4 Market Size Estimation
Chapter 4. Market Dynamics
4.1 Drivers
4.2 Restraints
4.3 Opportunities
Chapter 5. Market Factor Analysis
5.1 Porter’s Five Forces Analysis
5.1.1 Bargaining Power of Suppliers
5.1.2 Bargaining Power of Buyers
5.1.3 Threat of New Entrants
5.1.4 Threat of Substitutes
5.1.5 Intensity of Rivalry
5.2 Value Chain Analysis
Chapter 6. Global Biliary Catheters Market, by Type
6.1 Overview
6.2 Multi-Purpose Drainage
6.3 Multi-Purpose Drainage Sump Catheter
6.4 Biliary Drainage Catheter
6.5 Nephrostomy Catheter
6.6 Ureteral Stent
6.7 Others
Chapter 7. Global Biliary Catheters Market, by Application
7.1 Overview
7.2 Thrombectomy
7.3 Drainage
7.4 Occlusion
7.5 Infusion
7.6 Aspirating
7.7 Dialysis
7.8 Diagnostic
7.9 Monitoring
7.10 Stent Delivery
7.11 Dilatation
Chapter 8. Global Biliary Catheters Market, by End User
8.1 Overview
8.2 Clinic
8.3 Hospital
8.4 Others
Chapter 9. Global Biliary Catheters Market, by Region
9.1 Introduction
9.2 Americas
9.2.1 North America
9.2.1.1 US
9.2.1.2 Canada
9.2.2 Latin America
9.3 Europe
9.3.1 Western Europe
9.3.1.1 Germany
9.3.1.2 France
9.3.1.3 Italy
9.3.1.4 Spain
9.3.1.5 UK
9.3.1.6 Rest of Western Europe
9.3.2 Eastern Europe
9.4 Asia-Pacific
9.4.1 Japan
9.4.2 China
9.4.3 India
9.4.4 Australia
9.4.5 South Korea
9.4.6 Rest of Asia-Pacific
9.5 Middle East & Africa
9.5.1 Middle East
9.5.2 Africa
Chapter 10. Company Landscape
10.1 Introduction
10.2 Market Share Analysis
Chapter 11. Company Profiles
11.1 Boston Scientific Corporation
11.1.1 Company Overview
11.1.2 Product Overview
11.1.3 Financials Overview
11.1.4 Key Developments
11.1.5 SWOT Analysis
11.2 Conmed
11.3 Cook Medical
11.4 Endo-Flex
11.5 Rontis Medical
11.6 Navilyst Medical
11.7 Medi-Globe
11.8 Angiodynamics
11.9 Medtronic
11.10 Abbott Laboratories
11.11 C.R. Bard, Inc.
11.12 Infiniti Medical
11.13 Argon Medical
11.14 Johnson & Johnson
11.15 Merit Medical Endotek
11.16 Olympus Corporation
11.17 Angio Dynamics
11.18 Merit Medical
11.19 Others
Chapter 12 Appendix
LIST OF TABLES
TABLE 1 GLOBAL BILIARY CATHETERS MARKET SYNOPSIS, 2020–2027
TABLE 2 GLOBAL BILIARY CATHETERS MARKET ESTIMATES AND FORECAST, 2020–2027 (USD MILLION)
TABLE 3 GLOBAL BILIARY CATHETERS MARKET, BY TYPE, 2020–2027 (USD MILLION)
TABLE 4 GLOBAL BILIARY CATHETERS MARKET, BY APPLICATION, 2020–2027 (USD MILLION)
TABLE 5 GLOBAL BILIARY CATHETERS MARKET, BY END USER, 2020–2027 (USD MILLION)
TABLE 6 GLOBAL BILIARY CATHETERS MARKET, BY REGION, 2020–2027(USD MILLION)
TABLE 7 NORTH AMERICA: BILIARY CATHETERS MARKET, BY TYPE, 2020–2027 (USD MILLION)
TABLE 8 NORTH AMERICA: BILIARY CATHETERS MARKET, BY APPLICATION, 2020–2027 (USD MILLION)
TABLE 9 NORTH AMERICA: BILIARY CATHETERS MARKET, BY END USER, 2020–2027 (USD MILLION)
TABLE 10 NORTH AMERICA: BILIARY CATHETERS MARKET, BY REGION, 2020–2027 (USD MILLION)
TABLE 11 US: BILIARY CATHETERS MARKET, BY TYPE, 2020–2027 (USD MILLION)
TABLE 12 US: BILIARY CATHETERS MARKET, BY APPLICATION, 2020–2027 (USD MILLION)
TABLE 13 US: BILIARY CATHETERS MARKET, BY END USER, 2020–2027 (USD MILLION)
TABLE 14 US: BILIARY CATHETERS MARKET, BY REGION, 2020–2027 (USD MILLION)
TABLE 15 CANADA: BILIARY CATHETERS MARKET, BY TYPE, 2020–2027 (USD MILLION)
TABLE 16 CANADA: BILIARY CATHETERS MARKET, BY APPLICATION, 2020–2027 (USD MILLION)
TABLE 17 CANADA: BILIARY CATHETERS MARKET, BY END USER, 2020–2027 (USD MILLION)
TABLE 18 CANADA: BILIARY CATHETERS MARKET, BY REGION, 2020–2027 (USD MILLION)
TABLE 19 SOUTH AMERICA: BILIARY CATHETERS MARKET, BY TYPE, 2020–2027 (USD MILLION)
TABLE 20 SOUTH AMERICA: BILIARY CATHETERS MARKET, BY APPLICATION, 2020–2027 (USD MILLION)
TABLE 21 SOUTH AMERICA: BILIARY CATHETERS MARKET, BY END USER, 2020–2027 (USD MILLION)
TABLE 22 SOUTH AMERICA: BILIARY CATHETERS MARKET, BY REGION, 2020–2027 (USD MILLION)
TABLE 23 EUROPE: BILIARY CATHETERS MARKET, BY TYPE, 2020–2027 (USD MILLION)
TABLE 24 EUROPE: BILIARY CATHETERS MARKET, BY APPLICATION, 2020–2027 (USD MILLION)
TABLE 25 EUROPE: BILIARY CATHETERS MARKET, BY END USER, 2020–2027 (USD MILLION)
TABLE 26 EUROPE: BILIARY CATHETERS MARKET, BY REGION, 2020–2027 (USD MILLION)
TABLE 27 WESTERN EUROPE: BILIARY CATHETERS MARKET, BY TYPE, 2020–2027 (USD MILLION)
TABLE 28 WESTERN EUROPE: BILIARY CATHETERS MARKET, BY APPLICATION, 2020–2027 (USD MILLION)
TABLE 29 WESTERN EUROPE: BILIARY CATHETERS MARKET, BY END USER, 2020–2027 (USD MILLION)
TABLE 30 WESTERN EUROPE: BILIARY CATHETERS MARKET, BY REGION, 2020–2027 (USD MILLION)
TABLE 31 EASTERN EUROPE: BILIARY CATHETERS MARKET, BY TYPE, 2020–2027 (USD MILLION)
TABLE 32 EASTERN EUROPE: BILIARY CATHETERS MARKET, BY APPLICATION, 2020–2027 (USD MILLION)
TABLE 33 EASTERN EUROPE: BILIARY CATHETERS MARKET, BY END USER, 2020–2027 (USD MILLION)
TABLE 34 EASTERN EUROPE: BILIARY CATHETERS MARKET, BY REGION, 2020–2027 (USD MILLION)
TABLE 35 ASIA-PACIFIC: BILIARY CATHETERS MARKET, BY TYPE, 2020–2027 (USD MILLION)
TABLE 36 ASIA-PACIFIC: BILIARY CATHETERS MARKET, BY APPLICATION, 2020–2027 (USD MILLION)
TABLE 37 ASIA-PACIFIC: BILIARY CATHETERS MARKET, BY END USER, 2020–2027 (USD MILLION)
TABLE 38 ASIA-PACIFIC: BILIARY CATHETERS MARKET, BY REGION, 2020–2027 (USD MILLION)
TABLE 39 MIDDLE EAST & AFRICA: BILIARY CATHETERS MARKET, BY TYPE, 2020–2027 (USD MILLION)
TABLE 40 MIDDLE EAST & AFRICA: BILIARY CATHETERS MARKET, BY APPLICATION, 2020–2027 (USD MILLION)
TABLE 41 MIDDLE EAST & AFRICA: BILIARY CATHETERS MARKET, BY END USER, 2020–2027 (USD MILLION)
TABLE 42 MIDDLE EAST & AFRICA: BILIARY CATHETERS MARKET, BY REGION, 2020–2027 (USD MILLION)
LIST OF FIGURES
FIGURE 1 RESEARCH PROCESS
FIGURE 2 SEGMENTATION FOR GLOBAL BILIARY CATHETERS MARKET
FIGURE 3 MARKET DYNAMICS FOR GLOBAL BILIARY CATHETERS MARKET
FIGURE 4 GLOBAL BILIARY CATHETERS MARKET SHARE, BY PRODUCT, 2020 (%)
FIGURE 5 GLOBAL BILIARY CATHETERS MARKET, BY APPLICATION, 2020 (%)
FIGURE 6 GLOBAL BILIARY CATHETERS MARKET SHARE, BY END USER, 2020 (%)
FIGURE 7 GLOBAL BILIARY CATHETERS MARKET SHARE, BY REGION, 2020 (%)
FIGURE 8 NORTH AMERICA: BILIARY CATHETERS MARKET SHARE, BY COUNTRY, 2020 (%)
FIGURE 9 EUROPE: BILIARY CATHETERS MARKET SHARE, BY COUNTRY, 2020 (%)
FIGURE 10 ASIA-PACIFIC: BILIARY CATHETERS MARKET SHARE, BY COUNTRY, 2020 (%)
FIGURE 11 MIDDLE EAST & AFRICA: BILIARY CATHETERS MARKET SHARE, BY COUNTRY, 2020 (%)
FIGURE 12 GLOBAL BILIARY CATHETERS MARKET: COMPANY SHARE ANALYSIS, 2020 (%)
FIGURE 13 COOK MEDICAL: KEY FINANCIALS
FIGURE 14 COOK MEDICAL: SEGMENTAL REVENUE
FIGURE 15 COOK MEDICAL: GEOGRAPHICAL REVENUE
FIGURE 16 ENDO-FLEX: KEY FINANCIALS
FIGURE 17 ENDO-FLEX: SEGMENTAL REVENUE
FIGURE 18 ENDO-FLEX: GEOGRAPHICAL REVENUE
FIGURE 19 RONTIS MEDICAL: KEY FINANCIALS
FIGURE 20 RONTIS MEDICAL: SEGMENTAL REVENUE
FIGURE 21 RONTIS MEDICAL: GEOGRAPHICAL REVENUE
FIGURE 22 MEDTRONIC: KEY FINANCIALS
FIGURE 23 MEDTRONIC: SEGMENTAL REVENUE
FIGURE 24 MEDTRONIC: GEOGRAPHICAL REVENUE
FIGURE 25 JOHNSON & JOHNSON: KEY FINANCIALS
FIGURE 26 JOHNSON & JOHNSON: SEGMENTAL REVENUE
FIGURE 27 JOHNSON & JOHNSON: GEOGRAPHICAL REVENUE
FIGURE 28 ABBOTT LABORATORIES: KEY FINANCIALS
FIGURE 29 ABBOTT LABORATORIES: SEGMENTAL REVENUE
FIGURE 30 ABBOTT LABORATORIES: GEOGRAPHICAL REVENUE
FIGURE 31 SMITH & NEPHEW PLC. (BLUE BELT TECHNOLOGIES, INC.).: KEY FINANCIALS
FIGURE 32 SMITH & NEPHEW PLC. (BLUE BELT TECHNOLOGIES, INC.).: SEGMENTAL REVENUE
FIGURE 33 SMITH & NEPHEW PLC. (BLUE BELT TECHNOLOGIES, INC.).: GEOGRAPHICAL REVENUE
FIGURE 34 CONMED: KEY FINANCIALS
FIGURE 35 CONMED: SEGMENTAL REVENUE
FIGURE 36 CONMED: GEOGRAPHICAL REVENUE
FIGURE 37 BOSTON SCIENTIFIC CORPORATION: KEY FINANCIALS
FIGURE 38 BOSTON SCIENTIFIC CORPORATION: SEGMENTAL REVENUE
FIGURE 39 BOSTON SCIENTIFIC CORPORATION: GEOGRAPHICAL REVENUE
This table of content is tentative and subject to change as the research progresses.
Please Note: Financial details of company cannot be provided if the information of the company is not available in public domain and or reliable source.