Certified Global Research Member
Isomar fd.webp Wcrc 57.webp
Key Questions Answered
  • Global Market Outlook
  • In-depth analysis of global and regional trends
  • Analyze and identify the major players in the market, their market share, key developments, etc.
  • To understand the capability of the major players based on products offered, financials, and strategies.
  • Identify disrupting products, companies, and trends.
  • To identify opportunities in the market.
  • Analyze the key challenges in the market.
  • Analyze the regional penetration of players, products, and services in the market.
  • Comparison of major players’ financial performance.
  • Evaluate strategies adopted by major players.
  • Recommendations
Why Choose Market Research Future?
  • Vigorous research methodologies for specific market.
  • Knowledge partners across the globe
  • Large network of partner consultants.
  • Ever-increasing/ Escalating data base with quarterly monitoring of various markets
  • Trusted by fortune 500 companies/startups/ universities/organizations
  • Large database of 5000+ markets reports.
  • Effective and prompt pre- and post-sales support.

Bike Sharing Market Research Report Information By Bike Type (Traditional Bike and E-Bike), By Sharing System (Docked and Dock Less), By Sharing Duration (Short Term and Long Term), And By Region (North America, Europe, Asia-Pacific, And Rest Of The World) – Global Industry Size, Share, Growth, Trends and Forecast To 2032


ID: MRFR/AM/8874-HCR | 100 Pages | Author: Sejal Akre| April 2024

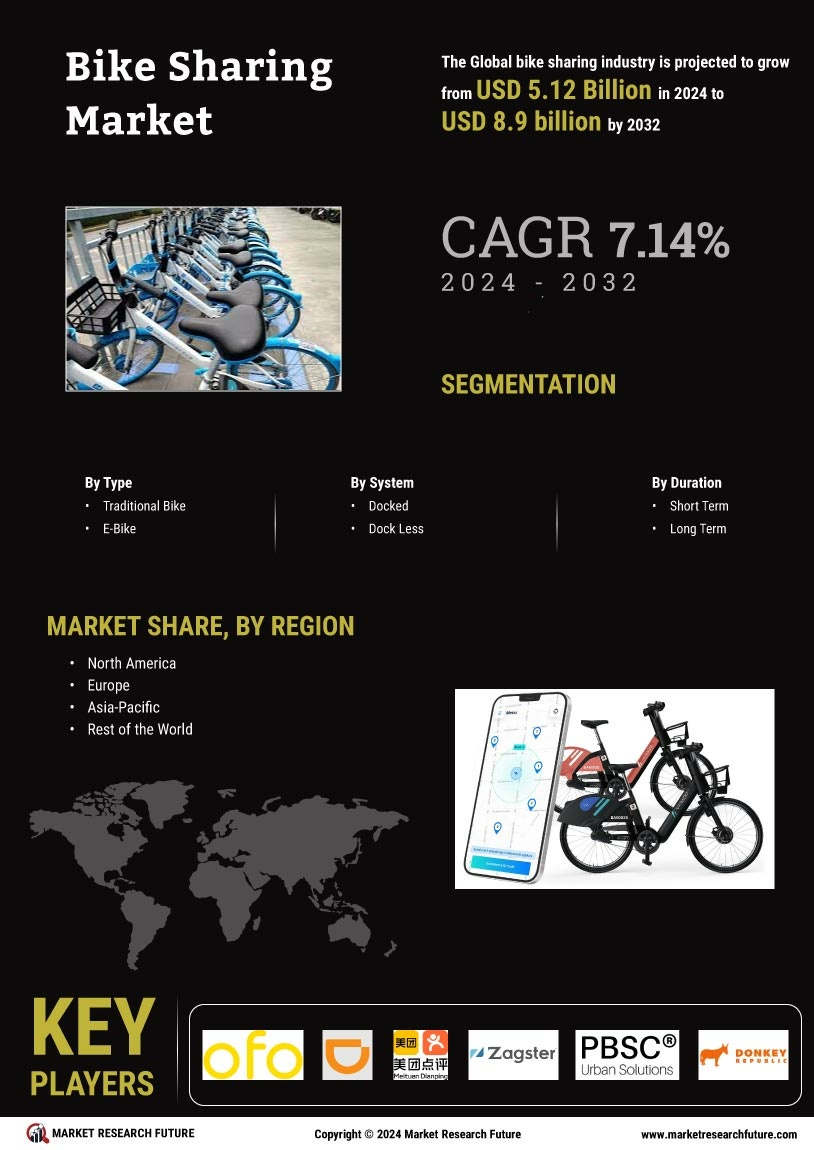
Bike Sharing Market Segmentation


Bike Sharing System Outlook (USD Billion, 2018-2032)


  • Docked


  • Dock Less


Bike Sharing Bike Type Outlook (USD Billion, 2018-2032)


  • Traditional Bike


  • E-Bike


Bike Sharing Duration Outlook (USD Billion, 2018-2032)


  • Short Term


  • Long Term


Bike Sharing Regional Outlook (USD Billion, 2018-2032)


  • North America Outlook (USD Billion, 2018-2032)


    • North America Bike Sharing by Sharing System


      • Docked


      • Dock Less


    • North America Bike Sharing by Bike Type


      • Traditional Bike


      • E-Bike


    • North America Bike Sharing by Sharing Duration


      • Short Term


      • Long Term


    • US Outlook (USD Billion, 2018-2032)


    • US Bike Sharing by Sharing System


      • Docked


      • Dock Less


    • US Bike Sharing by Bike Type


      • Traditional Bike


      • E-Bike


    • US Bike Sharing by Sharing Duration


      • Short Term


      • Long Term


    • CANADA Outlook (USD Billion, 2018-2032)


    • CANADA Bike Sharing by Sharing System


      • Docked


      • Dock Less


    • CANADA Bike Sharing by Bike Type


      • Traditional Bike


      • E-Bike


    • CANADA Bike Sharing by Sharing Duration


      • Short Term


      • Long Term


  • Europe Outlook (USD Billion, 2018-2032)


    • Europe Bike Sharing by Sharing System


      • Docked


      • Dock Less


    • Europe Bike Sharing by Bike Type


      • Traditional Bike


      • E-Bike


    • Europe Bike Sharing by Sharing Duration


      • Short Term


      • Long Term


    • Germany Outlook (USD Billion, 2018-2032)


    • Germany Bike Sharing by Sharing System


      • Docked


      • Dock Less


    • Germany Bike Sharing by Bike Type


      • Traditional Bike


      • E-Bike


    • Germany Bike Sharing by Sharing Duration


      • Short Term


      • Long Term


    • France Outlook (USD Billion, 2018-2032)


    • France Bike Sharing by Sharing System


      • Docked


      • Dock Less


    • France Bike Sharing by Sharing Duration


      • Short Term


      • Long Term


    • France Bike Sharing by Bike Type


      • Traditional Bike


      • E-Bike


    • UK Outlook (USD Billion, 2018-2032)


    • UK Bike Sharing by Sharing System


      • Docked


      • Dock Less


    • UK Bike Sharing by Bike Type


      • Traditional Bike


      • E-Bike


    • UK Bike Sharing by Sharing Duration


      • Short Term


      • Long Term


    • ITALY Outlook (USD Billion, 2018-2032)


    • ITALY Bike Sharing by Sharing System


      • Docked


      • Dock Less


    • ITALY Bike Sharing by Bike Type


      • Traditional Bike


      • E-Bike


    • ITALY Bike Sharing by Sharing Duration


      • Short Term


      • Long Term


    • SPAIN Outlook (USD Billion, 2018-2032)


    • Spain Bike Sharing by Sharing System


      • Docked


      • Dock Less


    • Spain Bike Sharing by Bike Type


      • Traditional Bike


      • E-Bike


    • Spain Bike Sharing by Sharing Duration


      • Short Term


      • Long Term


    • Rest Of Europe Outlook (USD Billion, 2018-2032)


    • Rest Of Europe Bike Sharing by Sharing System


      • Docked


      • Dock Less


    • REST OF EUROPE Bike Sharing by Bike Type


      • Traditional Bike


      • E-Bike


    • Rest Of Europe Bike Sharing by Sharing Duration


      • Short Term


      • Long Term


  • Asia-Pacific Outlook (USD Billion, 2018-2032)


    • Asia-Pacific Bike Sharing by Sharing System


      • Docked


      • Dock Less


    • Asia-Pacific Bike Sharing by Bike Type


      • Traditional Bike


      • E-Bike


    • Asia-Pacific Bike Sharing by Sharing Duration


      • Short Term


      • Long Term


    • China Outlook (USD Billion, 2018-2032)


    • China Bike Sharing by Sharing System


      • Docked


      • Dock Less


    • China Bike Sharing by Bike Type


      • Traditional Bike


      • E-Bike


    • China Bike Sharing by Sharing Duration


      • Short Term


      • Long Term


    • Japan Outlook (USD Billion, 2018-2032)


    • Japan Bike Sharing by Sharing System


      • Docked


      • Dock Less


    • Japan Bike Sharing by Sharing Duration


      • Short Term


      • Long Term


    • Japan Bike Sharing by Bike Type


      • Traditional Bike


      • E-Bike


    • India Outlook (USD Billion, 2018-2032)


    • India Bike Sharing by Sharing System


      • Docked


      • Dock Less


    • India Bike Sharing by Bike Type


      • Traditional Bike


      • E-Bike


    • India Bike Sharing by Sharing Duration


      • Short Term


      • Long Term


    • Australia Outlook (USD Billion, 2018-2032)


    • Australia Bike Sharing by Sharing System


      • Docked


      • Dock Less


    • Australia Bike Sharing by Sharing Duration


      • Short Term


      • Long Term


    • Australia Bike Sharing by Bike Type


      • Traditional Bike


      • E-Bike


    • Rest of Asia-Pacific Outlook (USD Billion, 2018-2032)


    • Rest of Asia-Pacific Bike Sharing by Sharing System


      • Docked


      • Dock Less


    • Rest of Asia-Pacific Bike Sharing by Sharing Duration


      • Short Term


      • Long Term


    • Rest of Asia-Pacific Bike Sharing by Bike Type


      • Traditional Bike


      • E-Bike


  • Rest of the World Outlook (USD Billion, 2018-2032)


    • Rest of the World Bike Sharing by Sharing System


      • Docked


      • Dock Less


    • Rest of the World Bike Sharing by Sharing Duration


      • Short Term


      • Long Term


    • Rest of the World Bike Sharing by Bike Type


      • Traditional Bike


      • E-Bike


    • Middle East Outlook (USD Billion, 2018-2032)


    • Middle East Bike Sharing by Sharing System


      • Docked


      • Dock Less


    • Middle East Bike Sharing by Bike Type


      • Traditional Bike


      • E-Bike


    • Middle East Bike Sharing by Sharing Duration


      • Short Term


      • Long Term


    • Africa Outlook (USD Billion, 2018-2032)


    • Africa Bike Sharing by Sharing System


      • Docked


      • Dock Less


    • Africa Bike Sharing by Bike Type


      • Traditional Bike


      • E-Bike


    • Africa Bike Sharing by Sharing Duration


      • Short Term


      • Long Term


    • Latin America Outlook (USD Billion, 2018-2032)


    • Latin America Bike Sharing by Sharing System


      • Docked


      • Dock Less


    • Latin America Bike Sharing by Bike Type


      • Traditional Bike


      • E-Bike


    • Latin America Bike Sharing by Sharing Duration


      • Short Term


      • Long Term


Research Methodology on Bike Sharing Market


1. Introduction


This research aims to analyze the current bike sharing market & to forecast the future growth of the sector from 2023 to 2030. The report provides an overview of the key trends and developments in the bike sharing market, taking into consideration the market size, financial performance, key opportunities, drivers, key challenges and the dynamics of the sector. The report will also provide an estimate of the growth and value of the bike sharing market over the forecasted period 2023 to 2030.


2 General Objectives:


The general objective of this research is to provide a thorough evaluation of the bike sharing market and its future potential. In particular, our aim is to:


-Identify key market trends & evaluate the bike sharing market


-Estimate the value and growth of the bike sharing market


-Analyze the key drivers, challenges, and opportunities in the bike sharing market


-Analyze the current and forecasted market size in order to indicate the future potential of the sector


-Provide an overview of the key market players and their financial performance


-Provide key insights into the strategy of the bike sharing market participants


3 Primary Research


In order to assess and analyze the bike sharing market, we will carry out primary research by conducting interviews with key stakeholders and industry experts, such as CEOs, industry analysts, and market research firms. Data will also be collected from trade associations, industry newsletters, and company reports. This research will be used to provide an overview of the bike sharing market, evaluate the current levels of activity and potential for future growth, and identify the key players in the sector.


4 Secondary Research


Secondary research will involve the use of a variety of report databases and industry websites to collect data. Data will be obtained from reports such as market reports, industry reports, and competitive intelligence. The sources of data will also include economic and industry indicators such as employment data, GDP, industry trends and forecasts, as well as company financials and key executive interviews. The secondary data obtained will be used to evaluate the opportunities and challenges within the market.


5 Analytical Strategies


Our research methodology will utilize a variety of analytical techniques in order to provide an accurate and detailed assessment of the bike sharing market. These techniques will include data collection, market sizing, market segmentation, competitor profiling, market analysis, trend analysis, and growth projections. In addition, we will use qualitative research techniques such as interviews with industry experts in order to gain insights into the current dynamics of the sector.


6 Data Analysis & Quality Assurance


Data gathered from both primary and secondary sources will be analyzed using advanced statistical software in order to identify the key trends and dynamics in the market. The data will also be validated by experts in the field in order to ensure accuracy and quality. In addition, rigorous data processing will be undertaken in order to ensure that only relevant data is included in the final report.


7 Report Structure


The report will be structured to cover the key elements of the bike sharing market including market size & value, market trends & drivers, key players & strategies, industry performance & financial analysis, competitive landscape, market segmentation, and growth projections.

Leading companies partner with us for data-driven Insights
client_1 client_2 client_3 client_4 client_5 client_6 client_7 client_8 client_9 client_10
Please fill in Business Email for Quick Response

TABLE OF CONTENTS

1 EXECUTIVE SUMMARY

2 MARKET INTRODUCTION

2.1 MARKET DEFINITION

2.2 SCOPE OF THE STUDY

2.3 MARKET STRUCTURE

3 RESEARCH METHODOLOGY

3.1 PRIMARY RESEARCH

3.2 SECONDARY RESEARCH

3.3 MARKET CAPACITY ESTIMATION

3.4 FORECAST MODEL

3.5 LIST OF ASSUMPTIONS

3.6 LIMITATIONS OF THE STUDY

4 MARKET INSIGHTS

5 MARKET DYNAMICS

5.1 INTRODUCTION

5.2 MARKET DRIVERS

5.3 MARKET RESTRAINTS

5.4 MARKET OPPORTUNITIES

5.5 PORTER’S FIVE FORCES ANALYSIS

5.5.1 THREAT OF NEW ENTRANTS

5.5.2 BARGAINING POWER OF BUYERS

5.5.3 BARGAINING POWER OF SUPPLIERS

5.5.4 THREAT OF SUBSTITUTES

5.5.5 INTENSITY OF RIVALRY

5.6 VALUE CHAIN/SUPPLY CHAIN ANALYSIS

6 GLOBAL BIKE SHARING MARKET, BY BIKE TYPE

6.1 INTRODUCTION

6.2 TRADITIONAL BIKE

6.2.1 MARKET ESTIMATES & FORECAST, 2023–2032

6.2.2 MARKET ESTIMATES & FORECAST, BY REGION, 2023–2032

6.3 E-BIKE

6.3.1 MARKET ESTIMATES & FORECAST, 2023–2032

6.3.2 MARKET ESTIMATES & FORECAST, BY REGION, 2023–2032

7 GLOBAL BIKE SHARING MARKET, BY SHARING SYSTEM

7.1 INTRODUCTION

7.2 DOCKED

7.2.1 MARKET ESTIMATES & FORECAST, 2023–2032

7.2.2 MARKET ESTIMATES & FORECAST, BY REGION, 2023–2032

7.3 DOCK LESS

7.3.1 MARKET ESTIMATES & FORECAST, 2023–2032

7.3.2 MARKET ESTIMATES & FORECAST, BY REGION, 2023–2032

8 GLOBAL BIKE SHARING MARKET, BY SHARING DURATION

8.1 INTRODUCTION

8.2 SHORT TERM

8.2.1 MARKET ESTIMATES & FORECAST, 2023–2032

8.2.2 MARKET ESTIMATES & FORECAST, BY REGION, 2023–2032

8.3 LONG TERM

8.3.1 MARKET ESTIMATES & FORECAST, 2023–2032

8.3.2 MARKET ESTIMATES & FORECAST, BY REGION, 2023–2032

9 GLOBAL BIKE SHARING MARKET, BY REGION

9.1 INTRODUCTION

9.2 NORTH AMERICA

9.2.1 MARKET ESTIMATES & FORECAST, BY BIKE TYPE, 2023–2032

9.2.2 MARKET ESTIMATES & FORECAST, BY SHARING SYSTEM, 2023–2032

9.2.3 MARKET ESTIMATES & FORECAST, BY SHARING DURATION, 2023–2032

9.2.4 MARKET ESTIMATES & FORECAST, BY COUNTRY, 2023–2032

9.2.5 US

9.2.5.1 MARKET ESTIMATES & FORECAST, BY BIKE TYPE, 2023–2032

9.2.5.2 MARKET ESTIMATES & FORECAST, BY SHARING SYSTEM, 2023–2032

9.2.5.3 MARKET ESTIMATES & FORECAST, BY SHARING DURATION, 2023–2032

9.2.6 CANADA

9.2.6.1 MARKET ESTIMATES & FORECAST, BY BIKE TYPE, 2023–2032

9.2.6.2 MARKET ESTIMATES & FORECAST, BY SHARING SYSTEM, 2023–2032

9.2.6.3 MARKET ESTIMATES & FORECAST, BY SHARING DURATION, 2023–2032

9.2.7 MEXICO

9.2.7.1 MARKET ESTIMATES & FORECAST, BY BIKE TYPE, 2023–2032

9.2.7.2 MARKET ESTIMATES & FORECAST, BY SHARING SYSTEM, 2023–2032

9.2.7.3 MARKET ESTIMATES & FORECAST, BY SHARING DURATION, 2023–2032

9.3 EUROPE

9.3.1 MARKET ESTIMATES & FORECAST, BY BIKE TYPE, 2023–2032

9.3.2 MARKET ESTIMATES & FORECAST, BY SHARING SYSTEM, 2023–2032

9.3.3 MARKET ESTIMATES & FORECAST, BY SHARING DURATION, 2023–2032

9.3.4 MARKET ESTIMATES & FORECAST, BY COUNTRY, 2023–2032

9.3.5 GERMANY

9.3.5.1 MARKET ESTIMATES & FORECAST, BY BIKE TYPE, 2023–2032

9.3.5.2 MARKET ESTIMATES & FORECAST, BY SHARING SYSTEM, 2023–2032

9.3.5.3 MARKET ESTIMATES & FORECAST, BY SHARING DURATION, 2023–2032

9.3.6 UK

9.3.6.1 MARKET ESTIMATES & FORECAST, BY BIKE TYPE, 2023–2032

9.3.6.2 MARKET ESTIMATES & FORECAST, BY SHARING SYSTEM, 2023–2032

9.3.6.3 MARKET ESTIMATES & FORECAST, BY SHARING DURATION, 2023–2032

9.3.7 FRANCE

9.3.7.1 MARKET ESTIMATES & FORECAST, BY BIKE TYPE, 2023–2032

9.3.7.2 MARKET ESTIMATES & FORECAST, BY SHARING SYSTEM, 2023–2032

9.3.7.3 MARKET ESTIMATES & FORECAST, BY SHARING DURATION, 2023–2032

9.3.8 ITALY

9.3.8.1 MARKET ESTIMATES & FORECAST, BY BIKE TYPE, 2023–2032

9.3.8.2 MARKET ESTIMATES & FORECAST, BY SHARING SYSTEM, 2023–2032

9.3.8.3 MARKET ESTIMATES & FORECAST, BY SHARING DURATION, 2023–2032

9.3.9 REST OF EUROPE

9.3.9.1 MARKET ESTIMATES & FORECAST, BY BIKE TYPE, 2023–2032

9.3.9.2 MARKET ESTIMATES & FORECAST, BY SHARING SYSTEM, 2023–2032

9.3.9.3 MARKET ESTIMATES & FORECAST, BY SHARING DURATION, 2023–2032

9.4 ASIA-PACIFIC

9.4.1 MARKET ESTIMATES & FORECAST, BY BIKE TYPE, 2023–2032

9.4.2 MARKET ESTIMATES & FORECAST, BY SHARING SYSTEM, 2023–2032

9.4.3 MARKET ESTIMATES & FORECAST, BY SHARING DURATION, 2023–2032

9.4.4 MARKET ESTIMATES & FORECAST, BY COUNTRY, 2023–2032

9.4.5 CHINA

9.4.5.1 MARKET ESTIMATES & FORECAST, BY BIKE TYPE, 2023–2032

9.4.5.2 MARKET ESTIMATES & FORECAST, BY SHARING SYSTEM, 2023–2032

9.4.5.3 MARKET ESTIMATES & FORECAST, BY SHARING DURATION, 2023–2032

9.4.6 JAPAN

9.4.6.1 MARKET ESTIMATES & FORECAST, BY BIKE TYPE, 2023–2032

9.4.6.2 MARKET ESTIMATES & FORECAST, BY SHARING SYSTEM, 2023–2032

9.4.6.3 MARKET ESTIMATES & FORECAST, BY SHARING DURATION, 2023–2032

9.4.7 INDIA

9.4.7.1 MARKET ESTIMATES & FORECAST, BY BIKE TYPE, 2023–2032

9.4.7.2 MARKET ESTIMATES & FORECAST, BY SHARING SYSTEM, 2023–2032

9.4.7.3 MARKET ESTIMATES & FORECAST, BY SHARING DURATION, 2023–2032

9.4.8 REST OF ASIA-PACIFIC

9.4.8.1 MARKET ESTIMATES & FORECAST, BY BIKE TYPE, 2023–2032

9.4.8.2 MARKET ESTIMATES & FORECAST, BY SHARING SYSTEM, 2023–2032

9.4.8.3 MARKET ESTIMATES & FORECAST, BY SHARING DURATION, 2023–2032

9.5 REST OF THE WORLD

9.5.1 MARKET ESTIMATES & FORECAST, BY BIKE TYPE, 2023–2032

9.5.2 MARKET ESTIMATES & FORECAST, BY SHARING SYSTEM, 2023–2032

9.5.3 MARKET ESTIMATES & FORECAST, BY SHARING DURATION, 2023–2032

10 COMPETITIVE LANDSCAPE

10.1 COMPETITIVE SCENARIO

10.2 COMPETITIVE BENCHMARKING OF THE GLOBAL BIKE SHARING MARKET

10.3 MAJOR GROWTH KEY STRATEGIES IN THE GLOBAL BIKE SHARING MARKET

10.4 MARKET SHARE ANALYSIS: GLOBAL BIKE SHARING MARKET

10.5 PRODUCT DEVELOPMENT IN GLOBAL BIKE SHARING MARKET

10.6 MERGERS AND ACQUISITIONS IN GLOBAL BIKE SHARING MARKET

10.7 CONTRACTS AND AGREEMENTS IN GLOBAL BIKE SHARING MARKET

10.8 EXPANSIONS AND INVESTMENTS IN GLOBAL BIKE SHARING MARKET

11 COMPANY PROFILE

11.1 BLUEGOGO (CHINA)

11.1.1 COMPANY OVERVIEW

11.1.2 PRODUCTS/SERVICES OFFERED

11.1.3 FINANCIAL OVERVIEW

11.1.4 KEY DEVELOPMENTS

11.1.5 KEY STRATEGIES

11.1.6 SWOT ANALYSIS

11.2 DROPBIKE HEAVEN (CANADA)

11.2.1 COMPANY OVERVIEW

11.2.2 PRODUCTS/SERVICES OFFERED

11.2.3 FINANCIAL OVERVIEW

11.2.4 KEY DEVELOPMENTS

11.2.5 KEY STRATEGIES

11.2.6 SWOT ANALYSIS

11.3 JCDECAUX (FRANCE)

11.3.1 COMPANY OVERVIEW

11.3.2 PRODUCTS/SERVICES OFFERED

11.3.3 FINANCIAL OVERVIEW

11.3.4 KEY DEVELOPMENTS

11.3.5 KEY STRATEGIES

11.3.6 SWOT ANALYSIS

11.4 LYFT, INC (US)

11.4.1 COMPANY OVERVIEW

11.4.2 PRODUCTS/SERVICES OFFERED

11.4.3 FINANCIAL OVERVIEW

11.4.4 KEY DEVELOPMENTS

11.4.5 KEY STRATEGIES

11.4.6 SWOT ANALYSIS

11.5 MOBIKE (CHINA)

11.5.1 COMPANY OVERVIEW

11.5.2 PRODUCTS/SERVICES OFFERED

11.5.3 FINANCIAL OVERVIEW

11.5.4 KEY DEVELOPMENTS

11.5.5 KEY STRATEGIES

11.5.6 SWOT ANALYSIS

11.6 NEUTRON HOLDINGS, INC (US)

11.6.1 COMPANY OVERVIEW

11.6.2 PRODUCTS/SERVICES OFFERED

11.6.3 FINANCIAL OVERVIEW

11.6.4 KEY DEVELOPMENTS

11.6.5 KEY STRATEGIES

11.6.6 SWOT ANALYSIS

11.7 MOTIVATE (US)

11.7.1 COMPANY OVERVIEW

11.7.2 PRODUCTS/SERVICES OFFERED

11.7.3 FINANCIAL OVERVIEW

11.7.4 KEY DEVELOPMENTS

11.7.5 KEY STRATEGIES

11.7.6 SWOT ANALYSIS

11.8 JUMP BIKES (US)

11.8.1 COMPANY OVERVIEW

11.8.2 PRODUCTS/SERVICES OFFERED

11.8.3 FINANCIAL OVERVIEW

11.8.4 KEY DEVELOPMENTS

11.8.5 KEY STRATEGIES

11.8.6 SWOT ANALYSIS

11.9 OFO (CHINA)

11.9.1 COMPANY OVERVIEW

11.9.2 PRODUCTS/SERVICES OFFERED

11.9.3 FINANCIAL OVERVIEW

11.9.4 KEY DEVELOPMENTS

11.9.5 KEY STRATEGIES

11.9.6 SWOT ANALYSIS

11.10 NEXTBIKE BERLIN (GERMANY)

11.10.1 COMPANY OVERVIEW

11.10.2 PRODUCTS/SERVICES OFFERED

11.10.3 FINANCIAL OVERVIEW

11.10.4 KEY DEVELOPMENTS

11.10.5 KEY STRATEGIES

11.10.6 SWOT ANALYSIS

Purchase Option
Single User $ 4,950
Multiuser License $ 5,950
Enterprise User $ 7,250
Compare Licenses
Tailored for You
  • Dedicated Research on any specifics segment or region.
  • Focused Research on specific players in the market.
  • Custom Report based only on your requirements.
  • Flexibility to add or subtract any chapter in the study.
  • Historic data from 2014 and forecasts outlook till 2040.
  • Flexibility of providing data/insights in formats (PDF, PPT, Excel).
  • Provide cross segmentation in applicable scenario/markets.