• Cat-intel
  • MedIntelliX
  • Resources
  • About Us
  • Hero Background
    English
    Chinese
    French
    Japanese
    Korean
    German
    Spanish

    Autonomous Ships Market Size

    ID: MRFR/A&D/6631-HCR
    200 Pages
    Sejal Akre
    October 2025

    Autonomous Ships Market Research Report By Vessel Type (Cargo Ships, Tankers, Passenger Ships, Fishing Vessels), By Technology (Remote Controlled, Fully Autonomous, Semi-Autonomous), By End Use (Commercial Shipping, Defence, Research and Exploration), By Navigation System (GPS Based Systems, Lidar Systems, Radar Systems) and By Regional (North America, Europe, South America, Asia Pacific, Middl...

    Share:
    Download PDF ×

    We do not share your information with anyone. However, we may send you emails based on your report interest from time to time. You may contact us at any time to opt-out.

    Autonomous Ships Market Infographic
    $ 4,950.0
    $ 5,950.0
    $ 7,250.0

    Autonomous Ships Size

    Autonomous Ships Market Growth Projections and Opportunities

    The Autonomous Ships Market dynamics are shaped by a myriad of factors influencing its growth, innovation, and adoption across the maritime industry. Technological advancements stand as a primary driver. Rapid developments in autonomous technologies, including AI-driven navigation systems, sensor fusion, machine learning algorithms, and advanced communication networks, define the market landscape. These advancements enable the creation of highly sophisticated autonomous vessels capable of safe and efficient navigation, thus propelling the market forward. Regulatory and legal frameworks significantly impact the Autonomous Ships Market. The industry is subject to a complex web of maritime regulations and international laws governing autonomous operations, safety standards, liability, and cybersecurity. Compliance with these regulations, coupled with the establishment of standardized frameworks, remains a crucial factor influencing market growth and the widespread adoption of autonomous shipping. Market demand and operational efficiency play a pivotal role in driving the dynamics of the Autonomous Ships Market. The industry's quest for increased efficiency, reduced operational costs, and enhanced safety drives the demand for autonomous vessels. The promise of optimizing route planning, fuel consumption, and overall operational performance fuels the market's evolution toward autonomous solutions across various maritime sectors. Economic and commercial considerations significantly influence the Autonomous Ships Market dynamics. The overall economic climate, including maritime trade volume, fuel prices, labor costs, and the return on investment (ROI) of autonomous technology, shapes market demand. Companies assess the economic viability of adopting autonomous vessels, considering factors such as initial investment, operational savings, and long-term profitability, thus influencing the market's growth trajectory. The industry's focus on safety and risk reduction stands as a significant market factor. Autonomous ships are equipped with advanced sensor systems, collision avoidance technology, and AI-driven decision-making capabilities, contributing to improved safety standards and reduced accident risks. Safety concerns are central in shaping market preferences and regulatory frameworks related to autonomous shipping operations. Moreover, the industry's commitment to sustainability and environmental responsibility drives the demand for autonomous vessels. These ships are designed to optimize fuel consumption, reduce emissions, and mitigate the environmental impact of maritime operations. As sustainability becomes a more significant concern, the adoption of autonomous ships aligns with the industry's efforts to comply with environmental regulations and reduce its carbon footprint. The shortage of skilled maritime labor and the evolving workforce landscape impact the Autonomous Ships Market. The industry faces challenges related to an aging workforce and a shortage of qualified personnel. Autonomous technology presents a solution by reducing the reliance on onboard crews, mitigating labor shortages, and addressing workforce challenges, thereby influencing the market's evolution. Furthermore, data-driven decision-making and the integration of digital technologies are crucial market factors. Autonomous vessels are equipped with sophisticated sensors and data analytics capabilities that collect and process real-time information. The ability to gather and utilize data for optimized operations, predictive maintenance, and route planning influences the market's growth and the adoption rate of autonomous technology. In conclusion, the Autonomous Ships Market dynamics are influenced by technological advancements, regulatory frameworks, market demand, economic considerations, safety standards, sustainability goals, workforce challenges, digital integration, and data utilization. The interplay of these factors shapes innovation, adoption rates, and the evolution of autonomous shipping, ultimately impacting the maritime industry's transformation toward safer, more efficient, and environmentally conscious operations.

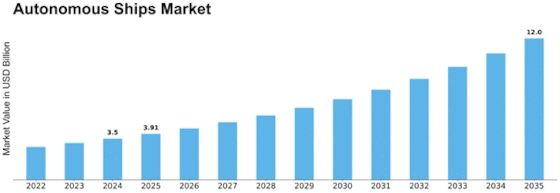
    Autonomous Ships Market Size Graph

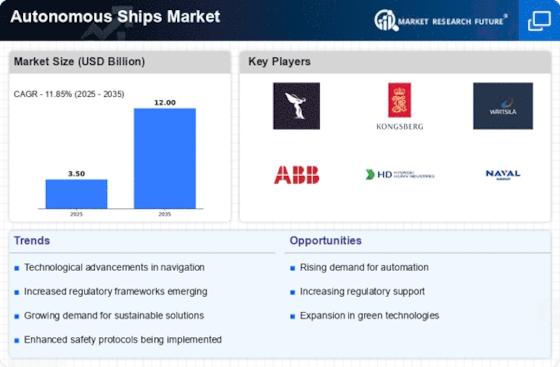
    Market Summary

    As per Market Research Future Analysis, the Autonomous Ships Market was valued at 3.13 USD Billion in 2023 and is projected to grow to 12 USD Billion by 2035, with a CAGR of 11.85% from 2025 to 2035. The market is driven by technological advancements, safety concerns, and sustainability efforts, with significant investments in research and development from both governments and private sectors. Major shipping companies are adopting autonomous technologies to enhance operational efficiency and reduce costs, while regulatory frameworks are evolving to support the deployment of autonomous vessels.

    Key Market Trends & Highlights

    The Autonomous Ships Market is witnessing transformative trends that are reshaping maritime operations.

    • The market is expected to reach 3.5 USD Billion by 2024, driven by increasing demand for shipping efficiency.
    • Cargo ships dominate the market, valued at 1.4 USD Billion in 2024, highlighting their critical role in global trade.
    • Technological advancements in AI and automation are projected to improve safety and efficiency by up to 40%.
    • Regulatory support is anticipated to increase the deployment of autonomous vessels by 15% by 2030.

    Market Size & Forecast

    2023 Market Size USD 3.13 Billion
    2024 Market Size USD 3.5 Billion
    2035 Market Size USD 12 Billion
    CAGR (2025-2035) 11.85%
    Largest Regional Market Share in 2024 Europe.

    Major Players

    Key players include Nortek, Caterpillar, Fincantieri, Orolia, Kongsberg Gruppen, Sea Machines Robotics, Hyundai Heavy Industries, GE Marine, Bae Systems, Mitsubishi Heavy Industries, Rolls-Royce, Naval Group, Wärtsilä, and Thales Group.

    Market Trends

    The Autonomous Ships Market is currently experiencing significant market trends driven by technological advances, increased emphasis on safety, and sustainability.

    The development of artificial intelligence and machine learning enhances the capabilities of autonomous vessels, positively impacting navigation and operational efficiency. Additionally, regulations in various global regions are evolving to accommodate and support autonomous shipping operations.

    Safety remains a paramount concern, with stakeholders increasingly recognizing that autonomous ships can reduce human error, which is a leading cause of maritime accidents. The shift towards greener technologies also highlights the industry's commitment to reducing carbon emissions and the environmental impact of shipping.

    The global market offers a vast array of opportunities, particularly in the integration of digital port infrastructure, which can enhance supply chain efficiency and streamline logistics. In order to promote innovation in this field, governments and private sectors in numerous countries are investing in research and development.

    Additionally, the growing interest in unmanned shipping offers opportunities for collaborations between various industries, such as the maritime and technology sectors.

    In recent years, there has been a trend among various countries to operate autonomous vessels in order to evaluate regulatory compliance and operational feasibility. This trend indicates a readiness among nations to adopt sophisticated technologies in the shipping industry.

    Collaborations among maritime organizations, governments, and universities are gathering momentum in order to develop a talent pool that is proficient in autonomous systems. In general, the Autonomous Ships Market is on the brink of a transformation as these trends continue to develop, thereby enabling the development of more environmentally favorable, efficient, and secure shipping solutions.

    The ongoing advancements in artificial intelligence and sensor technology are poised to redefine maritime operations, potentially enhancing safety and efficiency in the global shipping industry.

    U.S. Department of Transportation

    Autonomous Ships Market Market Drivers

    Cost Efficiency

    Cost efficiency stands as a pivotal driver for the Global Autonomous Ships Market Industry. Autonomous vessels are anticipated to significantly reduce operational costs through optimized fuel consumption and minimized labor expenses. For example, the implementation of autonomous technology can lead to a reduction in crew size, thereby lowering wage-related expenditures. Additionally, enhanced route planning and fuel-efficient operations may yield savings that could be reinvested into fleet expansion. This economic advantage is likely to attract more stakeholders, further propelling the market's growth trajectory.

    Regulatory Support

    Regulatory frameworks are increasingly supportive of the Global Autonomous Ships Market Industry, as governments recognize the potential benefits of autonomous shipping. Initiatives from organizations such as the International Maritime Organization are paving the way for the safe integration of autonomous vessels into existing maritime regulations. Countries like Norway and Singapore are leading the charge by establishing testbeds and regulatory sandboxes for autonomous shipping trials. This supportive environment is likely to foster innovation and investment, contributing to a projected market growth to 12 USD Billion by 2035.

    Market Growth Projections

    Technological Advancements

    The Global Autonomous Ships Market Industry is propelled by rapid technological advancements in artificial intelligence, machine learning, and sensor technologies. These innovations enhance the capabilities of autonomous vessels, allowing for improved navigation, obstacle detection, and decision-making processes. For instance, companies like Rolls-Royce and Kongsberg are actively developing systems that integrate advanced algorithms to facilitate real-time data processing. As a result, the market is projected to reach 3.5 USD Billion in 2024, indicating a growing reliance on these technologies to optimize maritime operations and reduce human error.

    Environmental Sustainability

    The Global Autonomous Ships Market Industry is increasingly aligned with environmental sustainability goals. Autonomous vessels are designed to optimize fuel consumption and reduce emissions, contributing to global efforts to combat climate change. For instance, the use of advanced navigation systems can minimize fuel usage by ensuring the most efficient routes are taken. As regulations tighten around emissions, the demand for eco-friendly shipping solutions is expected to rise. This trend not only supports the industry's growth but also aligns with broader global initiatives aimed at achieving sustainable maritime operations.

    Increased Demand for Automation

    The growing demand for automation in various sectors is a significant driver for the Global Autonomous Ships Market Industry. As industries seek to enhance efficiency and reduce human error, the maritime sector is no exception. The adoption of autonomous ships is seen as a solution to address labor shortages and improve operational reliability. With a projected compound annual growth rate of 11.85% from 2025 to 2035, the market is likely to witness an influx of investments aimed at developing automated shipping solutions that meet the evolving needs of global trade.

    Market Segment Insights

    Autonomous Ships Market Segment Insights

    Autonomous Ships Market Segment Insights

    Autonomous Ships Market Vessel Type Insights

    Autonomous Ships Market Vessel Type Insights

    The Autonomous Ships Market, categorized by vessel type, is witnessing significant growth, indicating a shift towards automation in maritime operations. By 2024, the overall valuation of the market is set at 3.5 USD Billion, driven by advancements in technology and increasing demand for efficiency in ship operations.

    The dominant segment within this market is cargo ships, valued at 1.4 USD Billion in 2024, which represent a majority holding due to their pivotal role in global trade and supply chains. Following closely, tankers have a market valuation of 1.1 USD Billion, demonstrating their critical importance in transporting various liquids including oil and chemicals.The passenger ships segment, while smaller at 0.8 USD Billion in 2024, plays a significant role in the tourism industry, providing opportunities for autonomous vessels to enhance passenger experience through improved safety and efficiency.

    Fishing vessels, although valued at just 0.2 USD Billion, are becoming increasingly relevant as sustainability drives the industry towards automation.

    The market growth for these vessel types is attributed to emerging technologies that streamline operations and reduce human error. Additionally, investments in Research and Development are essential to expand capabilities across these categories, meeting regulatory requirements and consumer expectations.Overall, the Autonomous Ships Market segmentation reveals that cargo ships and tankers hold significant positions due to their operational scale and necessity in trade, while passenger ships and fishing vessels are important for specific market niches that are gradually adopting automation solutions.

    Autonomous Ships Market Technology Insights

    Autonomous Ships Market Technology Insights

    The Autonomous Ships Market, particularly within the Technology segment, is experiencing substantial growth, projected to reach a valuation of 3.5 USD Billion by 2024. This segment encompasses various operational capabilities, including Remote Controlled, Fully Autonomous, and Semi-Autonomous systems.

    Remote Controlled vessels are critical as they provide a transitional step towards full autonomy, allowing for human oversight while enhancing operational efficiency. Fully Autonomous ships represent the forefront of maritime innovation, potentially revolutionizing sea transport by improving safety and reducing human error.Semi-Autonomous systems serve as an effective compromise, combining automated functions with human intervention, making them significant in operations requiring flexibility.

    As the industry witnesses shifts towards increased automation, the Autonomous Ships Market is poised to capitalize on trends favoring sustainability and safety, driven by technological advancements and regulatory support from global maritime authorities.

    The Autonomous Ships Market industry is gaining traction as stakeholders increasingly recognize the potential benefits in terms of cost savings and enhanced operational capabilities, ultimately reflecting a robust forecast for the entire market through 2035.

    Autonomous Ships Market End Use Insights

    Autonomous Ships Market End Use Insights

    In the Autonomous Ships Market, the End Use segment plays a pivotal role, with applications across various sectors such as Commercial Shipping, Defence, and Research and Exploration. The market's revenue is projected to reach 3.5 billion USD by 2024, underlining the growing significance of autonomous technologies in maritime operations.

    Commercial Shipping, which is witnessing a transformative shift towards automation, is crucial as it enhances operational efficiency and reduces labor costs for shipping companies.

    Defence applications leverage autonomous ships for enhanced surveillance and logistics, ensuring strategic advantages in maritime security.Meanwhile, the Research and Exploration sector benefits from autonomous ships by improving data collection and environmental monitoring in challenging marine environments.

    The Autonomous Ships Market segmentation reveals that these three areas are not only integral in driving market growth but are also opening up new opportunities for innovation and collaboration across the global shipping industry.

    Autonomous Ships Market Navigation System Insights

    Autonomous Ships Market Navigation System Insights

    The Autonomous Ships Market focusing on the Navigation System segment is experiencing significant growth, with the market projected to be valued at 3.5 USD Billion in 2024. The increasing adoption of autonomous technologies in maritime operations has been a key driver for this market.

    Among the various technologies, GPS Based Systems greatly enhance precision in navigation, ensuring accurate positioning which is crucial for autonomous ships.

    Lidar Systems are becoming increasingly essential as they provide high-resolution imaging that helps in obstacle detection and environmental mapping, making navigation safer.Radar Systems play a vital role in long-range detection capabilities, significantly contributing to the operational safety of autonomous vessels. The combination of these systems creates a comprehensive navigation solution that is set to dominate the market landscape.

    Moreover, advancements in these technologies are addressing major challenges such as safety and efficiency in maritime transport, aligning with the global push towards smart shipping solutions.

    Get more detailed insights about Autonomous Ships Market Research Report - Global Forecast till 2035

    Regional Insights

    The Autonomous Ships Market is projected to witness substantial growth across various regions, with a total value of 3.5 USD Billion in 2024. North America and Europe are significant players, with valuations of 0.933 USD Billion and 1.089 USD Billion in 2024, respectively, demonstrating a majority holding within the market.

    By 2035, Europe’s market valuation is expected to rise to 3.68 USD Billion, indicating its dominance due to strong maritime technology adoption. Asia Pacific, valued at 0.7 USD Billion in 2024, is also crucial, with a projected growth to 2.4 USD Billion by 2035, driven by increasing investments in maritime automation.

    The Middle East and Africa, while lesser-valued at 0.389 USD Billion currently, possess great potential due to ongoing developments in shipping infrastructure.

    South America, with a current value of 0.389 USD Billion, also showcases emerging market dynamics, reflecting a growing interest in autonomous shipping technologies.

    Overall, these regions represent essential components of the Autonomous Ships Market, with varying degrees of growth and investment shaping the industry's landscape.

    Autonomous Ships Market Regional Insights

    Source: Primary Research, Secondary Research, Market Research Future Database and Analyst Review

    Key Players and Competitive Insights

    The Autonomous Ships Market is experiencing a significant transformation driven by advancements in technology, increasing demand for maritime efficiency, and stringent regulations on shipping emissions.

    As various stakeholders aim to develop autonomous vessels, the competitive landscape showcases a diverse range of companies investing in research and development, strategic partnerships, and innovative solutions tailored for the unique requirements of the maritime sector.

    Companies in this market are leveraging artificial intelligence, sensor technology, and autonomous navigation systems to create smarter, safer, and more efficient ships.

    The competition is robust, with established players and emerging start-ups constantly innovating to gain an edge and capture market share, contributing to a dynamic environment characterized by rapid technological advancements and evolving consumer expectations.

    Nortek has established its presence in the Autonomous Ships Market with a focus on providing advanced sensor technologies and measurement solutions for maritime applications.

    The company specializes in developing state-of-the-art acoustic Doppler instruments and sonar-based sensors, which are crucial for navigation, environmental monitoring, and operational efficiency in autonomous ships. Nortek's strengths lie in its extensive expertise in fluid dynamics and hydrodynamics, enabling the design of highly efficient autonomous systems.

    The company's commitment to innovation and quality, combined with its strong relationships with various maritime and research institutions worldwide, enhances its competitive positioning in the market. By combining engineering excellence with a customer-centric approach, Nortek is well-equipped to meet the evolving demands of the autonomous shipping sector.

    Caterpillar is a prominent player in the Autonomous Ships Market, known for its comprehensive range of marine engines and power systems tailored for the maritime industry. The company focuses on delivering high-performance solutions that optimize fuel efficiency and reduce emissions in autonomous vessels.

    Key products include advanced propulsion systems and integrated automation technologies that enable seamless operation of unmanned ships. Caterpillar's strengths are highlighted by its extensive experience in the heavy equipment sector, robust distribution network, and strong commitment to sustainability within marine operations.

    The company has also engaged in several strategic mergers and acquisitions to expand its technological capabilities and enhance its product offerings in the autonomous shipping domain. By leveraging its global footprint and substantial investments in innovation, Caterpillar is strategically positioned to lead this market segment.

    Key Companies in the Autonomous Ships Market market include

    Industry Developments

    Recent developments in the Autonomous Ships Market highlight significant technological advancements and growing investments.

    Companies like Hyundai Heavy Industries and Rolls-Royce have been actively developing autonomous vessel technologies aimed at improving safety and efficiency in maritime operations.

    The market is seeing increasing collaboration among leading firms; for instance, Fincantieri has announced partnerships to integrate smart technologies for better navigation systems in autonomous ships.

    In terms of mergers and acquisitions, in June 2023, Kongsberg Gruppen completed the acquisition of a stake in Sea Machines Robotics to enhance its capabilities in autonomous maritime operations, which signals a consolidation trend in the industry.

    The global market valuation for autonomous shipping is expected to rise significantly, driven by demand for reduced operational costs and improved environmental compliance.

    The governments in various regions, including Europe and Asia, are investing in regulatory frameworks to support the development of unmanned vessels.

    Over the last few years, key milestones included the successful testing of autonomous ships by companies such as Naval Group and Thales Group, which have drawn attention to the potential of autonomous technology in reshaping maritime industries.

    Future Outlook

    Autonomous Ships Market Future Outlook

    The Autonomous Ships Market is projected to grow at 11.85% CAGR from 2024 to 2035, driven by advancements in AI, regulatory support, and demand for operational efficiency.

    New opportunities lie in:

    • Develop AI-driven navigation systems for enhanced safety and efficiency.
    • Create partnerships with shipping companies for pilot projects.
    • Invest in cybersecurity solutions tailored for autonomous maritime operations.

    By 2035, the Autonomous Ships Market is expected to be a pivotal segment in global shipping, reflecting substantial technological advancements.

    Market Segmentation

    Autonomous Ships Market End Use Outlook

    • GPS Based Systems
    • Lidar Systems
    • Radar Systems

    Autonomous Ships Market Regional Outlook

    • North America
    • Europe
    • South America
    • Asia Pacific
    • Middle East and Africa

    Autonomous Ships Market Technology Outlook

    • Commercial Shipping
    • Defence
    • Research and Exploration

    Autonomous Ships Market Vessel Type Outlook

    • Remote Controlled
    • Fully Autonomous
    • Semi-Autonomous

    Autonomous Ships Market Navigation System Outlook

    • North America
    • Europe
    • South America
    • Asia Pacific
    • Middle East and Africa

    Report Scope

    Report Attribute/Metric Details
    Market Size 2023 3.13(USD Billion)
    Market Size 2024 3.5(USD Billion)
    Market Size 2035 12.0(USD Billion)
    Compound Annual Growth Rate (CAGR) 11.85% (2025 - 2035)
    Report Coverage Revenue Forecast, Competitive Landscape, Growth Factors, and Trends
    Base Year 2024
    Market Forecast Period 2025 - 2035
    Historical Data 2019 - 2024
    Market Forecast Units USD Billion
    Key Companies Profiled Nortek, Caterpillar, Fincantieri, Orolia, Kongsberg Gruppen, Sea Machines Robotics, Hyundai Heavy Industries, GE Marine, Bae Systems, Mitsubishi Heavy Industries, RollsRoyce, Naval Group, Wärtsilä, Thales Group
    Segments Covered Vessel Type, Technology, End Use, Navigation System, Regional
    Key Market Opportunities Technological advancements in AI, Growing demand for efficiency, Regulatory support for automation, Expansion in maritime logistics, Enhanced safety and environmental benefits
    Key Market Dynamics Technological advancements, Regulatory frameworks, Cost reduction, Safety improvements, Environmental sustainability
    Countries Covered North America, Europe, APAC, South America, MEA

    Market Highlights

    Author

    Sejal Akre
    Senior Research Analyst

    She holds an experience of about 6+ years in market research and business consulting, working under the spectrum of information communication technology, telecommunications and semiconductor domains. aarti conceptualizes and implements a scalable business strategy and provides strategic leadership to the clients. her expertise lies in market estimation, competitive intelligence, pipeline analysis, customer assessment, etc.

    Leave a Comment

    Latest Comments

    John Doe
    john@example.com

    This is a great article! Really helped me understand the topic better.

    Posted on July 23, 2025, 10:15 AM
    Jane Smith
    jane@domain.com

    Thanks for sharing this. I’ve bookmarked it for later reference.

    Posted on July 22, 2025, 7:45 PM

    FAQs

    What regional market is projected to show rapid growth in the Autonomous Ships segment?

    The Asia Pacific region is projected to exhibit significant growth with a market size of 2.4 billion USD by 2035.

    1. Table of Contents
    2. Executive Summary
      1. Market Overview
      2. Key Findings
      3. Market Segmentation
      4. Competitive Landscape
      5. Challenges and Opportunities
      6. Future Outlook
    3. Market Introduction
      1. Definition
      2. Scope of the Study
        1. Research Objective
        2. Assumption
        3. Limitations
    4. Research Methodology
      1. Overview
      2. Data Mining
      3. Secondary Research
      4. Primary Research
        1. Primary Interviews and Information Gathering Process
        2. Breakdown of Primary Respondents
      5. Forecasting Model
      6. Market Size Estimation
        1. Bottom-up Approach
        2. Top-Down Approach
      7. Data Triangulation
      8. Validation
    5. MARKET DYNAMICS
      1. Overview
      2. Drivers
      3. Restraints
      4. Opportunities
    6. MARKET FACTOR ANALYSIS
      1. Value chain Analysis
      2. Porter's Five Forces Analysis
        1. Bargaining Power of Suppliers
        2. Bargaining Power of Buyers
        3. Threat of New Entrants
        4. Threat of Substitutes
        5. Intensity of Rivalry
      3. COVID-19 Impact Analysis
        1. Market Impact Analysis
        2. Regional Impact
        3. Opportunity and Threat Analysis
    7. AUTONOMOUS SHIPS MARKET, BY VESSEL TYPE (USD BILLION)
      1. Cargo Ships
      2. Tankers
      3. Passenger Ships
      4. Fishing Vessels
    8. AUTONOMOUS SHIPS MARKET, BY TECHNOLOGY (USD BILLION)
      1. Remote Controlled
      2. Fully Autonomous
      3. Semi-Autonomous
    9. AUTONOMOUS SHIPS MARKET, BY END USE (USD BILLION)
      1. Commercial Shipping
      2. Defence
      3. Research and Exploration
    10. AUTONOMOUS SHIPS MARKET, BY NAVIGATION SYSTEM (USD BILLION)
      1. GPS Based Systems
      2. Lidar Systems
      3. Radar Systems
    11. AUTONOMOUS SHIPS MARKET, BY REGIONAL (USD BILLION)
      1. North America
        1. US
        2. Canada
      2. Europe
        1. Germany
        2. UK
        3. France
        4. Russia
        5. Italy
        6. Spain
        7. Rest of Europe
      3. APAC
        1. China
        2. India
        3. Japan
        4. South Korea
        5. Malaysia
        6. Thailand
        7. Indonesia
        8. Rest of APAC
      4. South America
        1. Brazil
        2. Mexico
        3. Argentina
        4. Rest of South America
      5. MEA
        1. GCC Countries
        2. South Africa
        3. Rest of MEA
    12. Competitive Landscape
      1. Overview
      2. Competitive Analysis
      3. Market share Analysis
      4. Major Growth Strategy in the Autonomous Ships Market
      5. Competitive Benchmarking
      6. Leading Players in Terms of Number of Developments in the Autonomous Ships Market
      7. Key developments and growth strategies
        1. New Product Launch/Service Deployment
        2. Merger & Acquisitions
        3. Joint Ventures
      8. Major Players Financial Matrix
        1. Sales and Operating Income
        2. Major Players R&D Expenditure. 2023
    13. COMPANY PROFILES
      1. Nortek
        1. Financial Overview
        2. Products Offered
        3. Key Developments
        4. SWOT Analysis
        5. Key Strategies
      2. Caterpillar
        1. Financial Overview
        2. Products Offered
        3. Key Developments
        4. SWOT Analysis
        5. Key Strategies
      3. Fincantieri
        1. Financial Overview
        2. Products Offered
        3. Key Developments
        4. SWOT Analysis
        5. Key Strategies
      4. Orolia
        1. Financial Overview
        2. Products Offered
        3. Key Developments
        4. SWOT Analysis
        5. Key Strategies
      5. Oceanes
        1. Financial Overview
        2. Products Offered
        3. Key Developments
        4. SWOT Analysis
        5. Key Strategies
      6. Kongsberg Gruppen
        1. Financial Overview
        2. Products Offered
        3. Key Developments
        4. SWOT Analysis
        5. Key Strategies
      7. Sea Machines Robotics
        1. Financial Overview
        2. Products Offered
        3. Key Developments
        4. SWOT Analysis
        5. Key Strategies
      8. Hyundai Heavy Industries
        1. Financial Overview
        2. Products Offered
        3. Key Developments
        4. SWOT Analysis
        5. Key Strategies
      9. GE Marine
        1. Financial Overview
        2. Products Offered
        3. Key Developments
        4. SWOT Analysis
        5. Key Strategies
      10. Bae Systems
        1. Financial Overview
        2. Products Offered
        3. Key Developments
        4. SWOT Analysis
        5. Key Strategies
      11. Mitsubishi Heavy Industries
        1. Financial Overview
        2. Products Offered
        3. Key Developments
        4. SWOT Analysis
        5. Key Strategies
      12. RollsRoyce
        1. Financial Overview
        2. Products Offered
        3. Key Developments
        4. SWOT Analysis
        5. Key Strategies
      13. Naval Group
        1. Financial Overview
        2. Products Offered
        3. Key Developments
        4. SWOT Analysis
        5. Key Strategies
      14. Wärtsilä
        1. Financial Overview
        2. Products Offered
        3. Key Developments
        4. SWOT Analysis
        5. Key Strategies
      15. Thales Group
        1. Financial Overview
        2. Products Offered
        3. Key Developments
        4. SWOT Analysis
        5. Key Strategies
    14. APPENDIX
      1. References
      2. Related Reports
    15. List of Tables and Figures
      1. LIST OF TABLES
      2. TABLE 1. LIST OF ASSUMPTIONS
      3. TABLE 2. NORTH AMERICA AUTONOMOUS SHIPS MARKET SIZE ESTIMATES & FORECAST, BY VESSEL TYPE, 2019-2035 (USD BILLIONS)
      4. TABLE 3. NORTH AMERICA AUTONOMOUS SHIPS MARKET SIZE ESTIMATES & FORECAST, BY TECHNOLOGY, 2019-2035 (USD BILLIONS)
      5. TABLE 4. NORTH AMERICA AUTONOMOUS SHIPS MARKET SIZE ESTIMATES & FORECAST, BY END USE, 2019-2035 (USD BILLIONS)
      6. TABLE 5. NORTH AMERICA AUTONOMOUS SHIPS MARKET SIZE ESTIMATES & FORECAST, BY NAVIGATION SYSTEM, 2019-2035 (USD BILLIONS)
      7. TABLE 6. NORTH AMERICA AUTONOMOUS SHIPS MARKET SIZE ESTIMATES & FORECAST, BY REGIONAL, 2019-2035 (USD BILLIONS)
      8. TABLE 7. US AUTONOMOUS SHIPS MARKET SIZE ESTIMATES & FORECAST, BY VESSEL TYPE, 2019-2035 (USD BILLIONS)
      9. TABLE 8. US AUTONOMOUS SHIPS MARKET SIZE ESTIMATES & FORECAST, BY TECHNOLOGY, 2019-2035 (USD BILLIONS)
      10. TABLE 9. US AUTONOMOUS SHIPS MARKET SIZE ESTIMATES & FORECAST, BY END USE, 2019-2035 (USD BILLIONS)
      11. TABLE 10. US AUTONOMOUS SHIPS MARKET SIZE ESTIMATES & FORECAST, BY NAVIGATION SYSTEM, 2019-2035 (USD BILLIONS)
      12. TABLE 11. US AUTONOMOUS SHIPS MARKET SIZE ESTIMATES & FORECAST, BY REGIONAL, 2019-2035 (USD BILLIONS)
      13. TABLE 12. CANADA AUTONOMOUS SHIPS MARKET SIZE ESTIMATES & FORECAST, BY VESSEL TYPE, 2019-2035 (USD BILLIONS)
      14. TABLE 13. CANADA AUTONOMOUS SHIPS MARKET SIZE ESTIMATES & FORECAST, BY TECHNOLOGY, 2019-2035 (USD BILLIONS)
      15. TABLE 14. CANADA AUTONOMOUS SHIPS MARKET SIZE ESTIMATES & FORECAST, BY END USE, 2019-2035 (USD BILLIONS)
      16. TABLE 15. CANADA AUTONOMOUS SHIPS MARKET SIZE ESTIMATES & FORECAST, BY NAVIGATION SYSTEM, 2019-2035 (USD BILLIONS)
      17. TABLE 16. CANADA AUTONOMOUS SHIPS MARKET SIZE ESTIMATES & FORECAST, BY REGIONAL, 2019-2035 (USD BILLIONS)
      18. TABLE 17. EUROPE AUTONOMOUS SHIPS MARKET SIZE ESTIMATES & FORECAST, BY VESSEL TYPE, 2019-2035 (USD BILLIONS)
      19. TABLE 18. EUROPE AUTONOMOUS SHIPS MARKET SIZE ESTIMATES & FORECAST, BY TECHNOLOGY, 2019-2035 (USD BILLIONS)
      20. TABLE 19. EUROPE AUTONOMOUS SHIPS MARKET SIZE ESTIMATES & FORECAST, BY END USE, 2019-2035 (USD BILLIONS)
      21. TABLE 20. EUROPE AUTONOMOUS SHIPS MARKET SIZE ESTIMATES & FORECAST, BY NAVIGATION SYSTEM, 2019-2035 (USD BILLIONS)
      22. TABLE 21. EUROPE AUTONOMOUS SHIPS MARKET SIZE ESTIMATES & FORECAST, BY REGIONAL, 2019-2035 (USD BILLIONS)
      23. TABLE 22. GERMANY AUTONOMOUS SHIPS MARKET SIZE ESTIMATES & FORECAST, BY VESSEL TYPE, 2019-2035 (USD BILLIONS)
      24. TABLE 23. GERMANY AUTONOMOUS SHIPS MARKET SIZE ESTIMATES & FORECAST, BY TECHNOLOGY, 2019-2035 (USD BILLIONS)
      25. TABLE 24. GERMANY AUTONOMOUS SHIPS MARKET SIZE ESTIMATES & FORECAST, BY END USE, 2019-2035 (USD BILLIONS)
      26. TABLE 25. GERMANY AUTONOMOUS SHIPS MARKET SIZE ESTIMATES & FORECAST, BY NAVIGATION SYSTEM, 2019-2035 (USD BILLIONS)
      27. TABLE 26. GERMANY AUTONOMOUS SHIPS MARKET SIZE ESTIMATES & FORECAST, BY REGIONAL, 2019-2035 (USD BILLIONS)
      28. TABLE 27. UK AUTONOMOUS SHIPS MARKET SIZE ESTIMATES & FORECAST, BY VESSEL TYPE, 2019-2035 (USD BILLIONS)
      29. TABLE 28. UK AUTONOMOUS SHIPS MARKET SIZE ESTIMATES & FORECAST, BY TECHNOLOGY, 2019-2035 (USD BILLIONS)
      30. TABLE 29. UK AUTONOMOUS SHIPS MARKET SIZE ESTIMATES & FORECAST, BY END USE, 2019-2035 (USD BILLIONS)
      31. TABLE 30. UK AUTONOMOUS SHIPS MARKET SIZE ESTIMATES & FORECAST, BY NAVIGATION SYSTEM, 2019-2035 (USD BILLIONS)
      32. TABLE 31. UK AUTONOMOUS SHIPS MARKET SIZE ESTIMATES & FORECAST, BY REGIONAL, 2019-2035 (USD BILLIONS)
      33. TABLE 32. FRANCE AUTONOMOUS SHIPS MARKET SIZE ESTIMATES & FORECAST, BY VESSEL TYPE, 2019-2035 (USD BILLIONS)
      34. TABLE 33. FRANCE AUTONOMOUS SHIPS MARKET SIZE ESTIMATES & FORECAST, BY TECHNOLOGY, 2019-2035 (USD BILLIONS)
      35. TABLE 34. FRANCE AUTONOMOUS SHIPS MARKET SIZE ESTIMATES & FORECAST, BY END USE, 2019-2035 (USD BILLIONS)
      36. TABLE 35. FRANCE AUTONOMOUS SHIPS MARKET SIZE ESTIMATES & FORECAST, BY NAVIGATION SYSTEM, 2019-2035 (USD BILLIONS)
      37. TABLE 36. FRANCE AUTONOMOUS SHIPS MARKET SIZE ESTIMATES & FORECAST, BY REGIONAL, 2019-2035 (USD BILLIONS)
      38. TABLE 37. RUSSIA AUTONOMOUS SHIPS MARKET SIZE ESTIMATES & FORECAST, BY VESSEL TYPE, 2019-2035 (USD BILLIONS)
      39. TABLE 38. RUSSIA AUTONOMOUS SHIPS MARKET SIZE ESTIMATES & FORECAST, BY TECHNOLOGY, 2019-2035 (USD BILLIONS)
      40. TABLE 39. RUSSIA AUTONOMOUS SHIPS MARKET SIZE ESTIMATES & FORECAST, BY END USE, 2019-2035 (USD BILLIONS)
      41. TABLE 40. RUSSIA AUTONOMOUS SHIPS MARKET SIZE ESTIMATES & FORECAST, BY NAVIGATION SYSTEM, 2019-2035 (USD BILLIONS)
      42. TABLE 41. RUSSIA AUTONOMOUS SHIPS MARKET SIZE ESTIMATES & FORECAST, BY REGIONAL, 2019-2035 (USD BILLIONS)
      43. TABLE 42. ITALY AUTONOMOUS SHIPS MARKET SIZE ESTIMATES & FORECAST, BY VESSEL TYPE, 2019-2035 (USD BILLIONS)
      44. TABLE 43. ITALY AUTONOMOUS SHIPS MARKET SIZE ESTIMATES & FORECAST, BY TECHNOLOGY, 2019-2035 (USD BILLIONS)
      45. TABLE 44. ITALY AUTONOMOUS SHIPS MARKET SIZE ESTIMATES & FORECAST, BY END USE, 2019-2035 (USD BILLIONS)
      46. TABLE 45. ITALY AUTONOMOUS SHIPS MARKET SIZE ESTIMATES & FORECAST, BY NAVIGATION SYSTEM, 2019-2035 (USD BILLIONS)
      47. TABLE 46. ITALY AUTONOMOUS SHIPS MARKET SIZE ESTIMATES & FORECAST, BY REGIONAL, 2019-2035 (USD BILLIONS)
      48. TABLE 47. SPAIN AUTONOMOUS SHIPS MARKET SIZE ESTIMATES & FORECAST, BY VESSEL TYPE, 2019-2035 (USD BILLIONS)
      49. TABLE 48. SPAIN AUTONOMOUS SHIPS MARKET SIZE ESTIMATES & FORECAST, BY TECHNOLOGY, 2019-2035 (USD BILLIONS)
      50. TABLE 49. SPAIN AUTONOMOUS SHIPS MARKET SIZE ESTIMATES & FORECAST, BY END USE, 2019-2035 (USD BILLIONS)
      51. TABLE 50. SPAIN AUTONOMOUS SHIPS MARKET SIZE ESTIMATES & FORECAST, BY NAVIGATION SYSTEM, 2019-2035 (USD BILLIONS)
      52. TABLE 51. SPAIN AUTONOMOUS SHIPS MARKET SIZE ESTIMATES & FORECAST, BY REGIONAL, 2019-2035 (USD BILLIONS)
      53. TABLE 52. REST OF EUROPE AUTONOMOUS SHIPS MARKET SIZE ESTIMATES & FORECAST, BY VESSEL TYPE, 2019-2035 (USD BILLIONS)
      54. TABLE 53. REST OF EUROPE AUTONOMOUS SHIPS MARKET SIZE ESTIMATES & FORECAST, BY TECHNOLOGY, 2019-2035 (USD BILLIONS)
      55. TABLE 54. REST OF EUROPE AUTONOMOUS SHIPS MARKET SIZE ESTIMATES & FORECAST, BY END USE, 2019-2035 (USD BILLIONS)
      56. TABLE 55. REST OF EUROPE AUTONOMOUS SHIPS MARKET SIZE ESTIMATES & FORECAST, BY NAVIGATION SYSTEM, 2019-2035 (USD BILLIONS)
      57. TABLE 56. REST OF EUROPE AUTONOMOUS SHIPS MARKET SIZE ESTIMATES & FORECAST, BY REGIONAL, 2019-2035 (USD BILLIONS)
      58. TABLE 57. APAC AUTONOMOUS SHIPS MARKET SIZE ESTIMATES & FORECAST, BY VESSEL TYPE, 2019-2035 (USD BILLIONS)
      59. TABLE 58. APAC AUTONOMOUS SHIPS MARKET SIZE ESTIMATES & FORECAST, BY TECHNOLOGY, 2019-2035 (USD BILLIONS)
      60. TABLE 59. APAC AUTONOMOUS SHIPS MARKET SIZE ESTIMATES & FORECAST, BY END USE, 2019-2035 (USD BILLIONS)
      61. TABLE 60. APAC AUTONOMOUS SHIPS MARKET SIZE ESTIMATES & FORECAST, BY NAVIGATION SYSTEM, 2019-2035 (USD BILLIONS)
      62. TABLE 61. APAC AUTONOMOUS SHIPS MARKET SIZE ESTIMATES & FORECAST, BY REGIONAL, 2019-2035 (USD BILLIONS)
      63. TABLE 62. CHINA AUTONOMOUS SHIPS MARKET SIZE ESTIMATES & FORECAST, BY VESSEL TYPE, 2019-2035 (USD BILLIONS)
      64. TABLE 63. CHINA AUTONOMOUS SHIPS MARKET SIZE ESTIMATES & FORECAST, BY TECHNOLOGY, 2019-2035 (USD BILLIONS)
      65. TABLE 64. CHINA AUTONOMOUS SHIPS MARKET SIZE ESTIMATES & FORECAST, BY END USE, 2019-2035 (USD BILLIONS)
      66. TABLE 65. CHINA AUTONOMOUS SHIPS MARKET SIZE ESTIMATES & FORECAST, BY NAVIGATION SYSTEM, 2019-2035 (USD BILLIONS)
      67. TABLE 66. CHINA AUTONOMOUS SHIPS MARKET SIZE ESTIMATES & FORECAST, BY REGIONAL, 2019-2035 (USD BILLIONS)
      68. TABLE 67. INDIA AUTONOMOUS SHIPS MARKET SIZE ESTIMATES & FORECAST, BY VESSEL TYPE, 2019-2035 (USD BILLIONS)
      69. TABLE 68. INDIA AUTONOMOUS SHIPS MARKET SIZE ESTIMATES & FORECAST, BY TECHNOLOGY, 2019-2035 (USD BILLIONS)
      70. TABLE 69. INDIA AUTONOMOUS SHIPS MARKET SIZE ESTIMATES & FORECAST, BY END USE, 2019-2035 (USD BILLIONS)
      71. TABLE 70. INDIA AUTONOMOUS SHIPS MARKET SIZE ESTIMATES & FORECAST, BY NAVIGATION SYSTEM, 2019-2035 (USD BILLIONS)
      72. TABLE 71. INDIA AUTONOMOUS SHIPS MARKET SIZE ESTIMATES & FORECAST, BY REGIONAL, 2019-2035 (USD BILLIONS)
      73. TABLE 72. JAPAN AUTONOMOUS SHIPS MARKET SIZE ESTIMATES & FORECAST, BY VESSEL TYPE, 2019-2035 (USD BILLIONS)
      74. TABLE 73. JAPAN AUTONOMOUS SHIPS MARKET SIZE ESTIMATES & FORECAST, BY TECHNOLOGY, 2019-2035 (USD BILLIONS)
      75. TABLE 74. JAPAN AUTONOMOUS SHIPS MARKET SIZE ESTIMATES & FORECAST, BY END USE, 2019-2035 (USD BILLIONS)
      76. TABLE 75. JAPAN AUTONOMOUS SHIPS MARKET SIZE ESTIMATES & FORECAST, BY NAVIGATION SYSTEM, 2019-2035 (USD BILLIONS)
      77. TABLE 76. JAPAN AUTONOMOUS SHIPS MARKET SIZE ESTIMATES & FORECAST, BY REGIONAL, 2019-2035 (USD BILLIONS)
      78. TABLE 77. SOUTH KOREA AUTONOMOUS SHIPS MARKET SIZE ESTIMATES & FORECAST, BY VESSEL TYPE, 2019-2035 (USD BILLIONS)
      79. TABLE 78. SOUTH KOREA AUTONOMOUS SHIPS MARKET SIZE ESTIMATES & FORECAST, BY TECHNOLOGY, 2019-2035 (USD BILLIONS)
      80. TABLE 79. SOUTH KOREA AUTONOMOUS SHIPS MARKET SIZE ESTIMATES & FORECAST, BY END USE, 2019-2035 (USD BILLIONS)
      81. TABLE 80. SOUTH KOREA AUTONOMOUS SHIPS MARKET SIZE ESTIMATES & FORECAST, BY NAVIGATION SYSTEM, 2019-2035 (USD BILLIONS)
      82. TABLE 81. SOUTH KOREA AUTONOMOUS SHIPS MARKET SIZE ESTIMATES & FORECAST, BY REGIONAL, 2019-2035 (USD BILLIONS)
      83. TABLE 82. MALAYSIA AUTONOMOUS SHIPS MARKET SIZE ESTIMATES & FORECAST, BY VESSEL TYPE, 2019-2035 (USD BILLIONS)
      84. TABLE 83. MALAYSIA AUTONOMOUS SHIPS MARKET SIZE ESTIMATES & FORECAST, BY TECHNOLOGY, 2019-2035 (USD BILLIONS)
      85. TABLE 84. MALAYSIA AUTONOMOUS SHIPS MARKET SIZE ESTIMATES & FORECAST, BY END USE, 2019-2035 (USD BILLIONS)
      86. TABLE 85. MALAYSIA AUTONOMOUS SHIPS MARKET SIZE ESTIMATES & FORECAST, BY NAVIGATION SYSTEM, 2019-2035 (USD BILLIONS)
      87. TABLE 86. MALAYSIA AUTONOMOUS SHIPS MARKET SIZE ESTIMATES & FORECAST, BY REGIONAL, 2019-2035 (USD BILLIONS)
      88. TABLE 87. THAILAND AUTONOMOUS SHIPS MARKET SIZE ESTIMATES & FORECAST, BY VESSEL TYPE, 2019-2035 (USD BILLIONS)
      89. TABLE 88. THAILAND AUTONOMOUS SHIPS MARKET SIZE ESTIMATES & FORECAST, BY TECHNOLOGY, 2019-2035 (USD BILLIONS)
      90. TABLE 89. THAILAND AUTONOMOUS SHIPS MARKET SIZE ESTIMATES & FORECAST, BY END USE, 2019-2035 (USD BILLIONS)
      91. TABLE 90. THAILAND AUTONOMOUS SHIPS MARKET SIZE ESTIMATES & FORECAST, BY NAVIGATION SYSTEM, 2019-2035 (USD BILLIONS)
      92. TABLE 91. THAILAND AUTONOMOUS SHIPS MARKET SIZE ESTIMATES & FORECAST, BY REGIONAL, 2019-2035 (USD BILLIONS)
      93. TABLE 92. INDONESIA AUTONOMOUS SHIPS MARKET SIZE ESTIMATES & FORECAST, BY VESSEL TYPE, 2019-2035 (USD BILLIONS)
      94. TABLE 93. INDONESIA AUTONOMOUS SHIPS MARKET SIZE ESTIMATES & FORECAST, BY TECHNOLOGY, 2019-2035 (USD BILLIONS)
      95. TABLE 94. INDONESIA AUTONOMOUS SHIPS MARKET SIZE ESTIMATES & FORECAST, BY END USE, 2019-2035 (USD BILLIONS)
      96. TABLE 95. INDONESIA AUTONOMOUS SHIPS MARKET SIZE ESTIMATES & FORECAST, BY NAVIGATION SYSTEM, 2019-2035 (USD BILLIONS)
      97. TABLE 96. INDONESIA AUTONOMOUS SHIPS MARKET SIZE ESTIMATES & FORECAST, BY REGIONAL, 2019-2035 (USD BILLIONS)
      98. TABLE 97. REST OF APAC AUTONOMOUS SHIPS MARKET SIZE ESTIMATES & FORECAST, BY VESSEL TYPE, 2019-2035 (USD BILLIONS)
      99. TABLE 98. REST OF APAC AUTONOMOUS SHIPS MARKET SIZE ESTIMATES & FORECAST, BY TECHNOLOGY, 2019-2035 (USD BILLIONS)
      100. TABLE 99. REST OF APAC AUTONOMOUS SHIPS MARKET SIZE ESTIMATES & FORECAST, BY END USE, 2019-2035 (USD BILLIONS)
      101. TABLE 100. REST OF APAC AUTONOMOUS SHIPS MARKET SIZE ESTIMATES & FORECAST, BY NAVIGATION SYSTEM, 2019-2035 (USD BILLIONS)
      102. TABLE 101. REST OF APAC AUTONOMOUS SHIPS MARKET SIZE ESTIMATES & FORECAST, BY REGIONAL, 2019-2035 (USD BILLIONS)
      103. TABLE 102. SOUTH AMERICA AUTONOMOUS SHIPS MARKET SIZE ESTIMATES & FORECAST, BY VESSEL TYPE, 2019-2035 (USD BILLIONS)
      104. TABLE 103. SOUTH AMERICA AUTONOMOUS SHIPS MARKET SIZE ESTIMATES & FORECAST, BY TECHNOLOGY, 2019-2035 (USD BILLIONS)
      105. TABLE 104. SOUTH AMERICA AUTONOMOUS SHIPS MARKET SIZE ESTIMATES & FORECAST, BY END USE, 2019-2035 (USD BILLIONS)
      106. TABLE 105. SOUTH AMERICA AUTONOMOUS SHIPS MARKET SIZE ESTIMATES & FORECAST, BY NAVIGATION SYSTEM, 2019-2035 (USD BILLIONS)
      107. TABLE 106. SOUTH AMERICA AUTONOMOUS SHIPS MARKET SIZE ESTIMATES & FORECAST, BY REGIONAL, 2019-2035 (USD BILLIONS)
      108. TABLE 107. BRAZIL AUTONOMOUS SHIPS MARKET SIZE ESTIMATES & FORECAST, BY VESSEL TYPE, 2019-2035 (USD BILLIONS)
      109. TABLE 108. BRAZIL AUTONOMOUS SHIPS MARKET SIZE ESTIMATES & FORECAST, BY TECHNOLOGY, 2019-2035 (USD BILLIONS)
      110. TABLE 109. BRAZIL AUTONOMOUS SHIPS MARKET SIZE ESTIMATES & FORECAST, BY END USE, 2019-2035 (USD BILLIONS)
      111. TABLE 110. BRAZIL AUTONOMOUS SHIPS MARKET SIZE ESTIMATES & FORECAST, BY NAVIGATION SYSTEM, 2019-2035 (USD BILLIONS)
      112. TABLE 111. BRAZIL AUTONOMOUS SHIPS MARKET SIZE ESTIMATES & FORECAST, BY REGIONAL, 2019-2035 (USD BILLIONS)
      113. TABLE 112. MEXICO AUTONOMOUS SHIPS MARKET SIZE ESTIMATES & FORECAST, BY VESSEL TYPE, 2019-2035 (USD BILLIONS)
      114. TABLE 113. MEXICO AUTONOMOUS SHIPS MARKET SIZE ESTIMATES & FORECAST, BY TECHNOLOGY, 2019-2035 (USD BILLIONS)
      115. TABLE 114. MEXICO AUTONOMOUS SHIPS MARKET SIZE ESTIMATES & FORECAST, BY END USE, 2019-2035 (USD BILLIONS)
      116. TABLE 115. MEXICO AUTONOMOUS SHIPS MARKET SIZE ESTIMATES & FORECAST, BY NAVIGATION SYSTEM, 2019-2035 (USD BILLIONS)
      117. TABLE 116. MEXICO AUTONOMOUS SHIPS MARKET SIZE ESTIMATES & FORECAST, BY REGIONAL, 2019-2035 (USD BILLIONS)
      118. TABLE 117. ARGENTINA AUTONOMOUS SHIPS MARKET SIZE ESTIMATES & FORECAST, BY VESSEL TYPE, 2019-2035 (USD BILLIONS)
      119. TABLE 118. ARGENTINA AUTONOMOUS SHIPS MARKET SIZE ESTIMATES & FORECAST, BY TECHNOLOGY, 2019-2035 (USD BILLIONS)
      120. TABLE 119. ARGENTINA AUTONOMOUS SHIPS MARKET SIZE ESTIMATES & FORECAST, BY END USE, 2019-2035 (USD BILLIONS)
      121. TABLE 120. ARGENTINA AUTONOMOUS SHIPS MARKET SIZE ESTIMATES & FORECAST, BY NAVIGATION SYSTEM, 2019-2035 (USD BILLIONS)
      122. TABLE 121. ARGENTINA AUTONOMOUS SHIPS MARKET SIZE ESTIMATES & FORECAST, BY REGIONAL, 2019-2035 (USD BILLIONS)
      123. TABLE 122. REST OF SOUTH AMERICA AUTONOMOUS SHIPS MARKET SIZE ESTIMATES & FORECAST, BY VESSEL TYPE, 2019-2035 (USD BILLIONS)
      124. TABLE 123. REST OF SOUTH AMERICA AUTONOMOUS SHIPS MARKET SIZE ESTIMATES & FORECAST, BY TECHNOLOGY, 2019-2035 (USD BILLIONS)
      125. TABLE 124. REST OF SOUTH AMERICA AUTONOMOUS SHIPS MARKET SIZE ESTIMATES & FORECAST, BY END USE, 2019-2035 (USD BILLIONS)
      126. TABLE 125. REST OF SOUTH AMERICA AUTONOMOUS SHIPS MARKET SIZE ESTIMATES & FORECAST, BY NAVIGATION SYSTEM, 2019-2035 (USD BILLIONS)
      127. TABLE 126. REST OF SOUTH AMERICA AUTONOMOUS SHIPS MARKET SIZE ESTIMATES & FORECAST, BY REGIONAL, 2019-2035 (USD BILLIONS)
      128. TABLE 127. MEA AUTONOMOUS SHIPS MARKET SIZE ESTIMATES & FORECAST, BY VESSEL TYPE, 2019-2035 (USD BILLIONS)
      129. TABLE 128. MEA AUTONOMOUS SHIPS MARKET SIZE ESTIMATES & FORECAST, BY TECHNOLOGY, 2019-2035 (USD BILLIONS)
      130. TABLE 129. MEA AUTONOMOUS SHIPS MARKET SIZE ESTIMATES & FORECAST, BY END USE, 2019-2035 (USD BILLIONS)
      131. TABLE 130. MEA AUTONOMOUS SHIPS MARKET SIZE ESTIMATES & FORECAST, BY NAVIGATION SYSTEM, 2019-2035 (USD BILLIONS)
      132. TABLE 131. MEA AUTONOMOUS SHIPS MARKET SIZE ESTIMATES & FORECAST, BY REGIONAL, 2019-2035 (USD BILLIONS)
      133. TABLE 132. GCC COUNTRIES AUTONOMOUS SHIPS MARKET SIZE ESTIMATES & FORECAST, BY VESSEL TYPE, 2019-2035 (USD BILLIONS)
      134. TABLE 133. GCC COUNTRIES AUTONOMOUS SHIPS MARKET SIZE ESTIMATES & FORECAST, BY TECHNOLOGY, 2019-2035 (USD BILLIONS)
      135. TABLE 134. GCC COUNTRIES AUTONOMOUS SHIPS MARKET SIZE ESTIMATES & FORECAST, BY END USE, 2019-2035 (USD BILLIONS)
      136. TABLE 135. GCC COUNTRIES AUTONOMOUS SHIPS MARKET SIZE ESTIMATES & FORECAST, BY NAVIGATION SYSTEM, 2019-2035 (USD BILLIONS)
      137. TABLE 136. GCC COUNTRIES AUTONOMOUS SHIPS MARKET SIZE ESTIMATES & FORECAST, BY REGIONAL, 2019-2035 (USD BILLIONS)
      138. TABLE 137. SOUTH AFRICA AUTONOMOUS SHIPS MARKET SIZE ESTIMATES & FORECAST, BY VESSEL TYPE, 2019-2035 (USD BILLIONS)
      139. TABLE 138. SOUTH AFRICA AUTONOMOUS SHIPS MARKET SIZE ESTIMATES & FORECAST, BY TECHNOLOGY, 2019-2035 (USD BILLIONS)
      140. TABLE 139. SOUTH AFRICA AUTONOMOUS SHIPS MARKET SIZE ESTIMATES & FORECAST, BY END USE, 2019-2035 (USD BILLIONS)
      141. TABLE 140. SOUTH AFRICA AUTONOMOUS SHIPS MARKET SIZE ESTIMATES & FORECAST, BY NAVIGATION SYSTEM, 2019-2035 (USD BILLIONS)
      142. TABLE 141. SOUTH AFRICA AUTONOMOUS SHIPS MARKET SIZE ESTIMATES & FORECAST, BY REGIONAL, 2019-2035 (USD BILLIONS)
      143. TABLE 142. REST OF MEA AUTONOMOUS SHIPS MARKET SIZE ESTIMATES & FORECAST, BY VESSEL TYPE, 2019-2035 (USD BILLIONS)
      144. TABLE 143. REST OF MEA AUTONOMOUS SHIPS MARKET SIZE ESTIMATES & FORECAST, BY TECHNOLOGY, 2019-2035 (USD BILLIONS)
      145. TABLE 144. REST OF MEA AUTONOMOUS SHIPS MARKET SIZE ESTIMATES & FORECAST, BY END USE, 2019-2035 (USD BILLIONS)
      146. TABLE 145. REST OF MEA AUTONOMOUS SHIPS MARKET SIZE ESTIMATES & FORECAST, BY NAVIGATION SYSTEM, 2019-2035 (USD BILLIONS)
      147. TABLE 146. REST OF MEA AUTONOMOUS SHIPS MARKET SIZE ESTIMATES & FORECAST, BY REGIONAL, 2019-2035 (USD BILLIONS)
      148. TABLE 147. PRODUCT LAUNCH/PRODUCT DEVELOPMENT/APPROVAL
      149. TABLE 148. ACQUISITION/PARTNERSHIP   LIST OF FIGURES
      150. FIGURE 1. MARKET SYNOPSIS
      151. FIGURE 2. NORTH AMERICA AUTONOMOUS SHIPS MARKET ANALYSIS
      152. FIGURE 3. US AUTONOMOUS SHIPS MARKET ANALYSIS BY VESSEL TYPE
      153. FIGURE 4. US AUTONOMOUS SHIPS MARKET ANALYSIS BY TECHNOLOGY
      154. FIGURE 5. US AUTONOMOUS SHIPS MARKET ANALYSIS BY END USE
      155. FIGURE 6. US AUTONOMOUS SHIPS MARKET ANALYSIS BY NAVIGATION SYSTEM
      156. FIGURE 7. US AUTONOMOUS SHIPS MARKET ANALYSIS BY REGIONAL
      157. FIGURE 8. CANADA AUTONOMOUS SHIPS MARKET ANALYSIS BY VESSEL TYPE
      158. FIGURE 9. CANADA AUTONOMOUS SHIPS MARKET ANALYSIS BY TECHNOLOGY
      159. FIGURE 10. CANADA AUTONOMOUS SHIPS MARKET ANALYSIS BY END USE
      160. FIGURE 11. CANADA AUTONOMOUS SHIPS MARKET ANALYSIS BY NAVIGATION SYSTEM
      161. FIGURE 12. CANADA AUTONOMOUS SHIPS MARKET ANALYSIS BY REGIONAL
      162. FIGURE 13. EUROPE AUTONOMOUS SHIPS MARKET ANALYSIS
      163. FIGURE 14. GERMANY AUTONOMOUS SHIPS MARKET ANALYSIS BY VESSEL TYPE
      164. FIGURE 15. GERMANY AUTONOMOUS SHIPS MARKET ANALYSIS BY TECHNOLOGY
      165. FIGURE 16. GERMANY AUTONOMOUS SHIPS MARKET ANALYSIS BY END USE
      166. FIGURE 17. GERMANY AUTONOMOUS SHIPS MARKET ANALYSIS BY NAVIGATION SYSTEM
      167. FIGURE 18. GERMANY AUTONOMOUS SHIPS MARKET ANALYSIS BY REGIONAL
      168. FIGURE 19. UK AUTONOMOUS SHIPS MARKET ANALYSIS BY VESSEL TYPE
      169. FIGURE 20. UK AUTONOMOUS SHIPS MARKET ANALYSIS BY TECHNOLOGY
      170. FIGURE 21. UK AUTONOMOUS SHIPS MARKET ANALYSIS BY END USE
      171. FIGURE 22. UK AUTONOMOUS SHIPS MARKET ANALYSIS BY NAVIGATION SYSTEM
      172. FIGURE 23. UK AUTONOMOUS SHIPS MARKET ANALYSIS BY REGIONAL
      173. FIGURE 24. FRANCE AUTONOMOUS SHIPS MARKET ANALYSIS BY VESSEL TYPE
      174. FIGURE 25. FRANCE AUTONOMOUS SHIPS MARKET ANALYSIS BY TECHNOLOGY
      175. FIGURE 26. FRANCE AUTONOMOUS SHIPS MARKET ANALYSIS BY END USE
      176. FIGURE 27. FRANCE AUTONOMOUS SHIPS MARKET ANALYSIS BY NAVIGATION SYSTEM
      177. FIGURE 28. FRANCE AUTONOMOUS SHIPS MARKET ANALYSIS BY REGIONAL
      178. FIGURE 29. RUSSIA AUTONOMOUS SHIPS MARKET ANALYSIS BY VESSEL TYPE
      179. FIGURE 30. RUSSIA AUTONOMOUS SHIPS MARKET ANALYSIS BY TECHNOLOGY
      180. FIGURE 31. RUSSIA AUTONOMOUS SHIPS MARKET ANALYSIS BY END USE
      181. FIGURE 32. RUSSIA AUTONOMOUS SHIPS MARKET ANALYSIS BY NAVIGATION SYSTEM
      182. FIGURE 33. RUSSIA AUTONOMOUS SHIPS MARKET ANALYSIS BY REGIONAL
      183. FIGURE 34. ITALY AUTONOMOUS SHIPS MARKET ANALYSIS BY VESSEL TYPE
      184. FIGURE 35. ITALY AUTONOMOUS SHIPS MARKET ANALYSIS BY TECHNOLOGY
      185. FIGURE 36. ITALY AUTONOMOUS SHIPS MARKET ANALYSIS BY END USE
      186. FIGURE 37. ITALY AUTONOMOUS SHIPS MARKET ANALYSIS BY NAVIGATION SYSTEM
      187. FIGURE 38. ITALY AUTONOMOUS SHIPS MARKET ANALYSIS BY REGIONAL
      188. FIGURE 39. SPAIN AUTONOMOUS SHIPS MARKET ANALYSIS BY VESSEL TYPE
      189. FIGURE 40. SPAIN AUTONOMOUS SHIPS MARKET ANALYSIS BY TECHNOLOGY
      190. FIGURE 41. SPAIN AUTONOMOUS SHIPS MARKET ANALYSIS BY END USE
      191. FIGURE 42. SPAIN AUTONOMOUS SHIPS MARKET ANALYSIS BY NAVIGATION SYSTEM
      192. FIGURE 43. SPAIN AUTONOMOUS SHIPS MARKET ANALYSIS BY REGIONAL
      193. FIGURE 44. REST OF EUROPE AUTONOMOUS SHIPS MARKET ANALYSIS BY VESSEL TYPE
      194. FIGURE 45. REST OF EUROPE AUTONOMOUS SHIPS MARKET ANALYSIS BY TECHNOLOGY
      195. FIGURE 46. REST OF EUROPE AUTONOMOUS SHIPS MARKET ANALYSIS BY END USE
      196. FIGURE 47. REST OF EUROPE AUTONOMOUS SHIPS MARKET ANALYSIS BY NAVIGATION SYSTEM
      197. FIGURE 48. REST OF EUROPE AUTONOMOUS SHIPS MARKET ANALYSIS BY REGIONAL
      198. FIGURE 49. APAC AUTONOMOUS SHIPS MARKET ANALYSIS
      199. FIGURE 50. CHINA AUTONOMOUS SHIPS MARKET ANALYSIS BY VESSEL TYPE
      200. FIGURE 51. CHINA AUTONOMOUS SHIPS MARKET ANALYSIS BY TECHNOLOGY
      201. FIGURE 52. CHINA AUTONOMOUS SHIPS MARKET ANALYSIS BY END USE
      202. FIGURE 53. CHINA AUTONOMOUS SHIPS MARKET ANALYSIS BY NAVIGATION SYSTEM
      203. FIGURE 54. CHINA AUTONOMOUS SHIPS MARKET ANALYSIS BY REGIONAL
      204. FIGURE 55. INDIA AUTONOMOUS SHIPS MARKET ANALYSIS BY VESSEL TYPE
      205. FIGURE 56. INDIA AUTONOMOUS SHIPS MARKET ANALYSIS BY TECHNOLOGY
      206. FIGURE 57. INDIA AUTONOMOUS SHIPS MARKET ANALYSIS BY END USE
      207. FIGURE 58. INDIA AUTONOMOUS SHIPS MARKET ANALYSIS BY NAVIGATION SYSTEM
      208. FIGURE 59. INDIA AUTONOMOUS SHIPS MARKET ANALYSIS BY REGIONAL
      209. FIGURE 60. JAPAN AUTONOMOUS SHIPS MARKET ANALYSIS BY VESSEL TYPE
      210. FIGURE 61. JAPAN AUTONOMOUS SHIPS MARKET ANALYSIS BY TECHNOLOGY
      211. FIGURE 62. JAPAN AUTONOMOUS SHIPS MARKET ANALYSIS BY END USE
      212. FIGURE 63. JAPAN AUTONOMOUS SHIPS MARKET ANALYSIS BY NAVIGATION SYSTEM
      213. FIGURE 64. JAPAN AUTONOMOUS SHIPS MARKET ANALYSIS BY REGIONAL
      214. FIGURE 65. SOUTH KOREA AUTONOMOUS SHIPS MARKET ANALYSIS BY VESSEL TYPE
      215. FIGURE 66. SOUTH KOREA AUTONOMOUS SHIPS MARKET ANALYSIS BY TECHNOLOGY
      216. FIGURE 67. SOUTH KOREA AUTONOMOUS SHIPS MARKET ANALYSIS BY END USE
      217. FIGURE 68. SOUTH KOREA AUTONOMOUS SHIPS MARKET ANALYSIS BY NAVIGATION SYSTEM
      218. FIGURE 69. SOUTH KOREA AUTONOMOUS SHIPS MARKET ANALYSIS BY REGIONAL
      219. FIGURE 70. MALAYSIA AUTONOMOUS SHIPS MARKET ANALYSIS BY VESSEL TYPE
      220. FIGURE 71. MALAYSIA AUTONOMOUS SHIPS MARKET ANALYSIS BY TECHNOLOGY
      221. FIGURE 72. MALAYSIA AUTONOMOUS SHIPS MARKET ANALYSIS BY END USE
      222. FIGURE 73. MALAYSIA AUTONOMOUS SHIPS MARKET ANALYSIS BY NAVIGATION SYSTEM
      223. FIGURE 74. MALAYSIA AUTONOMOUS SHIPS MARKET ANALYSIS BY REGIONAL
      224. FIGURE 75. THAILAND AUTONOMOUS SHIPS MARKET ANALYSIS BY VESSEL TYPE
      225. FIGURE 76. THAILAND AUTONOMOUS SHIPS MARKET ANALYSIS BY TECHNOLOGY
      226. FIGURE 77. THAILAND AUTONOMOUS SHIPS MARKET ANALYSIS BY END USE
      227. FIGURE 78. THAILAND AUTONOMOUS SHIPS MARKET ANALYSIS BY NAVIGATION SYSTEM
      228. FIGURE 79. THAILAND AUTONOMOUS SHIPS MARKET ANALYSIS BY REGIONAL
      229. FIGURE 80. INDONESIA AUTONOMOUS SHIPS MARKET ANALYSIS BY VESSEL TYPE
      230. FIGURE 81. INDONESIA AUTONOMOUS SHIPS MARKET ANALYSIS BY TECHNOLOGY
      231. FIGURE 82. INDONESIA AUTONOMOUS SHIPS MARKET ANALYSIS BY END USE
      232. FIGURE 83. INDONESIA AUTONOMOUS SHIPS MARKET ANALYSIS BY NAVIGATION SYSTEM
      233. FIGURE 84. INDONESIA AUTONOMOUS SHIPS MARKET ANALYSIS BY REGIONAL
      234. FIGURE 85. REST OF APAC AUTONOMOUS SHIPS MARKET ANALYSIS BY VESSEL TYPE
      235. FIGURE 86. REST OF APAC AUTONOMOUS SHIPS MARKET ANALYSIS BY TECHNOLOGY
      236. FIGURE 87. REST OF APAC AUTONOMOUS SHIPS MARKET ANALYSIS BY END USE
      237. FIGURE 88. REST OF APAC AUTONOMOUS SHIPS MARKET ANALYSIS BY NAVIGATION SYSTEM
      238. FIGURE 89. REST OF APAC AUTONOMOUS SHIPS MARKET ANALYSIS BY REGIONAL
      239. FIGURE 90. SOUTH AMERICA AUTONOMOUS SHIPS MARKET ANALYSIS
      240. FIGURE 91. BRAZIL AUTONOMOUS SHIPS MARKET ANALYSIS BY VESSEL TYPE
      241. FIGURE 92. BRAZIL AUTONOMOUS SHIPS MARKET ANALYSIS BY TECHNOLOGY
      242. FIGURE 93. BRAZIL AUTONOMOUS SHIPS MARKET ANALYSIS BY END USE
      243. FIGURE 94. BRAZIL AUTONOMOUS SHIPS MARKET ANALYSIS BY NAVIGATION SYSTEM
      244. FIGURE 95. BRAZIL AUTONOMOUS SHIPS MARKET ANALYSIS BY REGIONAL
      245. FIGURE 96. MEXICO AUTONOMOUS SHIPS MARKET ANALYSIS BY VESSEL TYPE
      246. FIGURE 97. MEXICO AUTONOMOUS SHIPS MARKET ANALYSIS BY TECHNOLOGY
      247. FIGURE 98. MEXICO AUTONOMOUS SHIPS MARKET ANALYSIS BY END USE
      248. FIGURE 99. MEXICO AUTONOMOUS SHIPS MARKET ANALYSIS BY NAVIGATION SYSTEM
      249. FIGURE 100. MEXICO AUTONOMOUS SHIPS MARKET ANALYSIS BY REGIONAL
      250. FIGURE 101. ARGENTINA AUTONOMOUS SHIPS MARKET ANALYSIS BY VESSEL TYPE
      251. FIGURE 102. ARGENTINA AUTONOMOUS SHIPS MARKET ANALYSIS BY TECHNOLOGY
      252. FIGURE 103. ARGENTINA AUTONOMOUS SHIPS MARKET ANALYSIS BY END USE
      253. FIGURE 104. ARGENTINA AUTONOMOUS SHIPS MARKET ANALYSIS BY NAVIGATION SYSTEM
      254. FIGURE 105. ARGENTINA AUTONOMOUS SHIPS MARKET ANALYSIS BY REGIONAL
      255. FIGURE 106. REST OF SOUTH AMERICA AUTONOMOUS SHIPS MARKET ANALYSIS BY VESSEL TYPE
      256. FIGURE 107. REST OF SOUTH AMERICA AUTONOMOUS SHIPS MARKET ANALYSIS BY TECHNOLOGY
      257. FIGURE 108. REST OF SOUTH AMERICA AUTONOMOUS SHIPS MARKET ANALYSIS BY END USE
      258. FIGURE 109. REST OF SOUTH AMERICA AUTONOMOUS SHIPS MARKET ANALYSIS BY NAVIGATION SYSTEM
      259. FIGURE 110. REST OF SOUTH AMERICA AUTONOMOUS SHIPS MARKET ANALYSIS BY REGIONAL
      260. FIGURE 111. MEA AUTONOMOUS SHIPS MARKET ANALYSIS
      261. FIGURE 112. GCC COUNTRIES AUTONOMOUS SHIPS MARKET ANALYSIS BY VESSEL TYPE
      262. FIGURE 113. GCC COUNTRIES AUTONOMOUS SHIPS MARKET ANALYSIS BY TECHNOLOGY
      263. FIGURE 114. GCC COUNTRIES AUTONOMOUS SHIPS MARKET ANALYSIS BY END USE
      264. FIGURE 115. GCC COUNTRIES AUTONOMOUS SHIPS MARKET ANALYSIS BY NAVIGATION SYSTEM
      265. FIGURE 116. GCC COUNTRIES AUTONOMOUS SHIPS MARKET ANALYSIS BY REGIONAL
      266. FIGURE 117. SOUTH AFRICA AUTONOMOUS SHIPS MARKET ANALYSIS BY VESSEL TYPE
      267. FIGURE 118. SOUTH AFRICA AUTONOMOUS SHIPS MARKET ANALYSIS BY TECHNOLOGY
      268. FIGURE 119. SOUTH AFRICA AUTONOMOUS SHIPS MARKET ANALYSIS BY END USE
      269. FIGURE 120. SOUTH AFRICA AUTONOMOUS SHIPS MARKET ANALYSIS BY NAVIGATION SYSTEM
      270. FIGURE 121. SOUTH AFRICA AUTONOMOUS SHIPS MARKET ANALYSIS BY REGIONAL
      271. FIGURE 122. REST OF MEA AUTONOMOUS SHIPS MARKET ANALYSIS BY VESSEL TYPE
      272. FIGURE 123. REST OF MEA AUTONOMOUS SHIPS MARKET ANALYSIS BY TECHNOLOGY
      273. FIGURE 124. REST OF MEA AUTONOMOUS SHIPS MARKET ANALYSIS BY END USE
      274. FIGURE 125. REST OF MEA AUTONOMOUS SHIPS MARKET ANALYSIS BY NAVIGATION SYSTEM
      275. FIGURE 126. REST OF MEA AUTONOMOUS SHIPS MARKET ANALYSIS BY REGIONAL
      276. FIGURE 127. KEY BUYING CRITERIA OF AUTONOMOUS SHIPS MARKET
      277. FIGURE 128. RESEARCH PROCESS OF MRFR
      278. FIGURE 129. DRO ANALYSIS OF AUTONOMOUS SHIPS MARKET
      279. FIGURE 130. DRIVERS IMPACT ANALYSIS: AUTONOMOUS SHIPS MARKET
      280. FIGURE 131. RESTRAINTS IMPACT ANALYSIS: AUTONOMOUS SHIPS MARKET
      281. FIGURE 132. SUPPLY / VALUE CHAIN: AUTONOMOUS SHIPS MARKET
      282. FIGURE 133. AUTONOMOUS SHIPS MARKET, BY VESSEL TYPE, 2025 (% SHARE)
      283. FIGURE 134. AUTONOMOUS SHIPS MARKET, BY VESSEL TYPE, 2019 TO 2035 (USD Billions)
      284. FIGURE 135. AUTONOMOUS SHIPS MARKET, BY TECHNOLOGY, 2025 (% SHARE)
      285. FIGURE 136. AUTONOMOUS SHIPS MARKET, BY TECHNOLOGY, 2019 TO 2035 (USD Billions)
      286. FIGURE 137. AUTONOMOUS SHIPS MARKET, BY END USE, 2025 (% SHARE)
      287. FIGURE 138. AUTONOMOUS SHIPS MARKET, BY END USE, 2019 TO 2035 (USD Billions)
      288. FIGURE 139. AUTONOMOUS SHIPS MARKET, BY NAVIGATION SYSTEM, 2025 (% SHARE)
      289. FIGURE 140. AUTONOMOUS SHIPS MARKET, BY NAVIGATION SYSTEM, 2019 TO 2035 (USD Billions)
      290. FIGURE 141. AUTONOMOUS SHIPS MARKET, BY REGIONAL, 2025 (% SHARE)
      291. FIGURE 142. AUTONOMOUS SHIPS MARKET, BY REGIONAL, 2019 TO 2035 (USD Billions)
      292. FIGURE 143. BENCHMARKING OF MAJOR COMPETITORS

    Autonomous Ships Market Segmentation

    • Autonomous Ships Market By Vessel Type (USD Billion, 2019-2035)

      • Cargo Ships
      • Tankers
      • Passenger Ships
      • Fishing Vessels
    • Autonomous Ships Market By Technology (USD Billion, 2019-2035)

      • Remote Controlled
      • Fully Autonomous
      • Semi-Autonomous
    • Autonomous Ships Market By End Use (USD Billion, 2019-2035)

      • Commercial Shipping
      • Defence
      • Research and Exploration
    • Autonomous Ships Market By Navigation System (USD Billion, 2019-2035)

      • GPS Based Systems
      • Lidar Systems
      • Radar Systems
    • Autonomous Ships Market By Regional (USD Billion, 2019-2035)

      • North America
      • Europe
      • South America
      • Asia Pacific
      • Middle East and Africa

    Autonomous Ships Market Regional Outlook (USD Billion, 2019-2035)

    • North America Outlook (USD Billion, 2019-2035)

      • North America Autonomous Ships Market by Vessel Type

        • Cargo Ships
        • Tankers
        • Passenger Ships
        • Fishing Vessels
      • North America Autonomous Ships Market by Technology Type

        • Remote Controlled
        • Fully Autonomous
        • Semi-Autonomous
      • North America Autonomous Ships Market by End Use Type

        • Commercial Shipping
        • Defence
        • Research and Exploration
      • North America Autonomous Ships Market by Navigation System Type

        • GPS Based Systems
        • Lidar Systems
        • Radar Systems
      • North America Autonomous Ships Market by Regional Type

        • US
        • Canada
      • US Outlook (USD Billion, 2019-2035)
      • US Autonomous Ships Market by Vessel Type

        • Cargo Ships
        • Tankers
        • Passenger Ships
        • Fishing Vessels
      • US Autonomous Ships Market by Technology Type

        • Remote Controlled
        • Fully Autonomous
        • Semi-Autonomous
      • US Autonomous Ships Market by End Use Type

        • Commercial Shipping
        • Defence
        • Research and Exploration
      • US Autonomous Ships Market by Navigation System Type

        • GPS Based Systems
        • Lidar Systems
        • Radar Systems
      • CANADA Outlook (USD Billion, 2019-2035)
      • CANADA Autonomous Ships Market by Vessel Type

        • Cargo Ships
        • Tankers
        • Passenger Ships
        • Fishing Vessels
      • CANADA Autonomous Ships Market by Technology Type

        • Remote Controlled
        • Fully Autonomous
        • Semi-Autonomous
      • CANADA Autonomous Ships Market by End Use Type

        • Commercial Shipping
        • Defence
        • Research and Exploration
      • CANADA Autonomous Ships Market by Navigation System Type

        • GPS Based Systems
        • Lidar Systems
        • Radar Systems
    • Europe Outlook (USD Billion, 2019-2035)

      • Europe Autonomous Ships Market by Vessel Type

        • Cargo Ships
        • Tankers
        • Passenger Ships
        • Fishing Vessels
      • Europe Autonomous Ships Market by Technology Type

        • Remote Controlled
        • Fully Autonomous
        • Semi-Autonomous
      • Europe Autonomous Ships Market by End Use Type

        • Commercial Shipping
        • Defence
        • Research and Exploration
      • Europe Autonomous Ships Market by Navigation System Type

        • GPS Based Systems
        • Lidar Systems
        • Radar Systems
      • Europe Autonomous Ships Market by Regional Type

        • Germany
        • UK
        • France
        • Russia
        • Italy
        • Spain
        • Rest of Europe
      • GERMANY Outlook (USD Billion, 2019-2035)
      • GERMANY Autonomous Ships Market by Vessel Type

        • Cargo Ships
        • Tankers
        • Passenger Ships
        • Fishing Vessels
      • GERMANY Autonomous Ships Market by Technology Type

        • Remote Controlled
        • Fully Autonomous
        • Semi-Autonomous
      • GERMANY Autonomous Ships Market by End Use Type

        • Commercial Shipping
        • Defence
        • Research and Exploration
      • GERMANY Autonomous Ships Market by Navigation System Type

        • GPS Based Systems
        • Lidar Systems
        • Radar Systems
      • UK Outlook (USD Billion, 2019-2035)
      • UK Autonomous Ships Market by Vessel Type

        • Cargo Ships
        • Tankers
        • Passenger Ships
        • Fishing Vessels
      • UK Autonomous Ships Market by Technology Type

        • Remote Controlled
        • Fully Autonomous
        • Semi-Autonomous
      • UK Autonomous Ships Market by End Use Type

        • Commercial Shipping
        • Defence
        • Research and Exploration
      • UK Autonomous Ships Market by Navigation System Type

        • GPS Based Systems
        • Lidar Systems
        • Radar Systems
      • FRANCE Outlook (USD Billion, 2019-2035)
      • FRANCE Autonomous Ships Market by Vessel Type

        • Cargo Ships
        • Tankers
        • Passenger Ships
        • Fishing Vessels
      • FRANCE Autonomous Ships Market by Technology Type

        • Remote Controlled
        • Fully Autonomous
        • Semi-Autonomous
      • FRANCE Autonomous Ships Market by End Use Type

        • Commercial Shipping
        • Defence
        • Research and Exploration
      • FRANCE Autonomous Ships Market by Navigation System Type

        • GPS Based Systems
        • Lidar Systems
        • Radar Systems
      • RUSSIA Outlook (USD Billion, 2019-2035)
      • RUSSIA Autonomous Ships Market by Vessel Type

        • Cargo Ships
        • Tankers
        • Passenger Ships
        • Fishing Vessels
      • RUSSIA Autonomous Ships Market by Technology Type

        • Remote Controlled
        • Fully Autonomous
        • Semi-Autonomous
      • RUSSIA Autonomous Ships Market by End Use Type

        • Commercial Shipping
        • Defence
        • Research and Exploration
      • RUSSIA Autonomous Ships Market by Navigation System Type

        • GPS Based Systems
        • Lidar Systems
        • Radar Systems
      • ITALY Outlook (USD Billion, 2019-2035)
      • ITALY Autonomous Ships Market by Vessel Type

        • Cargo Ships
        • Tankers
        • Passenger Ships
        • Fishing Vessels
      • ITALY Autonomous Ships Market by Technology Type

        • Remote Controlled
        • Fully Autonomous
        • Semi-Autonomous
      • ITALY Autonomous Ships Market by End Use Type

        • Commercial Shipping
        • Defence
        • Research and Exploration
      • ITALY Autonomous Ships Market by Navigation System Type

        • GPS Based Systems
        • Lidar Systems
        • Radar Systems
      • SPAIN Outlook (USD Billion, 2019-2035)
      • SPAIN Autonomous Ships Market by Vessel Type

        • Cargo Ships
        • Tankers
        • Passenger Ships
        • Fishing Vessels
      • SPAIN Autonomous Ships Market by Technology Type

        • Remote Controlled
        • Fully Autonomous
        • Semi-Autonomous
      • SPAIN Autonomous Ships Market by End Use Type

        • Commercial Shipping
        • Defence
        • Research and Exploration
      • SPAIN Autonomous Ships Market by Navigation System Type

        • GPS Based Systems
        • Lidar Systems
        • Radar Systems
      • REST OF EUROPE Outlook (USD Billion, 2019-2035)
      • REST OF EUROPE Autonomous Ships Market by Vessel Type

        • Cargo Ships
        • Tankers
        • Passenger Ships
        • Fishing Vessels
      • REST OF EUROPE Autonomous Ships Market by Technology Type

        • Remote Controlled
        • Fully Autonomous
        • Semi-Autonomous
      • REST OF EUROPE Autonomous Ships Market by End Use Type

        • Commercial Shipping
        • Defence
        • Research and Exploration
      • REST OF EUROPE Autonomous Ships Market by Navigation System Type

        • GPS Based Systems
        • Lidar Systems
        • Radar Systems
    • APAC Outlook (USD Billion, 2019-2035)

      • APAC Autonomous Ships Market by Vessel Type

        • Cargo Ships
        • Tankers
        • Passenger Ships
        • Fishing Vessels
      • APAC Autonomous Ships Market by Technology Type

        • Remote Controlled
        • Fully Autonomous
        • Semi-Autonomous
      • APAC Autonomous Ships Market by End Use Type

        • Commercial Shipping
        • Defence
        • Research and Exploration
      • APAC Autonomous Ships Market by Navigation System Type

        • GPS Based Systems
        • Lidar Systems
        • Radar Systems
      • APAC Autonomous Ships Market by Regional Type

        • China
        • India
        • Japan
        • South Korea
        • Malaysia
        • Thailand
        • Indonesia
        • Rest of APAC
      • CHINA Outlook (USD Billion, 2019-2035)
      • CHINA Autonomous Ships Market by Vessel Type

        • Cargo Ships
        • Tankers
        • Passenger Ships
        • Fishing Vessels
      • CHINA Autonomous Ships Market by Technology Type

        • Remote Controlled
        • Fully Autonomous
        • Semi-Autonomous
      • CHINA Autonomous Ships Market by End Use Type

        • Commercial Shipping
        • Defence
        • Research and Exploration
      • CHINA Autonomous Ships Market by Navigation System Type

        • GPS Based Systems
        • Lidar Systems
        • Radar Systems
      • INDIA Outlook (USD Billion, 2019-2035)
      • INDIA Autonomous Ships Market by Vessel Type

        • Cargo Ships
        • Tankers
        • Passenger Ships
        • Fishing Vessels
      • INDIA Autonomous Ships Market by Technology Type

        • Remote Controlled
        • Fully Autonomous
        • Semi-Autonomous
      • INDIA Autonomous Ships Market by End Use Type

        • Commercial Shipping
        • Defence
        • Research and Exploration
      • INDIA Autonomous Ships Market by Navigation System Type

        • GPS Based Systems
        • Lidar Systems
        • Radar Systems
      • JAPAN Outlook (USD Billion, 2019-2035)
      • JAPAN Autonomous Ships Market by Vessel Type

        • Cargo Ships
        • Tankers
        • Passenger Ships
        • Fishing Vessels
      • JAPAN Autonomous Ships Market by Technology Type

        • Remote Controlled
        • Fully Autonomous
        • Semi-Autonomous
      • JAPAN Autonomous Ships Market by End Use Type

        • Commercial Shipping
        • Defence
        • Research and Exploration
      • JAPAN Autonomous Ships Market by Navigation System Type

        • GPS Based Systems
        • Lidar Systems
        • Radar Systems
      • SOUTH KOREA Outlook (USD Billion, 2019-2035)
      • SOUTH KOREA Autonomous Ships Market by Vessel Type

        • Cargo Ships
        • Tankers
        • Passenger Ships
        • Fishing Vessels
      • SOUTH KOREA Autonomous Ships Market by Technology Type

        • Remote Controlled
        • Fully Autonomous
        • Semi-Autonomous
      • SOUTH KOREA Autonomous Ships Market by End Use Type

        • Commercial Shipping
        • Defence
        • Research and Exploration
      • SOUTH KOREA Autonomous Ships Market by Navigation System Type

        • GPS Based Systems
        • Lidar Systems
        • Radar Systems
      • MALAYSIA Outlook (USD Billion, 2019-2035)
      • MALAYSIA Autonomous Ships Market by Vessel Type

        • Cargo Ships
        • Tankers
        • Passenger Ships
        • Fishing Vessels
      • MALAYSIA Autonomous Ships Market by Technology Type

        • Remote Controlled
        • Fully Autonomous
        • Semi-Autonomous
      • MALAYSIA Autonomous Ships Market by End Use Type

        • Commercial Shipping
        • Defence
        • Research and Exploration
      • MALAYSIA Autonomous Ships Market by Navigation System Type

        • GPS Based Systems
        • Lidar Systems
        • Radar Systems
      • THAILAND Outlook (USD Billion, 2019-2035)
      • THAILAND Autonomous Ships Market by Vessel Type

        • Cargo Ships
        • Tankers
        • Passenger Ships
        • Fishing Vessels
      • THAILAND Autonomous Ships Market by Technology Type

        • Remote Controlled
        • Fully Autonomous
        • Semi-Autonomous
      • THAILAND Autonomous Ships Market by End Use Type

        • Commercial Shipping
        • Defence
        • Research and Exploration
      • THAILAND Autonomous Ships Market by Navigation System Type

        • GPS Based Systems
        • Lidar Systems
        • Radar Systems
      • INDONESIA Outlook (USD Billion, 2019-2035)
      • INDONESIA Autonomous Ships Market by Vessel Type

        • Cargo Ships
        • Tankers
        • Passenger Ships
        • Fishing Vessels
      • INDONESIA Autonomous Ships Market by Technology Type

        • Remote Controlled
        • Fully Autonomous
        • Semi-Autonomous
      • INDONESIA Autonomous Ships Market by End Use Type

        • Commercial Shipping
        • Defence
        • Research and Exploration
      • INDONESIA Autonomous Ships Market by Navigation System Type

        • GPS Based Systems
        • Lidar Systems
        • Radar Systems
      • REST OF APAC Outlook (USD Billion, 2019-2035)
      • REST OF APAC Autonomous Ships Market by Vessel Type

        • Cargo Ships
        • Tankers
        • Passenger Ships
        • Fishing Vessels
      • REST OF APAC Autonomous Ships Market by Technology Type

        • Remote Controlled
        • Fully Autonomous
        • Semi-Autonomous
      • REST OF APAC Autonomous Ships Market by End Use Type

        • Commercial Shipping
        • Defence
        • Research and Exploration
      • REST OF APAC Autonomous Ships Market by Navigation System Type

        • GPS Based Systems
        • Lidar Systems
        • Radar Systems
    • South America Outlook (USD Billion, 2019-2035)

      • South America Autonomous Ships Market by Vessel Type

        • Cargo Ships
        • Tankers
        • Passenger Ships
        • Fishing Vessels
      • South America Autonomous Ships Market by Technology Type

        • Remote Controlled
        • Fully Autonomous
        • Semi-Autonomous
      • South America Autonomous Ships Market by End Use Type

        • Commercial Shipping
        • Defence
        • Research and Exploration
      • South America Autonomous Ships Market by Navigation System Type

        • GPS Based Systems
        • Lidar Systems
        • Radar Systems
      • South America Autonomous Ships Market by Regional Type

        • Brazil
        • Mexico
        • Argentina
        • Rest of South America
      • BRAZIL Outlook (USD Billion, 2019-2035)
      • BRAZIL Autonomous Ships Market by Vessel Type

        • Cargo Ships
        • Tankers
        • Passenger Ships
        • Fishing Vessels
      • BRAZIL Autonomous Ships Market by Technology Type

        • Remote Controlled
        • Fully Autonomous
        • Semi-Autonomous
      • BRAZIL Autonomous Ships Market by End Use Type

        • Commercial Shipping
        • Defence
        • Research and Exploration
      • BRAZIL Autonomous Ships Market by Navigation System Type

        • GPS Based Systems
        • Lidar Systems
        • Radar Systems
      • MEXICO Outlook (USD Billion, 2019-2035)
      • MEXICO Autonomous Ships Market by Vessel Type

        • Cargo Ships
        • Tankers
        • Passenger Ships
        • Fishing Vessels
      • MEXICO Autonomous Ships Market by Technology Type

        • Remote Controlled
        • Fully Autonomous
        • Semi-Autonomous
      • MEXICO Autonomous Ships Market by End Use Type

        • Commercial Shipping
        • Defence
        • Research and Exploration
      • MEXICO Autonomous Ships Market by Navigation System Type

        • GPS Based Systems
        • Lidar Systems
        • Radar Systems
      • ARGENTINA Outlook (USD Billion, 2019-2035)
      • ARGENTINA Autonomous Ships Market by Vessel Type

        • Cargo Ships
        • Tankers
        • Passenger Ships
        • Fishing Vessels
      • ARGENTINA Autonomous Ships Market by Technology Type

        • Remote Controlled
        • Fully Autonomous
        • Semi-Autonomous
      • ARGENTINA Autonomous Ships Market by End Use Type

        • Commercial Shipping
        • Defence
        • Research and Exploration
      • ARGENTINA Autonomous Ships Market by Navigation System Type

        • GPS Based Systems
        • Lidar Systems
        • Radar Systems
      • REST OF SOUTH AMERICA Outlook (USD Billion, 2019-2035)
      • REST OF SOUTH AMERICA Autonomous Ships Market by Vessel Type

        • Cargo Ships
        • Tankers
        • Passenger Ships
        • Fishing Vessels
      • REST OF SOUTH AMERICA Autonomous Ships Market by Technology Type

        • Remote Controlled
        • Fully Autonomous
        • Semi-Autonomous
      • REST OF SOUTH AMERICA Autonomous Ships Market by End Use Type

        • Commercial Shipping
        • Defence
        • Research and Exploration
      • REST OF SOUTH AMERICA Autonomous Ships Market by Navigation System Type

        • GPS Based Systems
        • Lidar Systems
        • Radar Systems
    • MEA Outlook (USD Billion, 2019-2035)

      • MEA Autonomous Ships Market by Vessel Type

        • Cargo Ships
        • Tankers
        • Passenger Ships
        • Fishing Vessels
      • MEA Autonomous Ships Market by Technology Type

        • Remote Controlled
        • Fully Autonomous
        • Semi-Autonomous
      • MEA Autonomous Ships Market by End Use Type

        • Commercial Shipping
        • Defence
        • Research and Exploration
      • MEA Autonomous Ships Market by Navigation System Type

        • GPS Based Systems
        • Lidar Systems
        • Radar Systems
      • MEA Autonomous Ships Market by Regional Type

        • GCC Countries
        • South Africa
        • Rest of MEA
      • GCC COUNTRIES Outlook (USD Billion, 2019-2035)
      • GCC COUNTRIES Autonomous Ships Market by Vessel Type

        • Cargo Ships
        • Tankers
        • Passenger Ships
        • Fishing Vessels
      • GCC COUNTRIES Autonomous Ships Market by Technology Type

        • Remote Controlled
        • Fully Autonomous
        • Semi-Autonomous
      • GCC COUNTRIES Autonomous Ships Market by End Use Type

        • Commercial Shipping
        • Defence
        • Research and Exploration
      • GCC COUNTRIES Autonomous Ships Market by Navigation System Type

        • GPS Based Systems
        • Lidar Systems
        • Radar Systems
      • SOUTH AFRICA Outlook (USD Billion, 2019-2035)
      • SOUTH AFRICA Autonomous Ships Market by Vessel Type

        • Cargo Ships
        • Tankers
        • Passenger Ships
        • Fishing Vessels
      • SOUTH AFRICA Autonomous Ships Market by Technology Type

        • Remote Controlled
        • Fully Autonomous
        • Semi-Autonomous
      • SOUTH AFRICA Autonomous Ships Market by End Use Type

        • Commercial Shipping
        • Defence
        • Research and Exploration
      • SOUTH AFRICA Autonomous Ships Market by Navigation System Type

        • GPS Based Systems
        • Lidar Systems
        • Radar Systems
      • REST OF MEA Outlook (USD Billion, 2019-2035)
      • REST OF MEA Autonomous Ships Market by Vessel Type

        • Cargo Ships
        • Tankers
        • Passenger Ships
        • Fishing Vessels
      • REST OF MEA Autonomous Ships Market by Technology Type

        • Remote Controlled
        • Fully Autonomous
        • Semi-Autonomous
      • REST OF MEA Autonomous Ships Market by End Use Type

        • Commercial Shipping
        • Defence
        • Research and Exploration
      • REST OF MEA Autonomous Ships Market by Navigation System Type

        • GPS Based Systems
        • Lidar Systems
        • Radar Systems


    Infographic

    Free Sample Request

    Kindly complete the form below to receive a free sample of this Report

    Get Free Sample

    Customer Strories

    “I am very pleased with how market segments have been defined in a relevant way for my purposes (such as "Portable Freezers & refrigerators" and "last-mile"). In general the report is well structured. Thanks very much for your efforts.”

    Victoria Milne

    Founder
    Case Study
    Chemicals and Materials