ID: MRFR/A&D/6631-HCR | February 2021 | Region: Global | 133 pages
Market Scenario
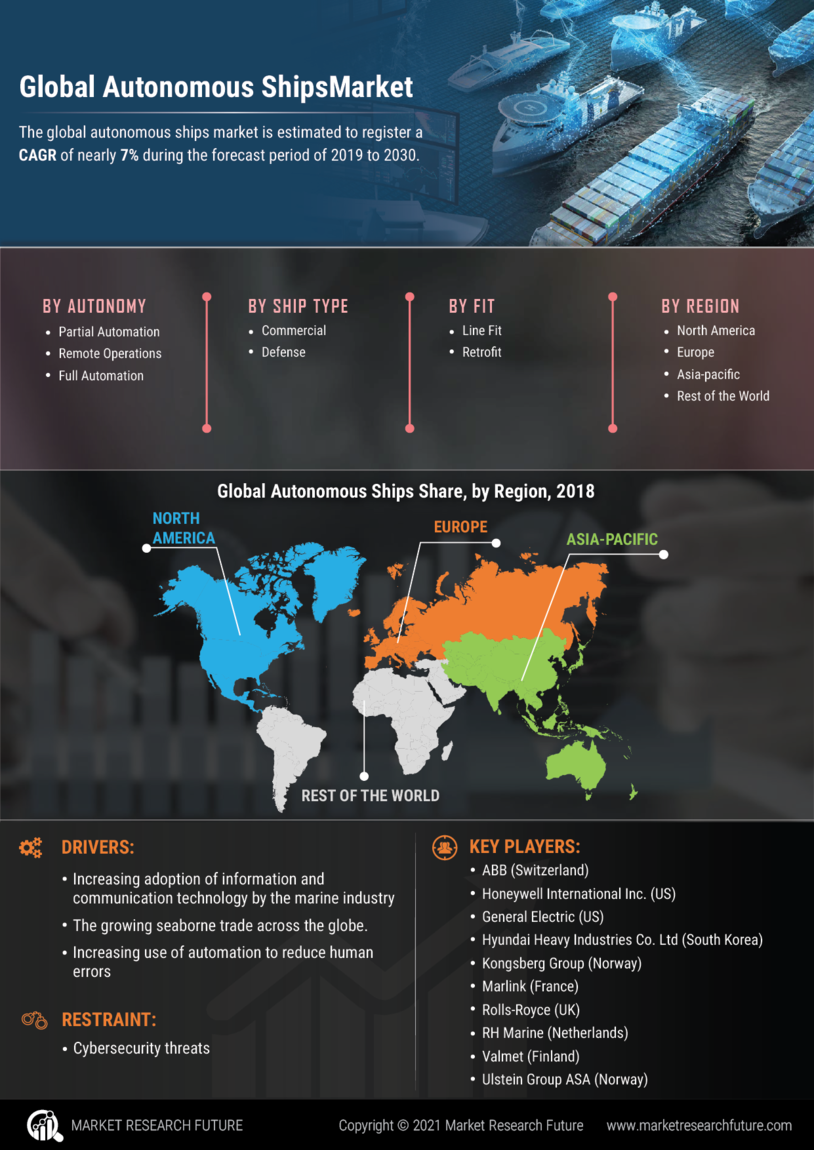
Autonomous ships are ships piloted by artificial intelligence (AI). Autonomous ships utilize a fleet of sensor-based technologies such as radar, high-definition (HD) cameras, LiDAR, sonar, and thermal imaging that enable the ship to convert from a fully manned ship to a fully autonomous, unmanned ship. Factors such as increasing adoption of information and communication technology by the marine industry and the growing seaborne trade across the globe are driving the market growth. Furthermore, the increasing use of automation to reduce human errors is also driving the growth of the market.
The growing need for situational awareness by fleet operators and the thriving maritime tourism industry are further expected to drive the growth of the market. However, cybersecurity threats is expected to hamper the growth of the market.
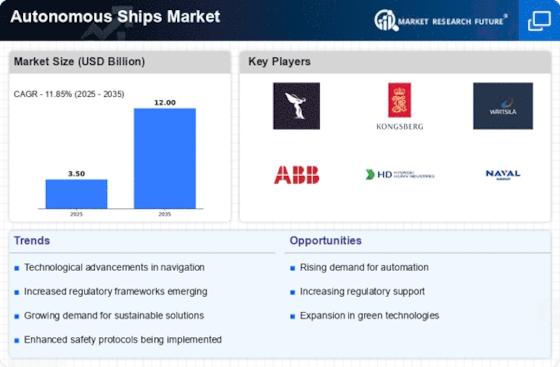
The global autonomous ships market is estimated to register a CAGR of nearly 7% during the forecast period of 2019 to 2030.
Key Players
Segmentation of the Global Autonomous Ships Market
On the basis of ship type, the market has been bifurcated into commercial and defense. In 2018, the commercial segment dominated the global market and it is expected to register the higher CAGR during the forecast period. Increasing demand for reduced operational costs and rising use of autonomous ships for seaborne trade are driving the growth of the segment.
Based on autonomy, the market has been divided into partial automation, remote operations, and full automation. The partial automation segment dominated the market in 2018. However, the full automation segment is expected to register the highest CAGR during the forecast period. Full autonomous ships offer various benefits such as reduced labour costs, enhanced security and convenience are driving the growth of the segment.
By fit, the market has been divided into line fit and retrofit. The line fit segment dominated the market in 2018 and is expected to register higher growth rate during the forecast period from 2019 to 2030. Increasing demand for new ships owing to growing sea trade across the globe is driving the segment growth.
Based on solution, the market has been classified as systems, software, and solutions. The systems segment dominated the market in 2018 and is expected to register the highest CAGR during the forecast period. Systems such as machine health information systems, communication and connectivity, and navigation systems provide enhanced safety, security, and communication to sailors.
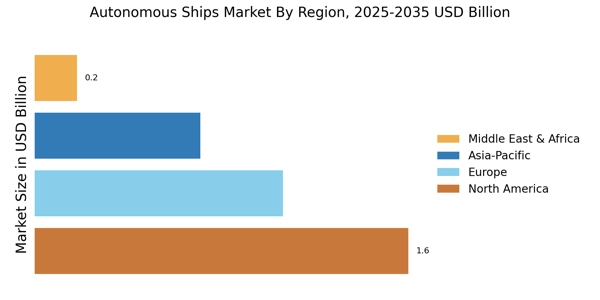
The global autonomous ships market has been segmented, based on region, into North America, Europe, Asia-Pacific, and the rest of the world. The market in Asia-Pacific dominated the global autonomous ships market in 2018 owing to increasing domestic ship production in countries such as China. However, the market in Europe is expected to be the fastest-growing during the forecast period. Increasing growth in the marine tourism industry is driving the growth of the autonomous ships market in the region.
Research Methodology
The market values and forecasts are derived using MRFR research methodology, which includes secondary research, primary interviews, data triangulation and validation from an in-house data repository and statistical modeling tools.
Secondary Research
In this process, data is collected from various secondary sources, including annual reports, SEC filings, journals, government associations, aerospace & defense magazines, white papers, corporate presentations, company websites, and paid databases.
Primary Research
In this process, both the demand- and supply-side parties are interviewed to extract facts and insights into the market forecast, production, trends, and projected market growth. Industry stakeholders such as CEOs, VPs, directors, and marketing executives across the value chain are approached to obtain key information.
Key Insights
Intended Audience
Frequently Asked Questions (FAQ) :
Autonomous ships market’s growth rate in the coming years can be close to 7%.
The commercial ship type dominates the market.
Increasing demand for new ships owing to growing sea trade across the globe is driving the segment growth.
Full autonomous ships in greater demand in the market as they offer benefits like reduced labor costs, enhanced security and convenience.
Cybersecurity threats can slow down the market growth rate in the years to follow.
Table of Contents
1. Executive Summary
1.1. Market Attractiveness Analysis
1.1.1. Global Autonomous Ships Market, by Ship Type
1.1.2. Global Autonomous Ships Market, by Autonomy
1.1.3. Global Autonomous Ships Market, by Fit
1.1.4. Global Autonomous Ships Market, by Solution
1.1.5. Global Autonomous Ships Market, by Region
2. Market Introduction
2.1. Market Definition
2.2. Scope of the Study
2.3. Market Structure
2.4. Key Buying Criteria
2.5. Market Factor Indicator Analysis
3. Research Methodology
3.1. Research Process
3.2. Primary Research
3.3. Secondary Research
3.4. Market Size Estimation
3.5. Forecast Model
3.6. List of Assumptions
4. Market Insights
5. Market Dynamics
5.1. Introduction
5.2. Drivers
5.3. Restraints
5.4. Opportunities
5.5. Challenges
5.6. Market/Technological Trends
5.7. Patent Trends
5.8. Regulatory Landscape/Standards
6. Market Factor Analysis
6.1. Value Chain/Supply Chain Analysis
6.1.1. R&D
6.1.2. Manufacturing
6.1.3. Distribution & Sales
6.1.4. Post-Sales Monitoring
6.2. Porter’s Five Forces Analysis
6.2.1. Threat of New Entrants
6.2.2. Bargaining Power of Buyers
6.2.3. Threat of Substitutes
6.2.4. Rivalry
6.2.5. Bargaining Power of Supplies
7. Global Autonomous Ships Market, by Ship Type
7.1. Introduction
7.2. Commercial
7.2.1. Market Estimates & Forecast, 2019–2030
7.2.2. Market Estimates & Forecast, by Region, 2019–2030
7.3. Defense
7.3.1. Market Estimates & Forecast, 2019–2030
7.3.2. Market Estimates & Forecast, by Region, 2019–2030
8. Global Autonomous Ships Market, by Autonomy
8.1. Introduction
8.2. Partial Automation
8.2.1. Market Estimates & Forecast, 2019–2030
8.2.2. Market Estimates & Forecast, by Region, 2019–2030
8.3. Remote Operations
8.3.1. Market Estimates & Forecast, 2019–2030
8.3.2. Market Estimates & Forecast, by Region, 2019–2030
8.4. Full Automation
8.4.1. Market Estimates & Forecast, 2019–2030
8.4.2. Market Estimates & Forecast, by Region, 2019–2030
9. Global Autonomous Ships Market, by Fit
9.1. Introduction
9.2. Line Fit
9.2.1. Market Estimates & Forecast, 2019–2030
9.2.2. Market Estimates & Forecast, by Region, 2019–2030
9.3. Retrofit
9.3.1. Market Estimates & Forecast, 2019–2030
9.3.2. Market Estimates & Forecast, by Region, 2019–2030
10. Global Autonomous Ships Market, by Solution
10.1. Introduction
10.2. Systems
10.2.1. Market Estimates & Forecast, 2019–2030
10.2.2. Market Estimates & Forecast, by Region, 2019–2030
10.3. Software
10.3.1. Market Estimates & Forecast, 2019–2030
10.3.2. Market Estimates & Forecast, by Region, 2019–2030
10.4. Structures
10.4.1. Market Estimates & Forecast, 2019–2030
10.4.2. Market Estimates & Forecast, by Region, 2019–2030
11. Global Autonomous Ships Market, by Region
11.1. Introduction
11.2. North America
11.2.1. Market Estimates & Forecast, by Country, 2019–2030
11.2.2. Market Estimates & Forecast, by Ship Type, 2019–2030
11.2.3. Market Estimates & Forecast, by Autonomy, 2019–2030
11.2.4. Market Estimates & Forecast, by Fit, 2019–2030
11.2.5. Market Estimates & Forecast, by Solution, 2019–2030
11.2.6. US
11.2.6.1. Market Estimates & Forecast, by Ship Type, 2019–2030
11.2.6.2. Market Estimates & Forecast, by Autonomy, 2019–2030
11.2.6.3. Market Estimates & Forecast, by Fit, 2019–2030
11.2.6.4. Market Estimates & Forecast, by Solution, 2019–2030
11.2.7. Canada
11.2.7.1. Market Estimates & Forecast, by Ship Type, 2019–2030
11.2.7.2. Market Estimates & Forecast, by Autonomy, 2019–2030
11.2.7.3. Market Estimates & Forecast, by Fit, 2019–2030
11.2.7.4. Market Estimates & Forecast, by Solution, 2019–2030
11.3. Europe
11.3.1. Market Estimates & Forecast, by Country, 2019–2030
11.3.2. Market Estimates & Forecast, by Ship Type, 2019–2030
11.3.3. Market Estimates & Forecast, by Autonomy, 2019–2030
11.3.4. Market Estimates & Forecast, by Fit, 2019–2030
11.3.5. Market Estimates & Forecast, by Solution, 2019–2030
11.3.6. UK
11.3.6.1. Market Estimates & Forecast, by Ship Type, 2019–2030
11.3.6.2. Market Estimates & Forecast, by Autonomy, 2019–2030
11.3.6.3. Market Estimates & Forecast, by Fit, 2019–2030
11.3.6.4. Market Estimates & Forecast, by Solution, 2019–2030
11.3.7. Germany
11.3.7.1. Market Estimates & Forecast, by Ship Type, 2019–2030
11.3.7.2. Market Estimates & Forecast, by Autonomy, 2019–2030
11.3.7.3. Market Estimates & Forecast, by Fit, 2019–2030
11.3.7.4. Market Estimates & Forecast, by Solution, 2019–2030
11.3.8. France
11.3.8.1. Market Estimates & Forecast, by Ship Type, 2019–2030
11.3.8.2. Market Estimates & Forecast, by Autonomy, 2019–2030
11.3.8.3. Market Estimates & Forecast, by Fit, 2019–2030
11.3.8.4. Market Estimates & Forecast, by Solution, 2019–2030
11.3.9. Russia
11.3.9.1. Market Estimates & Forecast, by Ship Type, 2019–2030
11.3.9.2. Market Estimates & Forecast, by Autonomy, 2019–2030
11.3.9.3. Market Estimates & Forecast, by Fit, 2019–2030
11.3.9.4. Market Estimates & Forecast, by Solution, 2019–2030
11.3.10. Italy
11.3.10.1. Market Estimates & Forecast, by Ship Type, 2019–2030
11.3.10.2. Market Estimates & Forecast, by Autonomy, 2019–2030
11.3.10.3. Market Estimates & Forecast, by Fit, 2019–2030
11.3.10.4. Market Estimates & Forecast, by Solution, 2019–2030
11.3.11. Norway
11.3.11.1. Market Estimates & Forecast, by Ship Type, 2019–2030
11.3.11.2. Market Estimates & Forecast, by Autonomy, 2019–2030
11.3.11.3. Market Estimates & Forecast, by Fit, 2019–2030
11.3.11.4. Market Estimates & Forecast, by Solution, 2019–2030
11.3.12. Turkey
11.3.12.1. Market Estimates & Forecast, by Ship Type, 2019–2030
11.3.12.2. Market Estimates & Forecast, by Autonomy, 2019–2030
11.3.12.3. Market Estimates & Forecast, by Fit, 2019–2030
11.3.12.4. Market Estimates & Forecast, by Solution, 2019–2030
11.3.13. Rest of Europe
11.3.13.1. Market Estimates & Forecast, by Ship Type, 2019–2030
11.3.13.2. Market Estimates & Forecast, by Autonomy, 2019–2030
11.3.13.3. Market Estimates & Forecast, by Fit, 2019–2030
11.3.13.4. Market Estimates & Forecast, by Solution, 2019–2030
11.4. Asia-Pacific
11.4.1. Market Estimates & Forecast, by Country, 2019–2030
11.4.2. Market Estimates & Forecast, by Ship Type, 2019–2030
11.4.3. Market Estimates & Forecast, by Autonomy, 2019–2030
11.4.4. Market Estimates & Forecast, by Fit, 2019–2030
11.4.5. Market Estimates & Forecast, by Solution, 2019–2030
11.4.6. China
11.4.6.1. Market Estimates & Forecast, by Ship Type, 2019–2030
11.4.6.2. Market Estimates & Forecast, by Autonomy, 2019–2030
11.4.6.3. Market Estimates & Forecast, by Fit, 2019–2030
11.4.6.4. Market Estimates & Forecast, by Solution, 2019–2030
11.4.7. Japan
11.4.7.1. Market Estimates & Forecast, by Ship Type, 2019–2030
11.4.7.2. Market Estimates & Forecast, by Autonomy, 2019–2030
11.4.7.3. Market Estimates & Forecast, by Fit, 2019–2030
11.4.7.4. Market Estimates & Forecast, by Solution, 2019–2030
11.4.8. India
11.4.8.1. Market Estimates & Forecast, by Ship Type, 2019–2030
11.4.8.2. Market Estimates & Forecast, by Autonomy, 2019–2030
11.4.8.3. Market Estimates & Forecast, by Fit, 2019–2030
11.4.8.4. Market Estimates & Forecast, by Solution, 2019–2030
11.4.9. South Korea
11.4.9.1. Market Estimates & Forecast, by Ship Type, 2019–2030
11.4.9.2. Market Estimates & Forecast, by Autonomy, 2019–2030
11.4.9.3. Market Estimates & Forecast, by Fit, 2019–2030
11.4.9.4. Market Estimates & Forecast, by Solution, 2019–2030
11.4.10. Rest of Asia-Pacific
11.4.10.1. Market Estimates & Forecast, by Ship Type, 2019–2030
11.4.10.2. Market Estimates & Forecast, by Autonomy, 2019–2030
11.4.10.3. Market Estimates & Forecast, by Fit, 2019–2030
11.4.10.4. Market Estimates & Forecast, by Solution, 2019–2030
11.5. Rest of the World
11.5.1. Market Estimates & Forecast, by Country, 2019–2030
11.5.2. Market Estimates & Forecast, by Ship Type, 2019–2030
11.5.3. Market Estimates & Forecast, by Autonomy, 2019–2030
11.5.4. Market Estimates & Forecast, by Fit, 2019–2030
11.5.5. Market Estimates & Forecast, by Solution, 2019–2030
11.5.6. Middle East & Africa
11.5.6.1. Market Estimates & Forecast, by Ship Type, 2019–2030
11.5.6.2. Market Estimates & Forecast, by Autonomy, 2019–2030
11.5.6.3. Market Estimates & Forecast, by Fit, 2019–2030
11.5.6.4. Market Estimates & Forecast, by Solution, 2019–2030
11.5.7. Latin America
11.5.7.1. Market Estimates & Forecast, by Ship Type, 2019–2030
11.5.7.2. Market Estimates & Forecast, by Autonomy, 2019–2030
11.5.7.3. Market Estimates & Forecast, by Fit, 2019–2030
11.5.7.4. Market Estimates & Forecast, by Solution, 2019–2030
12. Competitive Landscape
12.1. Competitive Overview
12.2. Competitor Dashboard
12.3. Major Growth Strategies in the Global Autonomous Ships Market
12.4. Competitive Benchmarking
12.5. Market Share Analysis
12.6. Kongsberg Group: The Leading Player in Terms of Number of Developments in the Global Autonomous Ships Market
12.7. Key Developments & Growth Strategies
12.7.1. Product Launches/Service Deployments
12.7.2. Mergers & Acquisitions
12.7.3. Joint Ventures
13. Company Profiles
13.1. ABB
13.1.1. Company Overview
13.1.2. Products/Services Offered
13.1.3. Financial Overview
13.1.4. Key Developments
13.1.5. SWOT Analysis
13.1.6. Key Strategies
13.2. General Electric
13.2.1. Company Overview
13.2.2. Products/Services Offered
13.2.3. Financial Overview
13.2.4. Key Developments
13.2.5. SWOT Analysis
13.2.6. Key Strategies
13.3. Honeywell International, Inc.
13.3.1. Company Overview
13.3.2. Products/Services Offered
13.3.3. Financial Overview
13.3.4. Key Developments
13.3.5. SWOT Analysis
13.3.6. Key Strategies
13.4. Hyundai Heavy Industries Co., Ltd.
13.4.1. Company Overview
13.4.2. Products/Services Offered
13.4.3. Financial Overview
13.4.4. Key Developments
13.4.5. SWOT Analysis
13.4.6. Key Strategies
13.5. Kongsberg Group
13.5.1. Company Overview
13.5.2. Products/Services Offered
13.5.3. Financial Overview
13.5.4. Key Developments
13.5.5. SWOT Analysis
13.5.6. Key Strategies
13.6. Marine Technologies, LLC
13.6.1. Company Overview
13.6.2. Products/Services Offered
13.6.3. Financial Overview
13.6.4. Key Developments
13.6.5. SWOT Analysis
13.6.6. Key Strategies
13.7. Marlink
13.7.1. Company Overview
13.7.2. Products/Services Offered
13.7.3. Financial Overview
13.7.4. Key Developments
13.7.5. SWOT Analysis
13.7.6. Key Strategies
13.8. Praxis Automation Technology B.V.
13.8.1. Company Overview
13.8.2. Products/Services Offered
13.8.3. Financial Overview
13.8.4. Key Developments
13.8.5. SWOT Analysis
13.8.6. Key Strategies
13.9. RH Marine
13.9.1. Company Overview
13.9.2. Products/Services Offered
13.9.3. Financial Overview
13.9.4. Key Developments
13.9.5. SWOT Analysis
13.9.6. Key Strategies
13.10. Rolls-Royce
13.10.1. Company Overview
13.10.2. Products/Services Offered
13.10.3. Financial Overview
13.10.4. Key Developments
13.10.5. SWOT Analysis
13.10.6. Key Strategies
13.11. Siemens AG
13.11.1. Company Overview
13.11.2. Products/Services Offered
13.11.3. Financial Overview
13.11.4. Key Developments
13.11.5. SWOT Analysis
13.11.6. Key Strategies
13.12. Ulstein Group ASA
13.12.1. Company Overview
13.12.2. Products/Services Offered
13.12.3. Financial Overview
13.12.4. Key Developments
13.12.5. SWOT Analysis
13.12.6. Key Strategies
13.13. Valmet
13.13.1. Company Overview
13.13.2. Products/Services Offered
13.13.3. Financial Overview
13.13.4. Key Developments
13.13.5. SWOT Analysis
13.13.6. Key Strategies
13.14. Wärtsilä
13.14.1. Company Overview
13.14.2. Products/Services Offered
13.14.3. Financial Overview
13.14.4. Key Developments
13.14.5. SWOT Analysis
13.14.6. Key Strategies
14. Appendix
14.1. References
14.2. Related Reports
14.3. List of Abbreviations
15. Industry Insights
Note: This table of contents is tentative and subject to change as the research progresses.
List of Tables
Table 1 Global Autonomous Ships Market, by Region, 2019–2030
Table 2 North America: Autonomous Ships Market, by Country, 2019–2030
Table 3 Europe: Autonomous Ships Market, by Country, 2019–2030
Table 4 Asia-Pacific: Autonomous Ships Market, by Country, 2019–2030
Table 5 Rest of the World: Autonomous Ships Market, by Country, 2019–2030
Table 6 Global Autonomous Ships Market Size, by Region, 2019–2030
Table 7 North America: Autonomous Ships Market Size, by Country, 2019–2030
Table 8 Europe: Autonomous Ships Market Size, by Country, 2019–2030
Table 9 Asia-Pacific: Autonomous Ships Market Size, by Country, 2019–2030
Table 10 Rest of the World: Autonomous Ships Market Size, by Country, 2019–2030
Table 11 Global Autonomous Ships Type Market, by Region, 2019–2030
Table 12 North America: Autonomous Ships Type Market, by Country, 2019–2030
Table 13 Europe: Autonomous Ships Type Market, by Country, 2019–2030
Table 14 Asia-Pacific: Autonomous Ships Type Market, by Country, 2019–2030
Table 15 Rest of the World: Autonomous Ships Type Market, by Country, 2019–2030
Table 16 Global Autonomous Ships Autonomy Market, by Region, 2019–2030
Table 17 North America: Autonomous Ships Autonomy Market, by Country, 2019–2030
Table 18 Europe: Autonomous Ships Autonomy Market, by Country, 2019–2030
Table 19 Asia-Pacific: Autonomous Ships Autonomy Market, by Country, 2019–2030
Table 20 Rest of the World: Autonomous Ships Autonomy Market, by Country, 2019–2030
Table 21 Global Autonomous Ships Fit Market, by Region, 2019–2030
Table 22 North America: Autonomous Ships Fit Market, by Country, 2019–2030
Table 23 Europe: Autonomous Ships Fit Market, by Country, 2019–2030
Table 24 Asia-Pacific: Autonomous Ships Fit Market, by Country, 2019–2030
Table 25 Rest of the World: Autonomous Ships Fit Market, by Country, 2019–2030
Table 26 Global Autonomous Ships Solution Market, by Region, 2019–2030
Table 27 North America: Autonomous Ships Solution Market, by Country, 2019–2030
Table 28 Europe: Autonomous Ships Solution Market, by Country, 2019–2030
Table 29 Asia-Pacific: Autonomous Ships Solution Market, by Country, 2019–2030
Table 30 Rest of the World: Autonomous Ships Solution Market, by Country, 2019–2030
Table 31 Global Autonomous Ships Market, by Region, 2019–2030
Table 32 Global Autonomous Ships Market, by Ship Type, 2019–2030
Table 33 Global Autonomous Ships Market, by Autonomy, 2019–2030
Table 34 Global Autonomous Ships Market, by Fit, 2019–2030
Table 35 Global Autonomous Ships Market, by Solution, 2019–2030
Table 36 North America: Autonomous Ships Market, by Country, 2019–2030
Table 37 North America: Autonomous Ships Market, by Ship Type, 2019–2030
Table 38 North America: Autonomous Ships Market, by Autonomy, 2019–2030
Table 39 North America: Autonomous Ships Market, by Fit, 2019–2030
Table 40 North America: Autonomous Ships Market, by Solution, 2019–2030
Table 41 Europe: Autonomous Ships Market, by Country, 2019–2030
Table 42 Europe: Autonomous Ships Market, by Ship Type, 2019–2030
Table 43 Europe: Autonomous Ships Market, by Autonomy, 2019–2030
Table 44 Europe: Autonomous Ships Market, by Fit, 2019–2030
Table 45 Europe: Autonomous Ships Market, by Solution, 2019–2030
Table 46 Asia-Pacific: Autonomous Ships Market, by Country, 2019–2030
Table 47 Asia-Pacific: Autonomous Ships Market, by Ship Type, 2019–2030
Table 48 Asia-Pacific: Autonomous Ships Market, by Autonomy, 2019–2030
Table 49 Asia-Pacific: Autonomous Ships Market, by Fit, 2019–2030
Table 50 Asia-Pacific: Autonomous Ships Market, by Solution, 2019–2030
Table 51 Rest of the World: Autonomous Ships Market, by Region, 2019–2030
Table 52 Rest of the World: Autonomous Ships Market, by Ship Type, 2019–2030
Table 53 Rest of the World: Autonomous Ships Market, by Autonomy, 2019–2030
Table 54 Rest of the World: Autonomous Ships Market, by Fit, 2019–2030
Table 55 Rest of the World: Autonomous Ships Market, by Solution, 2019–2030
List of Figures
FIGURE 1 Research Process of MRFR
FIGURE 2 Top-Down & Bottom-Up Approaches
FIGURE 3 Market Dynamics
FIGURE 4 Impact Analysis: Market Drivers
FIGURE 5 Impact Analysis: Market Restraints
FIGURE 6 Porter's Five Forces Analysis
FIGURE 7 Value Chain Analysis
FIGURE 8 Global Autonomous Ships Market Share, by Ship Type, 2018 (%)
FIGURE 9 Global Autonomous Ships Market, by Ship Type, 2019–2030 (USD Million)
FIGURE 10 Global Autonomous Ships Market Share, by Autonomy, 2018 (%)
FIGURE 11 Global Autonomous Ships Market, by Autonomy, 2019–2030 (USD Million)
FIGURE 12 Global Autonomous Ships Market Share, by Fit, 2018 (%)
FIGURE 13 Global Autonomous Ships Market, by Fit, 2019–2030 (USD Million)
FIGURE 14 Global Autonomous Ships Market Share, by Solution, 2018 (%)
FIGURE 15 Global Autonomous Ships Market, by Solution, 2019–2030 (USD Million)
FIGURE 16 Global Autonomous Ships Market Share (%), by Region, 2018
FIGURE 17 Global Autonomous Ships Market, by Region, 2019–2030 (USD Million)
FIGURE 18 North America: Autonomous Ships Market Share (%), 2018
FIGURE 19 North America: Autonomous Ships Market, by Country, 2019–2030 (USD Million)
FIGURE 20 Europe: Autonomous Ships Market Share (%), 2018
FIGURE 21 Europe: Autonomous Ships Market, by Country, 2019–2030 (USD Million)
FIGURE 22 Asia-Pacific: Autonomous Ships Market Share (%), 2018
FIGURE 23 Asia-Pacific: Autonomous Ships Market, by Country, 2019–2030 (USD Million)
FIGURE 24 Rest of the World: Autonomous Ships Market Share (%), 2018
FIGURE 25 Rest of the World: Autonomous Ships Market, by Region, 2019–2030 (USD Million)