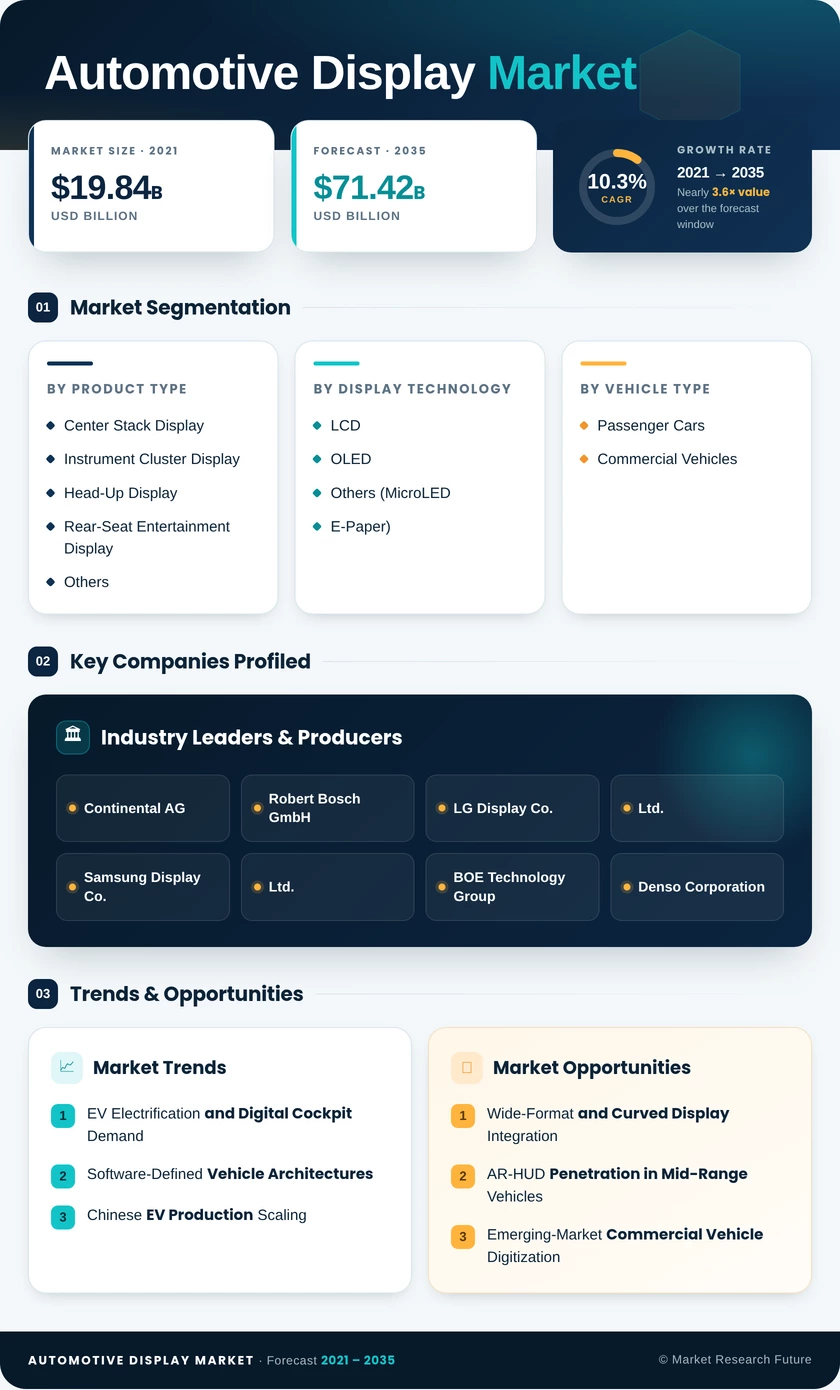
ID: MRFR/AM/5489-HCR | February, 2021 | Region : Global
Market Synopsis
Globally, the automotive display market is expected to grow from USD 11 billion in 2017 to USD 23 billion by 2023, at a CAGR of 13% during the forecast period. Increasing demand for connected vehicles, increasing dependency of navigations systems, and increasing demand for infotainment in automobile are some major factors which are expected to drive the market during forecast period. Growing in-vehicle safety and comfort also contributed to the growth of automotive display applications. However, high cost of advanced automotive display systems and safety concerns related to replacement of mechanical controls with touch screen display is expected to restrain the market growth during the forecast period.
The automotive display is a touch screen display device that provides distraction free access to navigation, driver safety features, and multimedia function for vehicles including engine heat indicators, and tire pressure among others. Panasonic Corporation is one of the major manufacturers of automotive display. Company provides solutions such as head-up for safety, entertainment and connectivity, and battery innovations and services such as audio services, autonomous services, connectivity services, electronic components, EV HEV energy, infotainment, and vision & sensing. Further, in February 2018, Panasonic corporation partnered with Trend Micro to develop cyber security solution for connected cars. This partnership is aimed to control driving behavior such as steering and breaking, acceleration, and in-vehicle infotainment. This overall development enables provision of solution including in-vehicle and cloud systems for cyber-attacks against autonomous and connected cars.
Global Automotive Display Market
Source: MRFR Analysis
Segmentation
The global automotive display industry is segmented into type, technology, display size, applications and region.
By type, the market is segmented into rear seat entertainment touchscreen display, center stack touchscreen display, advanced instrument cluster display, and others.
By technology, the market is segmented into TFT LCD, PMOLED, PMLCD, AMOLED, and others.
By display size, the market is segmented into 3”-5”, 6”-10”, and >10”.
By applications, the market is segmented telematics, infotainment, navigation, others.
By region, the market is segmented into North America, Europe, Asia-Pacific, and the rest of the world.
Regional Analysis
The global market for automotive display is estimated to grow at a significant rate during the forecast period from 2018 to 2023. The geographical analysis of global automotive display market is studied for North America, Europe, Asia-Pacific, and the rest of the world.
Europe is expected to dominate the global In-Vehicle display market during the forecast period. Germany, the UK, and France are expected to dominate the automotive display solution market in Europe. Large number of car manufacturers such as Audi, BMW, Porche, Lamborgini are expected to drive the display market in Europe.
Asia-Pacific is expected to grow at faster rate during forecast period. Japan, China, and South Korea are expected to dominate the automotive display solutions market during forecast period. Presence of telecommunication industries such as Huawei, China Telecom., and Bharti Airtel drives the automotive display market in Asia-Pacific.
Competitive Analysis
According to the latest trend in the automotive display market, most enterprises are expanding their technological capabilities to adopt different IoT solutions and better automatic display operations. Most of the companies have adopted inorganic strategies to expand their businesses, where partnership and collaboration accounted for significant market share, whereas merger & acquisition accounted for the overall key development undergone by the key players in the market.
Key Players
The key players in the automotive display Industry are identified across all the major regions based on their country of origin, presence across different regions, recent key developments, product diversification, and industry expertise. Some of them are – LG Display Co. Ltd (South Korea), Panasonic Corporation (Japan), Delphi Technologies (UK), Robert Bosch GmbH (Germany), Visteon Corporation (US), Continental AG (Germany), 3M Company (US), Nippon Seiki Co. Ltd (Japan), Magneti Marelli S.p.A (Italy), and Qualcomm Technologies Inc (US) These players contribute a major share in the growth of automotive display market.
Apart from the top key players, there are other players that contribute to the market growth. These include Denso Corporation (Japan), Synaptics Incorporated (US), and Nidec Corporation (Japan), among others.
Intended Audience
TABLE OF CONTENTS
1. Executive Summary
2. Scope of the Report
2.1. Market Definition
2.2. Scope of the Study
2.2.1. Research Objectives
2.2.2. Assumptions & Limitations
2.3. Markets Structure
3. Market Research Methodology
3.1. Research Process
3.2. Secondary Research
3.3. Primary Research
3.4. Forecast Model
4. Market Landscape
4.1. Porter’s Five Forces Analysis
4.1.1. Threat of New Entrants
4.1.2. Bargaining power of buyers
4.1.3. Threat of substitutes
4.1.4. Rivalry
4.1.5. Bargaining Power of Suppliers
4.2. Value Chain/Supply Chain of Automotive Display Market
5. Market Overview of Automotive Display Market
5.1. Introduction
5.2. Growth Drivers
5.3. Impact Analysis
5.4. Market Challenges
6. Market Trends
6.1. Introduction
6.2. Growth Trends
6.3. Impact Analysis
7. Automotive Display Market, by Type
7.1. Introduction
7.2. Rear Seat Entertainment Touchscreen Display
7.2.1. Market Estimates & Forecast, 2018–2023
7.2.2. Market Estimates & Forecast, by Region, 2018–2023
7.3. Center Stack Touchscreen Display
7.3.1. Market Estimates & Forecast, 2018–2023
7.3.2. Market Estimates & Forecast, by Region, 2018–2023
7.4. Advanced Instrument Cluster Display
7.4.1. Market Estimates & Forecast, 2018–2023
7.4.2. Market Estimates & Forecast, by Region, 2018–2023
7.5. Others
7.5.1. Market Estimates & Forecast, 2018–2023
7.5.2. Market Estimates & Forecast, by Region, 2018–2023
8. Automotive Display Market, by Technology
8.1. Introduction
8.2. TFT LCD
8.2.1. Market Estimates & Forecast, 2018–2023
8.2.2. Market Estimates & Forecast, by Region, 2018–2023
8.3. PMOLED
8.3.1. Market Estimates & Forecast, 2018–2023
8.3.2. Market Estimates & Forecast, by Region, 2018–2023
8.4. PMLCD
8.4.1. Market Estimates & Forecast, 2018–2023
8.4.2. Market Estimates & Forecast, by Region, 2018–2023
8.5. AMOLED
8.5.1. Market Estimates & Forecast, 2018–2023
8.5.2. Market Estimates & Forecast, by Region, 2018–2023
8.6. Others
8.6.1. Market Estimates & Forecast, 2018–2023
8.6.2. Market Estimates & Forecast, by Region, 2018–2023
9. Automotive Display Market, by Display Size
9.1. Introduction
9.2. 3”-5”
9.2.1. Market Estimates & Forecast, 2018–2023
9.2.2. Market Estimates & Forecast, by Region, 2018–2023
9.3. 6”-10”
9.3.1. Market Estimates & Forecast, 2018–2023
9.3.2. Market Estimates & Forecast, by Region, 2018–2023
9.4. >10”
9.4.1. Market Estimates & Forecast, 2018–2023
9.4.2. Market Estimates & Forecast, by Region, 2018–2023
10. Automotive Display Market, by Applications
10.1. Introduction
10.2. Infotainment
10.2.1. Market Estimates & Forecast, 2018–2023
10.2.2. Market Estimates & Forecast, by Region, 2018–2023
10.3. Navigation
10.3.1. Market Estimates & Forecast, 2018–2023
10.3.2. Market Estimates & Forecast, by Region, 2018–2023
10.4. Blind Spot Detection
10.4.1. Market Estimates & Forecast, 2018–2023
10.4.2. Market Estimates & Forecast, by Region, 2018–2023
10.5. Telematics
10.5.1. Market Estimates & Forecast, 2018–2023
10.5.2. Market Estimates & Forecast, by Region, 2018–2023
10.6. Others
10.6.1. Market Estimates & Forecast, 2018–2023
10.6.2. Market Estimates & Forecast, by Region, 2018–2023
11. Automotive Display Market, by Region
11.1. Introduction
11.2. North America
11.2.1. Market Estimates & Forecast, by Country 2018–2023
11.2.2. Market Estimates & Forecast, by Type, 2018–2023
11.2.3. Market Estimates & Forecast, by Technology, 2018–2023
11.2.4. Market Estimates & Forecast, by Display Size, 2018–2023
11.2.5. Market Estimates & Forecast, by Application, 2018–2023
11.2.6. US
11.2.6.1. Market Estimates & Forecast, by Type, 2018–2023
11.2.6.2. Market Estimates & Forecast, by Technology, 2018–2023
11.2.6.3. Market Estimates & Forecast, by Display Size, 2018–2023
11.2.6.4. Market Estimates & Forecast, by Application, 2018–2023
11.2.7. Mexico
11.2.7.1. Market Estimates & Forecast, by Type, 2018–2023
11.2.7.2. Market Estimates & Forecast, by Technology, 2018–2023
11.2.7.3. Market Estimates & Forecast, by Display Size, 2018–2023
11.2.7.4. Market Estimates & Forecast, by Application, 2018–2023
11.2.8. Canada
11.2.8.1. Market Estimates & Forecast, by Type, 2018–2023
11.2.8.2. Market Estimates & Forecast, by Technology, 2018–2023
11.2.8.3. Market Estimates & Forecast, by Display Size, 2018–2023
11.2.8.4. Market Estimates & Forecast, by Application, 2018–2023
11.3. Europe
11.3.1. Market Estimates & Forecast, by Country 2018–2023
11.3.2. Market Estimates & Forecast, by Type, 2018–2023
11.3.3. Market Estimates & Forecast, by Technology, 2018–2023
11.3.4. Market Estimates & Forecast, by Display Size, 2018–2023
11.3.5. Market Estimates & Forecast, by Application, 2018–2023
11.3.6. Germany
11.3.6.1. Market Estimates & Forecast, by Type, 2018–2023
11.3.6.2. Market Estimates & Forecast, by Technology, 2018–2023
11.3.6.3. Market Estimates & Forecast, by Display Size, 2018–2023
11.3.6.4. Market Estimates & Forecast, by Application, 2018–2023
11.3.7. France
11.3.7.1. Market Estimates & Forecast, by Type, 2018–2023
11.3.7.2. Market Estimates & Forecast, by Technology, 2018–2023
11.3.7.3. Market Estimates & Forecast, by Display Size, 2018–2023
11.3.7.4. Market Estimates & Forecast, by Application, 2018–2023
11.3.8. UK
11.3.8.1. Market Estimates & Forecast, by Type, 2018–2023
11.3.8.2. Market Estimates & Forecast, by Technology, 2018–2023
11.3.8.3. Market Estimates & Forecast, by Display Size, 2018–2023
11.3.8.4. Market Estimates & Forecast, by Application, 2018–2023
11.3.9. Rest of Europe
11.3.9.1. Market Estimates & Forecast, by Type, 2018–2023
11.3.9.2. Market Estimates & Forecast, by Technology, 2018–2023
11.3.9.3. Market Estimates & Forecast, by Display Size, 2018–2023
11.3.9.4. Market Estimates & Forecast, by Application, 2018–2023
11.4. Asia-Pacific
11.4.1. Market Estimates & Forecast, by Country 2018–2023
11.4.2. Market Estimates & Forecast, by Type, 2018–2023
11.4.3. Market Estimates & Forecast, by Technology, 2018–2023
11.4.4. Market Estimates & Forecast, by Display Size, 2018–2023
11.4.5. Market Estimates & Forecast, by Application, 2018–2023
11.4.6. China
11.4.6.1. Market Estimates & Forecast, by Type, 2018–2023
11.4.6.2. Market Estimates & Forecast, by Technology, 2018–2023
11.4.6.3. Market Estimates & Forecast, by Display Size, 2018–2023
11.4.6.4. Market Estimates & Forecast, by Application, 2018–2023
11.4.7. Japan
11.4.7.1. Market Estimates & Forecast, by Type, 2018–2023
11.4.7.2. Market Estimates & Forecast, by Technology, 2018–2023
11.4.7.3. Market Estimates & Forecast, by Display Size, 2018–2023
11.4.7.4. Market Estimates & Forecast, by Application, 2018–2023
11.4.8. India
11.4.8.1. Market Estimates & Forecast, by Type, 2018–2023
11.4.8.2. Market Estimates & Forecast, by Technology, 2018–2023
11.4.8.3. Market Estimates & Forecast, by Display Size, 2018–2023
11.4.8.4. Market Estimates & Forecast, by Application, 2018–2023
11.4.9. Rest of Asia-Pacific
11.4.9.1. Market Estimates & Forecast, by Type, 2018–2023
11.4.9.2. Market Estimates & Forecast, by Technology, 2018–2023
11.4.9.3. Market Estimates & Forecast, by Display Size, 2018–2023
11.4.9.4. Market Estimates & Forecast, by Application, 2018–2023
11.5. Rest of the World
11.5.1. Market Estimates & Forecast, by Country 2018–2023
11.5.2. Market Estimates & Forecast, by Type, 2018–2023
11.5.3. Market Estimates & Forecast, by Technology, 2018–2023
11.5.4. Market Estimates & Forecast, by Display Size, 2018–2023
11.5.5. Market Estimates & Forecast, by Application, 2018–2023
11.5.6. Middle East & Africa
11.5.6.1. Market Estimates & Forecast, by Type, 2018–2023
11.5.6.2. Market Estimates & Forecast, by Technology, 2018–2023
11.5.6.3. Market Estimates & Forecast, by Display Size, 2018–2023
11.5.6.4. Market Estimates & Forecast, by Application, 2018–2023
11.5.7. Latin Countries
11.5.7.1. Market Estimates & Forecast, by Type, 2018–2023
11.5.7.2. Market Estimates & Forecast, by Technology, 2018–2023
11.5.7.3. Market Estimates & Forecast, by Display Size, 2018–2023
11.5.7.4. Market Estimates & Forecast, by Application, 2018–2023
12. Company Profiles
12.1. LG Display Co., Ltd.
12.1.1. Company Overview
12.1.2. Type/Business Segment Overview
12.1.3. Financial Updates
12.1.4. Key Developments
12.2. Panasonic Corporation
12.2.1. Company Overview
12.2.2. Type/Business Segment Overview
12.2.3. Financial Updates
12.2.4. Key Developments
12.3. Delphi Technologies
12.3.1. Company Overview
12.3.2. Type/Business Segment Overview
12.3.3. Financial Updates
12.3.4. Key Developments
12.4. Robert Bosch GmbH
12.4.1. Company Overview
12.4.2. Type/Business Segment Overview
12.4.3. Financial Updates
12.4.4. Key Developments
12.5. Visteon Corporation
12.5.1. Company Overview
12.5.2. Type/Business Segment Overview
12.5.3. Financial Updates
12.5.4. Key Developments
12.6. Continental AG
12.6.1. Company Overview
12.6.2. Type/Business Segment Overview
12.6.3. Financial Updates
12.6.4. Key Developments
12.7. 3M Company
12.7.1. Company Overview
12.7.2. Type/Business Segment Overview
12.7.3. Financial Updates
12.7.4. Key Developments
12.8. Nippon Seiki Co., Ltd
12.8.1. Company Overview
12.8.2. Type/Business Segment Overview
12.8.3. Financial Updates
12.8.4. Key Developments
12.9. Magneti Marelli S.p.A
12.9.1. Company Overview
12.9.2. Type/Business Segment Overview
12.9.3. Financial Updates
12.9.4. Key Developments
12.10. Denso Corporation
12.10.1. Company Overview
12.10.2. Type/Business Segment Overview
12.10.3. Financial Updates
12.10.4. Key Developments
LIST OF TABLES
Table1 Global Automotive Display Market, by Country, 2018-2023
Table2 North America: Automotive Display Market, by Country, 2018–2023
Table3 Europe: Automotive Display Market, by Country, 2018–2023
Table4 Asia-Pacific: Automotive Display Market, by Country, 2018–2023
Table5 Rest of the World: Automotive Display Market, by Region, 2018–2023
Table6 North America: Automotive Display Market, by Country
Table7 North America: Automotive Display Market, by Type
Table8 North America: Automotive Display Market, by Technology
Table9 North America: Automotive Display Market, by Display Size
Table10 North America: Automotive Display Market, by Application
Table11 Europe: Automotive Display Market, by Country
Table12 Europe: Automotive Display Market, by Type
Table13 Europe: Automotive Display Market, by Technology
Table14 Europe: Automotive Display Market, by Display Size
Table15 Europe: Automotive Display Market, by Application
Table16 Asia-Pacific: Automotive Display Market, by Country
Table17 Asia-Pacific Automotive Display Market, by Type
Table18 Asia-Pacific Automotive Display Market, by Technology
Table19 Asia-Pacific Automotive Display Market, by Display Size
Table20 Asia-Pacific Automotive Display Market, by Application
Table21 Rest of the world: Automotive Display Market, by Country
Table22 Rest of the world: Automotive Display Market, by Type
Table23 Rest of the world: Automotive Display Market, by Technology
Table24 Rest of the world: Automotive Display Market, by Display Size
Table25 Rest of the world: Automotive Display Market, by Application
LIST OF FIGURES
Figure 1 Global Automotive Display Market segmentation
Figure 2 Forecast Methodology
Figure 3 Porter’s Five Forces Analysis of Global Automotive Display Market
Figure 4 Value Chain of Global Automotive Display Market
Figure 5 Share of Automotive Display Market in 2018, by country (in %)
Figure 6 Global Automotive Display Market, 2018–2023
Figure 7 Share of Global Automotive Display Market by Industry, 2018–2023
Figure 8 Global Automotive Display Market Size, by Type, 2018
Figure 9 Share of Global Automotive Display Market, by Type, 2018–2023
Figure 10 Global Automotive Display Market Size, by Technology, 2018
Figure 11 Share of Global Automotive Display Market, by Technology, 2018–2023
Figure 12 Global Automotive Display Market Size, by Display Size, 2018
Figure 13 Share of Global Automotive Display Market, by display Size, 2018–2023
Figure 14 Global Automotive Display Market Size, by Application, 2018
Figure 15 Share of Global Automotive Display Market, by Application, 2018–2023