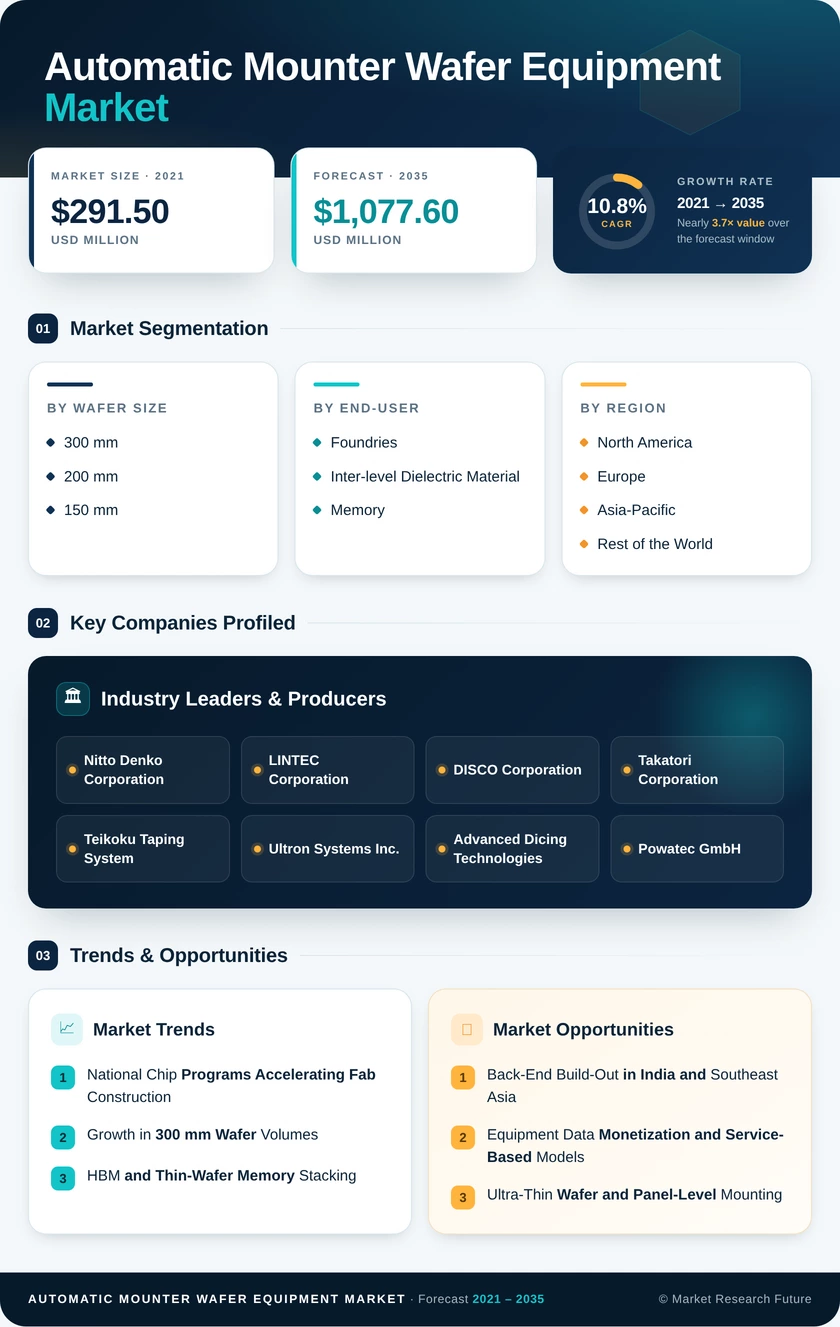
Automatic Mounter Wafer Equipment Market (2026 โ€“ 2035)

ID: MRFR/SEM/41129-HCR 200 Pages Nirmit Biswas Last Updated: September 24, 2026
Automatic Mounter Wafer Equipment Market Size, Share and Research Report By Wafer Size (300 mm, 200 mm, 150 mm), By End-User (Foundries, Inter-level Dielectric Material, Memory) and By Regional (North America, Europe, Asia-Pacific, South America, Middle East & Africa) - Industry Forecast to 2035.
Automatic Mounter Wafer Equipment Market
Market Size
Forecast Period2026-2035
CAGR (2026-2035)10.8%
2025 Market SizeUSD 386.4 Million
2035 Market SizeUSD 1,077.6 Million
Key Players
Nitto Denko Corporation
LINTEC Corporation
DISCO Corporation
Takatori Corporation
Teikoku Taping System
Ultron Systems Inc.
Opportunities
  • Back-End Build-Out in India and Southeast Asia
  • Equipment Data Monetization and Service-Based Models
  • Ultra-Thin Wafer and Panel-Level Mounting
  1. 1 Market Summary | |
  2. 2 Key Report Takeaways | |
    1. 2.1 By Wafer Size | |
    2. 2.2 By End-User | |
    3. 2.3 By Region | |
  3. 3 Market Size and Forecast (2021โ€“2035) | |
  4. 4 Driver Impact Analysis | |
    1. 4.1 National Chip Programs Accelerating Fab Construction | |
    2. 4.2 Growth in 300 mm Wafer Volumes | |
    3. 4.3 HBM and Thin-Wafer Memory Stacking | |
    4. 4.4 Advanced Packaging and Chiplet Adoption | |
    5. 4.5 Power Semiconductors and the 200 mm Silicon Carbide Transition | |
    6. 4.6 Yield Pressure and Labor Constraints Favoring Automation | |
    7. 4.7 Expanding Consumer Electronics and Mobile Penetration | |
  5. 5 Restraints Impact Analysis | |
    1. 5.1 High Capital Cost of Fully Automatic Mounters | |
    2. 5.2 Semiconductor Cyclicality and Memory Downturns | |
    3. 5.3 Export Controls and Trade Restrictions | |
    4. 5.4 Concentrated Supply of Dicing Tapes and Consumables | |
    5. 5.5 Skilled Technician Shortages and Integration Complexity | |
  6. 6 Opportunities | |
    1. 6.1 Back-End Build-Out in India and Southeast Asia | |
    2. 6.2 Equipment Data Monetization and Service-Based Models | |
    3. 6.3 Ultra-Thin Wafer and Panel-Level Mounting | |
    4. 6.4 Retrofit and Upgrade Demand in 200 mm Fabs | |
    5. 6.5 New Semiconductor Hubs in the Middle East | |
  7. 7 Regional Market Share and Country-Level Analysis | |
    1. 7.1 North America | | |
      1. 7.1.1 US | | |
      2. 7.1.2 Canada | | |
      3. 7.1.3 Mexico | |
    2. 7.2 Europe | | |
      1. 7.2.1 Germany | | |
      2. 7.2.2 UK | | |
      3. 7.2.3 France | | |
      4. 7.2.4 Italy | | |
      5. 7.2.5 Spain | | |
      6. 7.2.6 Nordic Countries | | |
      7. 7.2.7 Russia | | |
      8. 7.2.8 Rest of Europe | |
    3. 7.3 Asia-Pacific | | |
      1. 7.3.1 China | | |
      2. 7.3.2 Japan | | |
      3. 7.3.3 South Korea | | |
      4. 7.3.4 India | | |
      5. 7.3.5 ASEAN | | |
      6. 7.3.6 Rest of Asia-Pacific | |
    4. 7.4 Rest of the World | | |
      1. 7.4.1 Brazil | | |
      2. 7.4.2 Argentina | | |
      3. 7.4.3 Rest of South America | | |
      4. 7.4.4 Saudi Arabia | | |
      5. 7.4.5 UAE | | |
      6. 7.4.6 South Africa | | |
      7. 7.4.7 Egypt | | |
      8. 7.4.8 Rest of MEA | |
  8. 8 Future Outlook (2026โ€“2035) | |
    1. 8.1 AI-Driven Process Control and Lights-Out Back-End Lines | |
    2. 8.2 Heterogeneous Integration Redefining Tool Specifications | |
    3. 8.3 Supply Chain Regionalization | |
    4. 8.4 Sustainability and Consumable Reduction | |
  9. 9 Segmentation Analysis | |
    1. 9.1 By Wafer Size | | |
      1. 9.1.1 300 mm | | |
      2. 9.1.2 200 mm | | |
      3. 9.1.3 150 mm | |
    2. 9.2 By End-User | | |
      1. 9.2.1 Foundries | | |
      2. 9.2.2 Inter-level Dielectric Material | | |
      3. 9.2.3 Memory | |
  10. 10 Competitive Landscape | |
    1. 10.1 Market Concentration Analysis | |
    2. 10.2 Competitive Benchmarking Table | |
    3. 10.3 Company Profiles | | |
      1. 10.3.1 Nitto Denko Corporation | | |
      2. 10.3.2 LINTEC Corporation | | |
      3. 10.3.3 DISCO Corporation | | |
      4. 10.3.4 Takatori Corporation | | |
      5. 10.3.5 Teikoku Taping System | | |
      6. 10.3.6 Ultron Systems Inc. | | |
      7. 10.3.7 Advanced Dicing Technologies | | |
      8. 10.3.8 Powatec GmbH | | |
      9. 10.3.9 Semiconductor Equipment Corporation | | |
      10. 10.3.10 Syagrus Systems | |
  11. 11 Recent News & Developments | |
  12. 12 Report Scope and Methodology | |
  13. 13 Detailed Sources and Citations | |
  14. 14 Frequently Asked Questions (FAQs) | | LIST OF TABLES | |
  15. TABLE 1 Market Snapshot, 2025 and 2035 | |
  16. TABLE 2 Global Market Size & Forecast, by Revenue (USD Million), 2021โ€“2035 | |
  17. TABLE 3 Driver Impact Analysis, 2026โ€“2035 | |
  18. TABLE 4 Restraints Impact Analysis, 2026โ€“2035 | |
  19. TABLE 5 Regional Summary, 2025 | |
  20. TABLE 6 North America Market, by Country, 2025 | |
  21. TABLE 7 Europe Market, by Country, 2025 | |
  22. TABLE 8 Asia-Pacific Market, by Country, 2025 | |
  23. TABLE 9 Rest of the World Market, by Country, 2025 | |
  24. TABLE 10 Market Segmentation, by Wafer Size, 2025 | |
  25. TABLE 11 Market Segmentation, by End-User, 2025 | |
  26. TABLE 12 Competitive Benchmarking Matrix, 2025 | |
  27. TABLE 13 Report Scope and Methodology | |
  28. TABLE 14 Detailed Sources and Citations | |
  29. TABLE 15 Segmentation Quick Reference | | LIST OF FIGURES | |
  30. FIGURE 1 Market Dynamics Overview (Drivers, Restraints, Opportunities) | |
  31. FIGURE 2 Industry Value Chain Analysis | |
  32. FIGURE 3 Porter's Five Forces Analysis | |
  33. FIGURE 4 Global Market Size Trend, 2021โ€“2035 (USD Million) | |
  34. FIGURE 5 Year-over-Year Growth Analysis, 2021โ€“2035 | |
  35. FIGURE 6 Market Share, by Wafer Size, 2025 | |
  36. FIGURE 7 Market Share, by End-User, 2025 | |
  37. FIGURE 8 Regional Market Share, 2025 | |
  38. FIGURE 9 Asia-Pacific Market Share, by Country, 2025 | |
  39. FIGURE 10 Competitive Landscape: Estimated Revenue Share Ranges, 2025 | |
  40. FIGURE 11 Competitive Positioning Matrix

Segmentation Quick Reference

DimensionSub-SegmentsDominant SegmentFastest Growing Segment
By Wafer Size300 mm, 200 mm, 150 mm300 mm (58.4% share)200 mm (12.4% CAGR)
By End-UserFoundries, Inter-level Dielectric Material, MemoryFoundries (47.6% share)Memory (11.9% CAGR)
By RegionNorth America, Europe, Asia-Pacific, Rest of the WorldNorth America (35.2% share)Asia-Pacific (12.9% CAGR)

ย 

Market Segmentation Overview

By Wafer Size

Sub-SegmentKey Trend
300 mmAutomatic cassette transfer and warpage control for HBM, logic and 3D NAND wafers
200 mmSiC and analog migration replacing semi-automatic mounters
150 mmStable demand from compound semiconductor, LED and MEMS lines

ย 

300 mm leads with a 58.4% share because advanced logic, DRAM and HBM production is built on these substrates, and each tool carries premium automation. 200 mm grows fastest at a 12.4% CAGR as silicon carbide and analog producers move from 150 mm and replace semi-automatic mounters to protect brittle, costly wafers. 150 mm persists in compound semiconductor and MEMS lines but loses share steadily.

By End-User

Sub-SegmentKey Trend
FoundriesIn-house advanced packaging raising mounter counts per fab
Inter-level Dielectric MaterialLow-stress lamination for fragile low-k film stacks
MemoryHBM stacking driving ultra-thin wafer mounting

ย 

Foundries lead with a 47.6% share, reflecting the volume of logic wafers taped and diced at TSMC, Samsung Foundry and SMIC, increasingly within their own packaging operations. Memory grows fastest at an 11.9% CAGR because HBM stacks require wafers thinned to 30โ€“50 ยตm and mounted with tight tension control. Inter-level Dielectric Material wafers, carrying fragile low-k layers, sustain specialized demand for gentle lamination.


ย 

ย 

ย 

ย 

ย 

ย 

ย 

ย 

ย 

ย 

Download PDF ×

We do not share your information with anyone. However, we may send you emails based on your report interest from time to time. You may contact us at any time to opt-out.