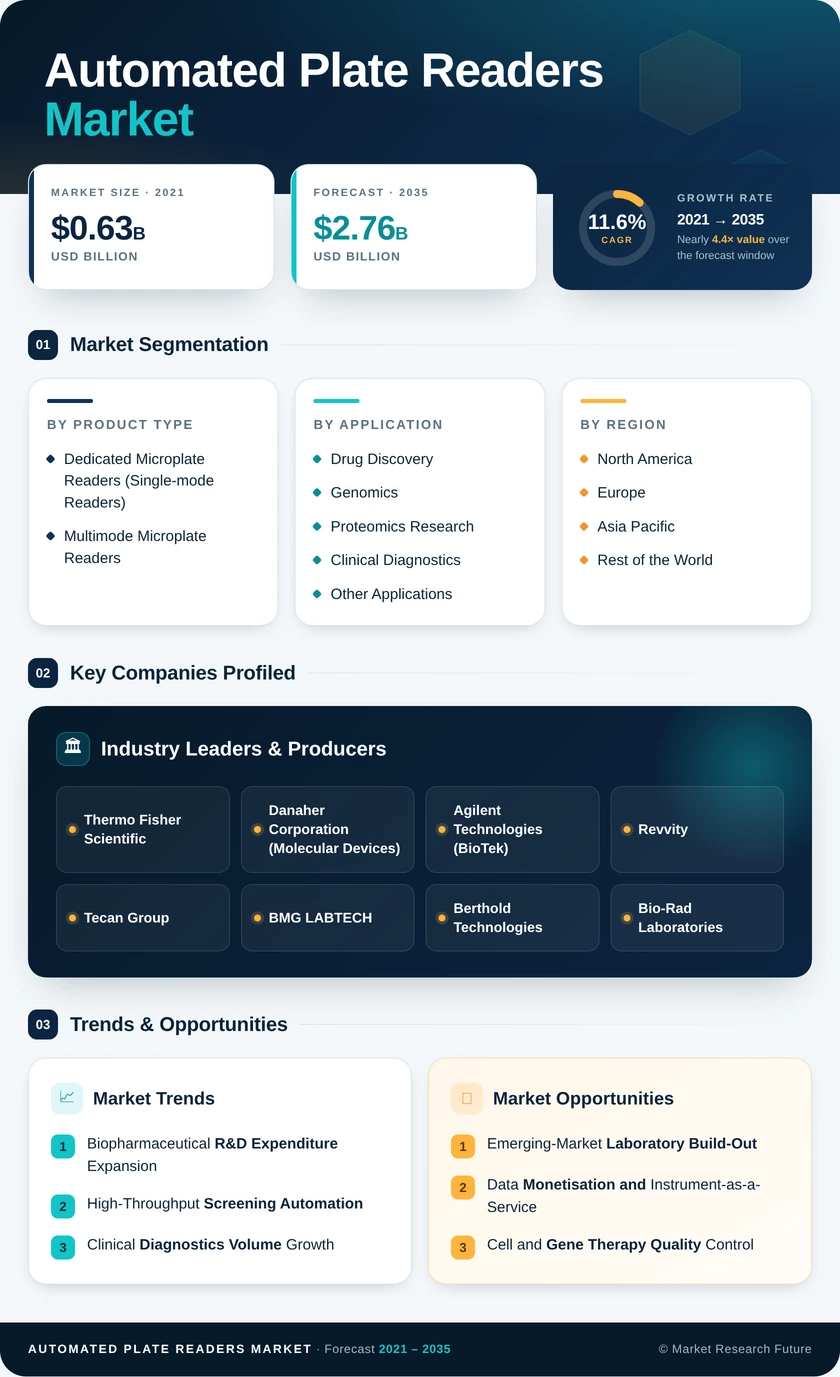
Automated Plate Readers Market (2026 – 2035)

ID: MRFR/SEM/41127-HCR 200 Pages Aarti Dhapte Last Updated: September 22, 2026
Automated Plate Readers Market Size, Share and Research Report By Technology (Fixed Automated Plate Readers, Mobile Automated Plate Readers, Portable Automated Plate Readers), By End User (Healthcare Institutions, Research Laboratories, Pharmaceutical Companies, Educational Institutions), By Application (Drug Discovery, Clinical Diagnostics, Genomic Research), By Detection Method (Fluorescence Detection, Luminescence Detection, Absorbance Detection) andBy Regional (North America, Europe, South America, Asia Pacific, Middle East and Africa)- Industry Forecast Till 2035
Automated Plate Readers Market
Market Size
Forecast Period2026-2035
CAGR (2026-2035)11.6%
2025 Market SizeUSD 0.92 Billion
2035 Market SizeUSD 2.76 Billion
Key Players
Thermo Fisher Scientific
Danaher Corporation
Agilent Technologies
Revvity
Tecan Group
BMG LABTECH
Opportunities
  • Emerging-Market Laboratory Build-Out
  • Data Monetisation and Instrument-as-a-Service
  • Cell and Gene Therapy Quality Control
  1. 1 Market Summary | |
    1. 1.1 Study Assumptions & Market Definition | |
    2. 1.2 Scope of the Study | |
    3. 1.3 Research Methodology | |
  2. 2 Key Report Takeaways | |
    1. 2.1 By Product Type | |
    2. 2.2 By Application | |
    3. 2.3 By Region | |
  3. 3 Market Size and Forecast (2021–2035) | |
    1. 3.1 Historical Market Size (2021–2024) | |
    2. 3.2 Base Year Assessment (2025) | |
    3. 3.3 Forecast Market Size (2026–2035) | |
    4. 3.4 Year-over-Year Growth Analysis | |
  4. 4 Driver Impact Analysis | |
    1. 4.1 Biopharmaceutical R&D Expenditure Expansion | |
    2. 4.2 High-Throughput Screening Automation | |
    3. 4.3 Clinical Diagnostics Volume Growth | |
    4. 4.4 Public Research Funding Programmes | |
    5. 4.5 Migration to Multimode Detection | |
    6. 4.6 Contract Research Capacity Build-Out | |
    7. 4.7 Software and Data-Analytics Attach | |
  5. 5 Restraints Impact Analysis | |
    1. 5.1 High Capital Cost of Multimode Systems | |
    2. 5.2 Instrument Interoperability Fragmentation | |
    3. 5.3 Long Replacement Cycles and Refurbished Supply | |
    4. 5.4 Component and Supply Chain Constraints | |
    5. 5.5 Clinical Validation and Regulatory Burden | |
  6. 6 Opportunities | |
    1. 6.1 Emerging-Market Laboratory Build-Out | |
    2. 6.2 Data Monetisation and Instrument-as-a-Service | |
    3. 6.3 Cell and Gene Therapy Quality Control | |
    4. 6.4 Label-Free and High-Content Detection Modules | |
    5. 6.5 AI-Assisted Assay Optimisation | |
  7. 7 Regional Market Share and Country-Level Analysis | |
    1. 7.1 North America | | |
      1. 7.1.1 US | | |
      2. 7.1.2 Canada | | |
      3. 7.1.3 Mexico | |
    2. 7.2 Europe | | |
      1. 7.2.1 Germany | | |
      2. 7.2.2 UK | | |
      3. 7.2.3 France | | |
      4. 7.2.4 Italy | | |
      5. 7.2.5 Spain | | |
      6. 7.2.6 Nordic Countries | | |
      7. 7.2.7 Russia | | |
      8. 7.2.8 Rest of Europe | |
    3. 7.3 Asia Pacific | | |
      1. 7.3.1 China | | |
      2. 7.3.2 India | | |
      3. 7.3.3 Japan | | |
      4. 7.3.4 South Korea | | |
      5. 7.3.5 ASEAN | | |
      6. 7.3.6 Rest of Asia-Pacific | |
    4. 7.4 Rest of the World | | |
      1. 7.4.1 Brazil | | |
      2. 7.4.2 Argentina | | |
      3. 7.4.3 Saudi Arabia | | |
      4. 7.4.4 UAE | | |
      5. 7.4.5 South Africa | | |
      6. 7.4.6 Egypt | | |
      7. 7.4.7 Rest of South America | | |
      8. 7.4.8 Rest of Middle East & Africa | |
  8. 8 Future Outlook (2026–2035) | |
    1. 8.1 Autonomous Laboratory Operations | |
    2. 8.2 Platform Economics and Consumable Attach | |
    3. 8.3 Decentralised and Near-Patient Diagnostics | |
    4. 8.4 Sustainability and Laboratory Energy Reporting | |
  9. 9 Segmentation Analysis | |
    1. 9.1 By Product Type | | |
      1. 9.1.1 Dedicated Microplate Readers (Single-mode Readers) | | |
      2. 9.1.2 Multimode Microplate Readers | |
    2. 9.2 By Application | | |
      1. 9.2.1 Drug Discovery | | |
      2. 9.2.2 Genomics and Proteomics Research | | |
      3. 9.2.3 Clinical Diagnostics | | |
      4. 9.2.4 Other Applications | |
  10. 10 Competitive Landscape | |
    1. 10.1 Market Concentration Analysis (2026) | |
    2. 10.2 Competitive Benchmarking Matrix | |
    3. 10.3 Company Profiles | |
  11. 11 Recent News and Developments | |
  12. 12 Report Scope and Methodology | |
  13. 13 Detailed Sources and Citations | |
  14. 14 Frequently Asked Questions (FAQs) | | LIST OF TABLES | |
  15. TABLE 1 Global Automated Plate Readers Market Size & Forecast, by Revenue (USD Billion), 2021–2035 | |
  16. TABLE 2 Global Automated Plate Readers Market – Year-over-Year Growth Analysis, 2021–2035 | |
  17. TABLE 3 Driver Impact Analysis – Estimated Contribution to CAGR, 2026–2035 | |
  18. TABLE 4 Restraint Impact Analysis – Estimated Drag on CAGR, 2026–2035 | |
  19. TABLE 5 Global Automated Plate Readers Market Size, by Region, 2021–2035 (USD Billion) | |
  20. TABLE 6 North America Automated Plate Readers Market Size, by Country, 2021–2035 (USD Billion) | |
  21. TABLE 7 Europe Automated Plate Readers Market Size, by Country, 2021–2035 (USD Billion) | |
  22. TABLE 8 Asia Pacific Automated Plate Readers Market Size, by Country, 2021–2035 (USD Billion) | |
  23. TABLE 9 Rest of the World Automated Plate Readers Market Size, by Country, 2021–2035 (USD Billion) | |
  24. TABLE 10 Global Automated Plate Readers Market Size, by Product Type, 2021–2035 (USD Billion) | |
  25. TABLE 11 Global Automated Plate Readers Market Size, by Application, 2021–2035 (USD Billion) | |
  26. TABLE 12 North America Automated Plate Readers Market Size, by Product Type, 2021–2035 (USD Billion) | |
  27. TABLE 13 North America Automated Plate Readers Market Size, by Application, 2021–2035 (USD Billion) | |
  28. TABLE 14 Europe Automated Plate Readers Market Size, by Product Type, 2021–2035 (USD Billion) | |
  29. TABLE 15 Europe Automated Plate Readers Market Size, by Application, 2021–2035 (USD Billion) | |
  30. TABLE 16 Asia Pacific Automated Plate Readers Market Size, by Product Type, 2021–2035 (USD Billion) | |
  31. TABLE 17 Asia Pacific Automated Plate Readers Market Size, by Application, 2021–2035 (USD Billion) | |
  32. TABLE 18 Rest of the World Automated Plate Readers Market Size, by Product Type, 2021–2035 (USD Billion) | |
  33. TABLE 19 Rest of the World Automated Plate Readers Market Size, by Application, 2021–2035 (USD Billion) | |
  34. TABLE 20 Competitive Benchmarking Matrix – Automated Plate Readers Market, 2026 | |
  35. TABLE 21 Company Profiles – Key Players, Automated Plate Readers Market | |
  36. TABLE 22 Recent Developments & Strategic Announcements, 2023–2025 | |
  37. TABLE 23 Report Scope & Methodology Summary | |
  38. TABLE 24 Detailed Sources and Citations | | LIST OF FIGURES | |
  39. FIGURE 1 Market Dynamics – Drivers, Restraints and Opportunities Overview | |
  40. FIGURE 2 Industry Value Chain Analysis – Automated Plate Readers | |
  41. FIGURE 3 Porter's Five Forces Analysis – Automated Plate Readers | |
  42. FIGURE 4 Global Market Size Trend and Forecast, 2021–2035 (USD Billion) | |
  43. FIGURE 5 Year-over-Year Growth Rate Trend, 2022–2035 (%) | |
  44. FIGURE 6 Market Share by Product Type, 2025 vs 2035 (%) | |
  45. FIGURE 7 Market Share by Application, 2025 vs 2035 (%) | |
  46. FIGURE 8 Regional Revenue Share Distribution, 2025 (%) | |
  47. FIGURE 9 Regional CAGR Comparison, 2026–2035 (%) | |
  48. FIGURE 10 North America Country-Level Share Distribution, 2025 (%) | |
  49. FIGURE 11 Europe Country-Level Share Distribution, 2025 (%) | |
  50. FIGURE 12 Asia Pacific Country-Level Share Distribution, 2025 (%) | |
  51. FIGURE 13 Competitive Landscape – Estimated Revenue Share Ranges, 2026 | |
  52. FIGURE 14 Vendor Positioning Matrix – Detection Capability vs Automation Readiness

Segmentation Quick Reference

DimensionSub-SegmentsDominant SegmentFastest Growing Segment
By Product TypeDedicated Microplate Readers (Single-mode Readers); Multimode Microplate ReadersMultimode Microplate Readers (59.0% share)Dedicated Microplate Readers (Single-mode Readers) (12.4% CAGR)
By ApplicationDrug Discovery; Genomics and Proteomics Research; Clinical Diagnostics; Other ApplicationsDrug Discovery (36.5% share)Clinical Diagnostics (13.6% CAGR)
By RegionNorth America; Europe; Asia Pacific; Rest of the WorldNorth America (38.5% share)Asia Pacific (14.2% CAGR)


Market Segmentation Overview

By Product Type

Sub-SegmentKey Trend
Dedicated Microplate Readers (Single-mode Readers)Deployed in multiples as low-cost parallel read stations inside robotic workcells
Multimode Microplate ReadersConsolidation of absorbance, fluorescence, luminescence, and time-resolved detection in one chassis


Multimode Microplate Readers hold the revenue lead at 59.0% because laboratories are collapsing four separate instruments into one serviceable chassis, which removes duplicate maintenance contracts and frees roughly 40% of bench space. Dedicated Microplate Readers (Single-mode Readers) grow faster at 12.4% CAGR for a structurally different reason: workcell architects prefer several inexpensive absorbance-only stations running in parallel over a single premium instrument that becomes a scheduling bottleneck. Sensitivity also matters — dedicated luminometers still outperform hybrid optics on low-signal reporter assays, so regulated potency workflows continue to specify them. Module-upgrade pricing on multimode chassis is the main competitive lever between the two.

By Application

Sub-SegmentKey Trend
Drug DiscoveryHigh-throughput screening campaigns amortising capital cost across very large well volumes
Genomics and Proteomics ResearchSteady demand for nucleic acid quantification and protein binding assay workflows
Clinical DiagnosticsAccreditation-driven purchases of validated, audit-ready readers for ELISA panel volume
Other ApplicationsFood safety, environmental and agricultural testing supported by non-pharmaceutical budgets


Drug Discovery anchors the application mix at 36.5% of revenue and absorbs the highest-specification instruments, since screening groups can spread a USD 90,000 purchase across millions of wells per year. Clinical Diagnostics is the fastest-growing sub-segment at 13.6% CAGR, driven by laboratory accreditation requirements that mandate documented instrument qualification and by rising immunoassay panel volume in hospital and reference settings. Genomics and Proteomics Research sits between the two, generating consistent mid-range demand that is less sensitive to pipeline cycles. Other Applications remains small but counter-cyclical, because food safety and environmental testing budgets move independently of pharmaceutical research spending.




Download PDF ×

We do not share your information with anyone. However, we may send you emails based on your report interest from time to time. You may contact us at any time to opt-out.