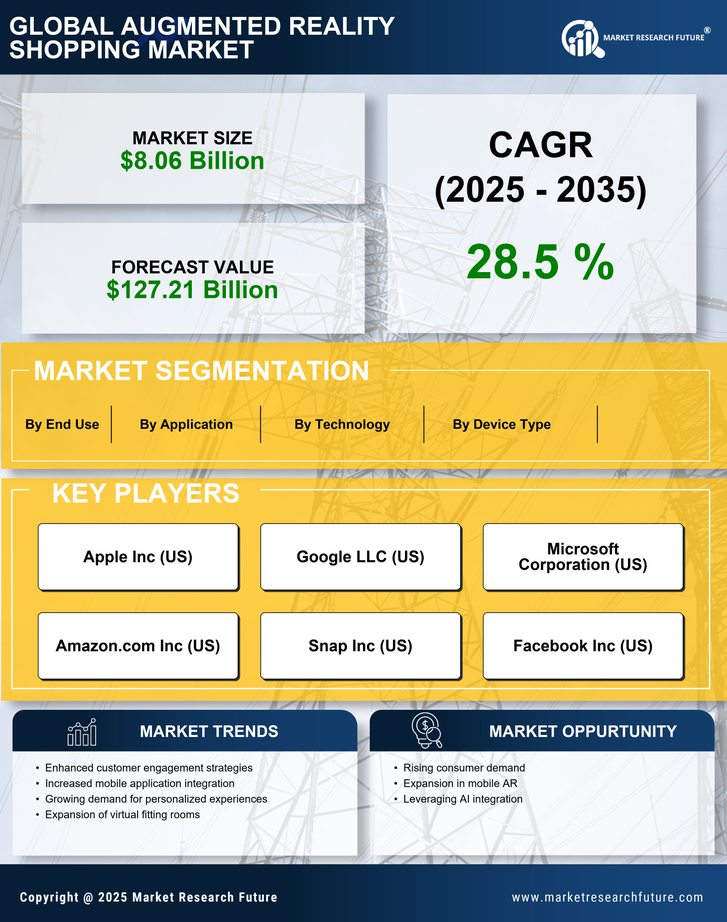
Certified Global Research Member
Isomar fd.webp Wcrc 57.webp
Key Questions Answered
  • Global Market Outlook
  • In-depth analysis of global and regional trends
  • Analyze and identify the major players in the market, their market share, key developments, etc.
  • To understand the capability of the major players based on products offered, financials, and strategies.
  • Identify disrupting products, companies, and trends.
  • To identify opportunities in the market.
  • Analyze the key challenges in the market.
  • Analyze the regional penetration of players, products, and services in the market.
  • Comparison of major players’ financial performance.
  • Evaluate strategies adopted by major players.
  • Recommendations
Why Choose Market Research Future?
  • Vigorous research methodologies for specific market.
  • Knowledge partners across the globe
  • Large network of partner consultants.
  • Ever-increasing/ Escalating data base with quarterly monitoring of various markets
  • Trusted by fortune 500 companies/startups/ universities/organizations
  • Large database of 5000+ markets reports.
  • Effective and prompt pre- and post-sales support.

Augmented Reality (AR) Shopping Market Research Report Information by Component (Solutions and Services), by Application (Automotive, Home Goods & Furniture, Beauty & Cosmetics, Apparel Fittings, Grocery Shopping, Footwear and Others) And By Region (North America, Europe, Asia-Pacific, And Rest Of The World) – Industry Size, Share and Forecast Till 2032


ID: MRFR/SEM/10528-CR | 128 Pages | Author: Aarti Dhapte| August 2023

Augmented Reality (AR) Shopping Market Segmentation


Augmented Reality (AR) Shopping Market Component Outlook (USD Billion, 2018-2032)


  • Solutions


  • Services


Augmented Reality (AR) Shopping Market Application Outlook (USD Billion, 2018-2032)


  • Automotive


  • Home Goods & Furniture


  • Beauty & Cosmetics


  • Apparel Fittings


  • Grocery Shopping


  • Footwear


  • Others


Augmented Reality (AR) Shopping Market Regional Outlook (USD Billion, 2018-2032)


  • North America Outlook (USD Billion, 2018-2032)


    • Augmented Reality (AR) Shopping Market  by Component


      • Solutions


      • Services


    • Augmented Reality (AR) Shopping Market  by Application


      • Automotive


      • Home Goods & Furniture


      • Beauty & Cosmetics


      • Apparel Fittings


      • Grocery Shopping


      • Footwear


      • Others


    • US Outlook (USD Billion, 2018-2032)


    • Augmented Reality (AR) Shopping Market  by Component


      • Solutions


      • Services


    • Augmented Reality (AR) Shopping Market  by Application


      • Automotive


      • Home Goods & Furniture


      • Beauty & Cosmetics


      • Apparel Fittings


      • Grocery Shopping


      • Footwear


      • Others


    • Canada Outlook (USD Billion, 2018-2032)


    • Augmented Reality (AR) Shopping Market  by Component


      • Solutions


      • Services


    • Augmented Reality (AR) Shopping Market  by Application


      • Automotive


      • Home Goods & Furniture


      • Beauty & Cosmetics


      • Apparel Fittings


      • Grocery Shopping


      • Footwear


      • Others


  • Europe Outlook (USD Billion, 2018-2032)


    • Augmented Reality (AR) Shopping Market  by Component


      • Solutions


      • Services


    • Augmented Reality (AR) Shopping Market  by Application


      • Automotive


      • Home Goods & Furniture


      • Beauty & Cosmetics


      • Apparel Fittings


      • Grocery Shopping


      • Footwear


      • Others


    • Germany Outlook (USD Billion, 2018-2032)


    • Augmented Reality (AR) Shopping Market  by Component


      • Solutions


      • Services


    • Augmented Reality (AR) Shopping Market  by Application


      • Automotive


      • Home Goods & Furniture


      • Beauty & Cosmetics


      • Apparel Fittings


      • Grocery Shopping


      • Footwear


      • Others


    • France Outlook (USD Billion, 2018-2032)


    • Augmented Reality (AR) Shopping Market  by Component


      • Solutions


      • Services


    • Augmented Reality (AR) Shopping Market  by Application


      • Automotive


      • Home Goods & Furniture


      • Beauty & Cosmetics


      • Apparel Fittings


      • Grocery Shopping


      • Footwear


      • Others


    • UK Outlook (USD Billion, 2018-2032)


    • Augmented Reality (AR) Shopping Market  by Component


      • Solutions


      • Services


    • Augmented Reality (AR) Shopping Market  by Application


      • Automotive


      • Home Goods & Furniture


      • Beauty & Cosmetics


      • Apparel Fittings


      • Grocery Shopping


      • Footwear


      • Others


    • Italy Outlook (USD Billion, 2018-2032)


    • Augmented Reality (AR) Shopping Market  by Component


      • Solutions


      • Services


    • Augmented Reality (AR) Shopping Market  by Application


      • Automotive


      • Home Goods & Furniture


      • Beauty & Cosmetics


      • Apparel Fittings


      • Grocery Shopping


      • Footwear


      • Others


    • Spain Outlook (USD Billion, 2018-2032)


    • Augmented Reality (AR) Shopping Market  by Component


      • Solutions


      • Services


    • Augmented Reality (AR) Shopping Market  by Application


      • Automotive


      • Home Goods & Furniture


      • Beauty & Cosmetics


      • Apparel Fittings


      • Grocery Shopping


      • Footwear


      • Others


    • Rest Of Europe Outlook (USD Billion, 2018-2032)


    • Augmented Reality (AR) Shopping Market  by Component


      • Solutions


      • Services


    • Augmented Reality (AR) Shopping Market  by Application


      • Automotive


      • Home Goods & Furniture


      • Beauty & Cosmetics


      • Apparel Fittings


      • Grocery Shopping


      • Footwear


      • Others


  • Asia-Pacific Outlook (USD Billion, 2018-2032)


    • Augmented Reality (AR) Shopping Market  by Component


      • Solutions


      • Services


    • Augmented Reality (AR) Shopping Market  by Application


      • Automotive


      • Home Goods & Furniture


      • Beauty & Cosmetics


      • Apparel Fittings


      • Grocery Shopping


      • Footwear


      • Others


    • China Outlook (USD Billion, 2018-2032)


    • Augmented Reality (AR) Shopping Market  by Component


      • Solutions


      • Services


    • Augmented Reality (AR) Shopping Market  by Application


      • Automotive


      • Home Goods & Furniture


      • Beauty & Cosmetics


      • Apparel Fittings


      • Grocery Shopping


      • Footwear


      • Others


    • Japan Outlook (USD Billion, 2018-2032)


    • Augmented Reality (AR) Shopping Market  by Component


      • Solutions


      • Services


    • Augmented Reality (AR) Shopping Market  by Application


      • Automotive


      • Home Goods & Furniture


      • Beauty & Cosmetics


      • Apparel Fittings


      • Grocery Shopping


      • Footwear


      • Others


    • India Outlook (USD Billion, 2018-2032)


    • Augmented Reality (AR) Shopping Market  by Component


      • Solutions


      • Services


    • Augmented Reality (AR) Shopping Market  by Application


      • Automotive


      • Home Goods & Furniture


      • Beauty & Cosmetics


      • Apparel Fittings


      • Grocery Shopping


      • Footwear


      • Others


    • Australia Outlook (USD Billion, 2018-2032)


    • Augmented Reality (AR) Shopping Market  by Component


      • Solutions


      • Services


    • Augmented Reality (AR) Shopping Market  by Application


      • Automotive


      • Home Goods & Furniture


      • Beauty & Cosmetics


      • Apparel Fittings


      • Grocery Shopping


      • Footwear


      • Others


    • Rest of Asia-Pacific Outlook (USD Billion, 2018-2032)


    • Augmented Reality (AR) Shopping Market  by Component


      • Solutions


      • Services


    • Augmented Reality (AR) Shopping Market  by Application


      • Automotive


      • Home Goods & Furniture


      • Beauty & Cosmetics


      • Apparel Fittings


      • Grocery Shopping


      • Footwear


      • Others


  • Rest of the World Outlook (USD Billion, 2018-2032)


    • Augmented Reality (AR) Shopping Market  by Component


      • Solutions


      • Services


    • Augmented Reality (AR) Shopping Market  by Application


      • Automotive


      • Home Goods & Furniture


      • Beauty & Cosmetics


      • Apparel Fittings


      • Grocery Shopping


      • Footwear


      • Others


    • Middle East Outlook (USD Billion, 2018-2032)


    • Augmented Reality (AR) Shopping Market  by Component


      • Solutions


      • Services


    • Augmented Reality (AR) Shopping Market  by Application


      • Automotive


      • Home Goods & Furniture


      • Beauty & Cosmetics


      • Apparel Fittings


      • Grocery Shopping


      • Footwear


      • Others


    • Africa Outlook (USD Billion, 2018-2032)


    • Augmented Reality (AR) Shopping Market  by Component


      • Solutions


      • Services


    • Augmented Reality (AR) Shopping Market  by Application


      • Automotive


      • Home Goods & Furniture


      • Beauty & Cosmetics


      • Apparel Fittings


      • Grocery Shopping


      • Footwear


      • Others


    • Latin America Outlook (USD Billion, 2018-2032)


    • Augmented Reality (AR) Shopping Market  by Component


      • Solutions


      • Services


    • Augmented Reality (AR) Shopping Market  by Application


      • Automotive


      • Home Goods & Furniture


      • Beauty & Cosmetics


      • Apparel Fittings


      • Grocery Shopping


      • Footwear


      • Others


Leading companies partner with us for data-driven Insights
client_1 client_2 client_3 client_4 client_5 client_6 client_7 client_8 client_9 client_10
Please fill in Business Email for Quick Response

Table of Contents

1. Executive summary

2. Market Introduction

2.1. Definition

2.2. Scope of the Study

2.2.1. Research Objective

2.2.2. Assumptions

2.2.3. Limitations

3. Research Methodology

3.1. Overview

3.2. Data Mining

3.3. Secondary Research

3.4. Primary Research

3.4.1. Primary Interviews and Information Gathering Process

3.4.2. Breakdown of Primary Respondents

3.5. Forecasting Modality

3.6. Market Size Estimation

3.6.1. Bottom-Up Approach

3.6.2. Top-Down Approach

3.7. Data Triangulation

3.8. Validation

4. Market Dynamics

4.1. Overview

4.2. Drivers

4.3. Restraints

4.4. Opportunities

5. Market Factor Analysis

5.1. Value Chain Analysis

5.2. Porter’s Five Forces Analysis

5.2.1. Bargaining Power of Suppliers

5.2.2. Bargaining Power of Buyers

5.2.3. Threat of New Entrants

5.2.4. Threat of Substitutes

5.2.5. Intensity of Rivalry

5.3. COVID-19 Impact Analysis

5.3.1. Market Impact Analysis

5.3.2. Regional Impact

5.3.3. Opportunity and Threat Analysis

6. GLOBAL Augmented reality ar shopping MARKET, BY COMPONENT

6.1. Overview

6.2. Solutions

6.3. Services

7. GLOBAL Augmented reality ar shopping MARKET, BY Application

7.1. Overview

7.2. Automotive

7.3. Home Goods & Furniture

7.4. Beauty & Cosmetics

7.5. Apparel Fittings

7.6. Grocery Shopping

7.7. Footwear

7.8. Others

8. GLOBAL Augmented reality ar shopping MARKET, by Region

8.1. Overview

8.2. North America

8.2.1. U.S.

8.2.2. Canada

8.3. Europe

8.3.1. Germany

8.3.2. France

8.3.3. U.K

8.3.4. Italy

8.3.5. Spain

8.3.6. Rest of Europe

8.4. Asia-Pacific

8.4.1. China

8.4.2. India

8.4.3. Japan

8.4.4. South Korea

8.4.5. Australia

8.4.6. Rest of Asia-Pacific

8.5. Rest of the World

8.5.1. Middle East

8.5.2. Africa

8.5.3. Latin America

9. Competitive Landscape

9.1. Overview

9.2. Competitive Analysis

9.3. Market Share Analysis

9.4. Major Growth Strategy in the Global Augmented reality ar shopping Market,

9.5. Competitive Benchmarking

9.6. Leading Players in Terms of Number of Developments in the Global Augmented reality ar shopping Market,

9.7. Key developments and Growth Strategies

9.7.1. New COMPONENT Launch/Application Deployment

9.7.2. Merger & Acquisitions

9.7.3. Joint Ventures

9.8. Major Players Financial Matrix

9.8.1. Sales & Operating Income, 2022

9.8.2. Major Players R&D Expenditure. 2022

10. Company ProfileS

10.1. Apple Inc.

10.1.1. Company Overview

10.1.2. Financial Overview

10.1.3. Component Offered

10.1.4. Key Developments

10.1.5. SWOT Analysis

10.1.6. Key Strategies

10.2. Augment

10.2.1. Company Overview

10.2.2. Financial Overview

10.2.3. Component Offered

10.2.4. Key Developments

10.2.5. SWOT Analysis

10.2.6. Key Strategies

10.3. Blippar Ltd

10.3.1. Company Overview

10.3.2. Financial Overview

10.3.3. Component Offered

10.3.4. Key Developments

10.3.5. SWOT Analysis

10.3.6. Key Strategies

10.4. Google LLC

10.4.1. Company Overview

10.4.2. Financial Overview

10.4.3. Component Offered

10.4.4. Key Developments

10.4.5. SWOT Analysis

10.4.6. Key Strategies

10.5. Holition Ltd

10.5.1. Company Overview

10.5.2. Financial Overview

10.5.3. Component Offered

10.5.4. Key Developments

10.5.5. SWOT Analysis

10.5.6. Key Strategies

10.6. Imaginate Technologies

10.6.1. Company Overview

10.6.2. Financial Overview

10.6.3. Component Offered

10.6.4. Key Developments

10.6.5. SWOT Analysis

10.6.6. Key Strategies

10.7. Marxent Labs LLC

10.7.1. Company Overview

10.7.2. Financial Overview

10.7.3. Component Offered

10.7.4. Key Developments

10.7.5. SWOT Analysis

10.7.6. Key Strategies

10.8. Microsoft

10.8.1. Company Overview

10.8.2. Financial Overview

10.8.3. Component Offered

10.8.4. Key Developments

10.8.5. SWOT Analysis

10.8.6. Key Strategies

10.9. PTC

10.9.1. Company Overview

10.9.2. Financial Overview

10.9.3. Component Offered

10.9.4. Key Developments

10.9.5. SWOT Analysis

10.9.6. Key Strategies

10.10. ViewAR GmbH

10.10.1. Company Overview

10.10.2. Financial Overview

10.10.3. Component Offered

10.10.4. Key Developments

10.10.5. SWOT Analysis

10.10.6. Key Strategies

10.11. Wikitude GmbH

10.11.1. Company Overview

10.11.2. Financial Overview

10.11.3. Component Offered

10.11.4. Key Developments

10.11.5. SWOT Analysis

10.11.6. Key Strategies

10.12. Zugara, Inc.

10.12.1. Company Overview

10.12.2. Financial Overview

10.12.3. Component Offered

10.12.4. Key Developments

10.12.5. SWOT Analysis

10.12.6. Key Strategies

11. Appendix

11.1. References

11.2. Related Reports

LIST OF TABLES

TABLE 1 Global Augmented reality ar shopping Market, Synopsis, 2018-2032

TABLE 2 Global Augmented reality ar shopping Market, Estimates & Forecast, 2018-2032 (USD BILLION)

TABLE 3 GLOBAL Augmented reality ar shopping MARKET, BY COMPONENT, 2018-2032 (USD BILLION)

TABLE 4 GLOBAL Augmented reality ar shopping MARKET, BY APPLICATION, 2018-2032 (USD BILLION)

TABLE 5 North America Augmented reality ar shopping MARKET, BY COMPONENT, 2018-2032 (USD BILLION)

TABLE 6 North America Augmented reality ar shopping MARKET, BY APPLICATION, 2018-2032 (USD BILLION)

TABLE 7 North America Augmented reality ar shopping MARKET, BY Country, 2018-2032 (USD BILLION)

TABLE 8 U.S. Augmented reality ar shopping MARKET, BY COMPONENT, 2018-2032 (USD BILLION)

TABLE 9 U.S. Augmented reality ar shopping MARKET, BY APPLICATION, 2018-2032 (USD BILLION)

TABLE 10 Canada Augmented reality ar shopping MARKET, BY COMPONENT, 2018-2032 (USD BILLION)

TABLE 11 Canada Augmented reality ar shopping MARKET, BY APPLICATION, 2018-2032 (USD BILLION)

TABLE 12 Europe Augmented reality ar shopping MARKET, BY COMPONENT, 2018-2032 (USD BILLION)

TABLE 13 Europe Augmented reality ar shopping MARKET, BY APPLICATION, 2018-2032 (USD BILLION)

TABLE 14 Europe Augmented reality ar shopping MARKET, BY Country, 2018-2032 (USD BILLION)

TABLE 15 Germany Augmented reality ar shopping MARKET, BY COMPONENT, 2018-2032 (USD BILLION)

TABLE 16 Germany Augmented reality ar shopping MARKET, BY APPLICATION, 2018-2032 (USD BILLION)

TABLE 17 France Augmented reality ar shopping MARKET, BY COMPONENT, 2018-2032 (USD BILLION)

TABLE 18 France Augmented reality ar shopping MARKET, BY APPLICATION, 2018-2032 (USD BILLION)

TABLE 19 Italy Augmented reality ar shopping MARKET, BY COMPONENT, 2018-2032 (USD BILLION)

TABLE 20 Italy Augmented reality ar shopping MARKET, BY APPLICATION, 2018-2032 (USD BILLION)

TABLE 21 Spain Augmented reality ar shopping MARKET, BY COMPONENT, 2018-2032 (USD BILLION)

TABLE 22 Spain Augmented reality ar shopping MARKET, BY APPLICATION, 2018-2032 (USD BILLION)

TABLE 23 U.K Augmented reality ar shopping MARKET, BY COMPONENT, 2018-2032 (USD BILLION)

TABLE 24 U.K Augmented reality ar shopping MARKET, BY APPLICATION, 2018-2032 (USD BILLION)

TABLE 25 Rest of Europe Augmented reality ar shopping MARKET, BY COMPONENT, 2018-2032 (USD BILLION)

TABLE 26 Rest of Europe Augmented reality ar shopping MARKET, BY APPLICATION, 2018-2032 (USD BILLION)

TABLE 27 Asia Pacific Augmented reality ar shopping MARKET, BY COMPONENT, 2018-2032 (USD BILLION)

TABLE 28 Asia Pacific Augmented reality ar shopping MARKET, BY APPLICATION, 2018-2032 (USD BILLION)

TABLE 29 Asia Pacific Augmented reality ar shopping MARKET, BY Country, 2018-2032 (USD BILLION)

TABLE 30 Japan Augmented reality ar shopping MARKET, BY COMPONENT, 2018-2032 (USD BILLION)

TABLE 31 Japan Augmented reality ar shopping MARKET, BY APPLICATION, 2018-2032 (USD BILLION)

TABLE 32 China Augmented reality ar shopping MARKET, BY COMPONENT, 2018-2032 (USD BILLION)

TABLE 33 China Augmented reality ar shopping MARKET, BY APPLICATION, 2018-2032 (USD BILLION)

TABLE 34 India Augmented reality ar shopping MARKET, BY COMPONENT, 2018-2032 (USD BILLION)

TABLE 35 India Augmented reality ar shopping MARKET, BY APPLICATION, 2018-2032 (USD BILLION)

TABLE 36 Australia Augmented reality ar shopping MARKET, BY COMPONENT, 2018-2032 (USD BILLION)

TABLE 37 Australia Augmented reality ar shopping MARKET, BY APPLICATION, 2018-2032 (USD BILLION)

TABLE 38 south korea Augmented reality ar shopping MARKET, BY COMPONENT, 2018-2032 (USD BILLION)

TABLE 39 south korea Augmented reality ar shopping MARKET, BY APPLICATION, 2018-2032 (USD BILLION)

TABLE 40 Rest of asia-pacific Augmented reality ar shopping MARKET, BY COMPONENT, 2018-2032 (USD BILLION)

TABLE 41 Rest of asia-pacific Augmented reality ar shopping MARKET, BY APPLICATION, 2018-2032 (USD BILLION)

TABLE 42 Rest of WOrld Augmented reality ar shopping MARKET, BY COMPONENT, 2018-2032 (USD BILLION)

TABLE 43 Rest of WOrld Augmented reality ar shopping MARKET, BY APPLICATION, 2018-2032 (USD BILLION)

TABLE 44 Rest of WOrld Augmented reality ar shopping MARKET, BY Country, 2018-2032 (USD BILLION)

TABLE 45 Middle east Augmented reality ar shopping MARKET, BY COMPONENT, 2018-2032 (USD BILLION)

TABLE 46 Middle east Augmented reality ar shopping MARKET, BY APPLICATION, 2018-2032 (USD BILLION)

TABLE 47 Africa Augmented reality ar shopping MARKET, BY COMPONENT, 2018-2032 (USD BILLION)

TABLE 48 Africa Augmented reality ar shopping MARKET, BY APPLICATION, 2018-2032 (USD BILLION)

TABLE 49 Latin america Augmented reality ar shopping MARKET, BY COMPONENT, 2018-2032 (USD BILLION)

TABLE 50 Latin america Augmented reality ar shopping MARKET, BY APPLICATION, 2018-2032 (USD BILLION)

LIST OF FIGURES

FIGURE 1 Research Process

FIGURE 2 Market Structure for the Global Augmented reality ar shopping Market

FIGURE 3 Market Dynamics for the Global Augmented reality ar shopping Market

FIGURE 4 Global Augmented reality ar shopping Market, Share (%), BY COMPONENT, 2022

FIGURE 5 Global Augmented reality ar shopping Market, Share (%), BY APPLICATION, 2022

FIGURE 6 Global Augmented reality ar shopping Market, Share (%), by Region, 2022

FIGURE 7 north AMERICA: Augmented reality ar shopping MARKET, SHARE (%), BY REGION, 2022

FIGURE 8 Europe: Augmented reality ar shopping MARKET, SHARE (%), BY REGION, 2022

FIGURE 9 Asia-Pacific: Augmented reality ar shopping MARKET, SHARE (%), BY REGION, 2022

FIGURE 10 Rest of the world: Augmented reality ar shopping MARKET, SHARE (%), BY REGION, 2022

FIGURE 11 Global Augmented reality ar shopping Market: Company Share Analysis, 2022 (%)

FIGURE 12 Apple Inc.: FINANCIAL OVERVIEW SNAPSHOT

FIGURE 13 Apple Inc.: SWOT ANALYSIS

FIGURE 14 Augment: FINANCIAL OVERVIEW SNAPSHOT

FIGURE 15 Augment: SWOT ANALYSIS

FIGURE 16 Blippar Ltd: FINANCIAL OVERVIEW SNAPSHOT

FIGURE 17 Blippar Ltd: SWOT ANALYSIS

FIGURE 18 Google LLC: FINANCIAL OVERVIEW SNAPSHOT

FIGURE 19 Google LLC: SWOT ANALYSIS

FIGURE 20 Holition Ltd.: FINANCIAL OVERVIEW SNAPSHOT

FIGURE 21 Holition Ltd.: SWOT ANALYSIS

FIGURE 22 Imaginate Technologies: FINANCIAL OVERVIEW SNAPSHOT

FIGURE 23 Imaginate Technologies: SWOT ANALYSIS

FIGURE 24 Marxent Labs LLC: FINANCIAL OVERVIEW SNAPSHOT

FIGURE 25 Marxent Labs LLC: SWOT ANALYSIS

FIGURE 26 Microsoft: FINANCIAL OVERVIEW SNAPSHOT

FIGURE 27 Microsoft: SWOT ANALYSIS

FIGURE 28 PTC: FINANCIAL OVERVIEW SNAPSHOT

FIGURE 29 PTC: SWOT ANALYSIS

FIGURE 30 ViewAR GmbH: FINANCIAL OVERVIEW SNAPSHOT

FIGURE 31 ViewAR GmbH: SWOT ANALYSIS

FIGURE 32 Wikitude GmbH: FINANCIAL OVERVIEW SNAPSHOT

FIGURE 33 Wikitude GmbH: SWOT ANALYSIS

FIGURE 34 Zugara, Inc: FINANCIAL OVERVIEW SNAPSHOT

FIGURE 35 Zugara, Inc: SWOT ANALYSIS

Purchase Option
Single User $ 4,950
Multiuser License $ 5,950
Enterprise User $ 7,250
Compare Licenses
Tailored for You
  • Dedicated Research on any specifics segment or region.
  • Focused Research on specific players in the market.
  • Custom Report based only on your requirements.
  • Flexibility to add or subtract any chapter in the study.
  • Historic data from 2014 and forecasts outlook till 2040.
  • Flexibility of providing data/insights in formats (PDF, PPT, Excel).
  • Provide cross segmentation in applicable scenario/markets.