×
Hero Background
English
Chinese
French
Japanese
Korean
German
Spanish

Augmented Reality Market Size

ID: MRFR/ICT/0637-HCR
100 Pages
Ankit Gupta
October 2025

Augmented Reality Market Research Report: Information By Device Type (Head Mounted Display, Head-up Display), By Vertical (Consumer Electronics, Commercial, Aerospace & Defense, Medical), By Technology (Marker Based, Marker Less), And By Region (North America, Europe, Asia-Pacific, And Rest Of The World) –Market Forecast Till 2035.

Share:
Download PDF ×

We do not share your information with anyone. However, we may send you emails based on your report interest from time to time. You may contact us at any time to opt-out.

Augmented Reality Market Infographic
Purchase Options

Augmented Reality Size

Augmented Reality Market Growth Projections and Opportunities

The rising use of smartphones and other smart devices is another important market aspect. Due to the devices' widespread use, augmented reality applications now have a large worldwide audience at their disposal. Due in large part to the widespread availability of AR-enabled smartphone apps that improve user experiences by providing immersive and interactive content, mobile AR in particular has experienced significant development. Numerous variables impact the Augmented Reality (AR) industry, which in turn shapes its growth trajectory. The development of technology is one important aspect.

The demand for AR technologies is rising as they develop and grow more complex. Better sensors and more potent CPUs are examples of hardware innovations that let AR fit in seamlessly with a variety of sectors, from gaming to healthcare. The competitive environment is another important factor that shapes the AR industry. The market becomes inventive and dynamic as large businesses pour money into research and development. By releasing state-of-the-art augmented reality solutions, businesses compete with one another to outdo one another, which encourages healthy growth and pushes the limits of what AR can accomplish. A crucial factor in determining the growth of the AR industry is market adoption and awareness. The need for augmented reality (AR) goods and services is growing as companies and consumers learn more about these technologies and their useful applications. Positive attitudes and increased acceptance of AR are fostered by successful AR deployments in a variety of industries, including retail, education, and healthcare.

The AR market is also impacted by regulatory concerns. Governments and regulatory agencies have a part to play in establishing rules and regulations for augmented reality technology, guaranteeing moral behavior, and resolving privacy and security issues. A favorable environment for the development and application of AR can be created by policies that are clear and encouraging. The AR market is also impacted by budgetary constraints and general economic situations. Businesses have a stronger incentive to invest in cutting-edge technology like augmented reality (AR) when the economy is expanding and stable. Economic downturns, on the other hand, can cause a brief pause in AR adoption as businesses prioritize critical spending.
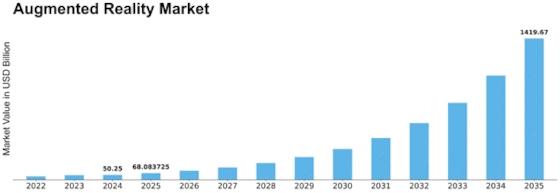
Augmented Reality Market Size Graph
Author
Ankit Gupta
Senior Research Analyst

Ankit Gupta is an analyst in market research industry in ICT and SEMI industry. With post-graduation in "Telecom and Marketing Management" and graduation in "Electronics and Telecommunication" vertical he is well versed with recent development in ICT industry as a whole. Having worked on more than 150+ reports including consultation for fortune 500 companies such as Microsoft and Rio Tinto in identifying solutions with respect to business problems his opinions are inclined towards mixture of technical and managerial aspects.

Leave a Comment

FAQs

What is the projected market valuation of the Augmented Reality Market by 2035?

The Augmented Reality Market is projected to reach a valuation of 1419.67 USD Billion by 2035.

What was the market valuation of the Augmented Reality Market in 2024?

In 2024, the Augmented Reality Market was valued at 50.25 USD Billion.

What is the expected CAGR for the Augmented Reality Market from 2025 to 2035?

The expected CAGR for the Augmented Reality Market during the forecast period 2025 - 2035 is 35.49%.

Which companies are considered key players in the Augmented Reality Market?

Key players in the Augmented Reality Market include Microsoft, Apple, Google, Facebook (Meta Platforms), Snap Inc., Niantic, PTC, Vuforia, Magic Leap, and Unity Technologies.

What are the main device types contributing to the Augmented Reality Market?

The main device types in the Augmented Reality Market include Head Mounted Displays and Head Up Displays, with valuations of 600.0 USD Billion and 819.67 USD Billion respectively.

How does the Augmented Reality Market perform across different verticals?

The Augmented Reality Market shows strong performance across various verticals, including Consumer Electronics at 284.12 USD Billion and Medical at 374.21 USD Billion.

Market Summary

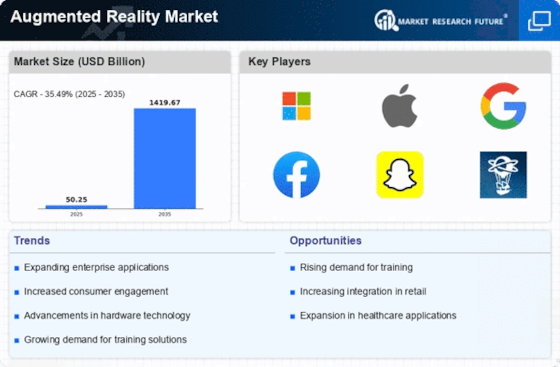
As per MRFR analysis, the Augmented Reality Market Size was estimated at 50.25 USD Billion in 2024. The Augmented Reality industry is projected to grow from 68.08 USD Billion in 2025 to 1419.67 USD Billion by 2035, exhibiting a compound annual growth rate (CAGR) of 35.49 during the forecast period 2025 - 2035.

Key Market Trends & Highlights

The Augmented Reality Market is experiencing robust growth driven by technological advancements and increasing applications across various sectors.

  • The North American region remains the largest market for augmented reality, showcasing substantial investment and innovation. In the Asia-Pacific region, the market is rapidly expanding, driven by a surge in consumer demand and technological adoption. Head Mounted Displays dominate the market, while Head Up Displays are emerging as the fastest-growing segment due to their innovative applications. Enhanced user engagement and increased investment in AR startups are key drivers propelling the market forward.

Market Size & Forecast

2024 Market Size 50.25 (USD Billion)
2035 Market Size 1419.67 (USD Billion)
CAGR (2025 - 2035) 35.49%
Largest Regional Market Share in 2024 North America

Major Players

<p>Microsoft (US), Apple (US), Google (US), Facebook (Meta Platforms) (US), Snap Inc. (US), Niantic (US), PTC (US), Vuforia (US), Magic Leap (US), Unity Technologies (US)</p>

Market Trends

The Augmented Reality Market is currently experiencing a transformative phase, characterized by rapid advancements in technology and increasing adoption across various sectors. This market appears to be driven by the growing demand for immersive experiences, which enhance user engagement and interaction. Industries such as retail, healthcare, and education are integrating augmented reality solutions to improve customer experiences, streamline operations, and facilitate learning. As organizations recognize the potential of augmented reality to create value, investments in this technology are likely to rise, fostering innovation and competition. Moreover, the Augmented Reality Market seems to be influenced by the proliferation of mobile devices and the expansion of high-speed internet connectivity. These factors enable users to access augmented reality applications seamlessly, thereby broadening the market's reach. Additionally, collaborations between technology firms and content creators are emerging, suggesting a trend towards more sophisticated and user-friendly applications. As the market evolves, it may witness the introduction of new use cases and applications, further solidifying its position in the digital landscape.

Increased Adoption in Retail

The Augmented Reality Market is witnessing a notable surge in retail applications, where businesses utilize augmented reality to enhance the shopping experience. This trend indicates a shift towards interactive and personalized customer engagement, allowing consumers to visualize products in their own environments before making a purchase.

Advancements in Healthcare

In the healthcare sector, the Augmented Reality Market is evolving with the integration of augmented reality tools for training and surgical procedures. This trend suggests that medical professionals are increasingly leveraging augmented reality to improve precision and outcomes, thereby enhancing patient care.

Educational Innovations

The Augmented Reality Market is also making strides in education, where institutions are adopting augmented reality to create immersive learning environments. This trend implies that educators are recognizing the potential of augmented reality to facilitate deeper understanding and retention of complex subjects.

Augmented Reality Market Market Drivers

Enhanced User Engagement

The Augmented Reality Market is witnessing a surge in user engagement due to the immersive experiences it offers. Businesses are increasingly adopting AR technologies to create interactive marketing campaigns that captivate consumers. For instance, brands are utilizing AR to allow customers to visualize products in their own environment before making a purchase. This not only enhances the shopping experience but also increases conversion rates. According to recent data, companies that have integrated AR into their marketing strategies report a 30% increase in customer engagement. As more businesses recognize the potential of AR to create memorable interactions, the demand for AR solutions is expected to rise, further propelling the Augmented Reality Market.

Technological Advancements

The Augmented Reality Market is significantly influenced by rapid technological advancements. Innovations in hardware, such as improved sensors and displays, are enhancing the capabilities of AR applications. For example, the development of lightweight smart glasses and mobile devices with advanced processing power is making AR more accessible to consumers and businesses alike. Furthermore, software advancements, including machine learning and computer vision, are enabling more sophisticated AR experiences. As these technologies evolve, they are likely to drive the adoption of AR across various sectors, including retail, healthcare, and education. The integration of these technologies is expected to contribute to a projected growth rate of over 40% in the Augmented Reality Market over the next few years.

Increased Investment in AR Startups

The Augmented Reality Market is benefiting from increased investment in AR startups, which is fostering innovation and development. Venture capitalists and tech companies are recognizing the potential of AR technologies and are investing heavily in emerging firms. This influx of capital is enabling startups to develop cutting-edge AR applications and solutions that cater to various industries. For instance, investments in AR gaming and entertainment have led to the creation of engaging experiences that attract a wide audience. Additionally, the rise of AR in sectors such as real estate and tourism is further driving investment. As funding continues to flow into the Augmented Reality Market, it is likely to accelerate growth and expand the range of applications available.

Growing Demand in Training and Simulation

The Augmented Reality Market is experiencing a growing demand for training and simulation applications. Industries such as manufacturing, aviation, and healthcare are increasingly utilizing AR to enhance training programs. By providing realistic simulations, AR allows trainees to practice skills in a safe environment, thereby improving learning outcomes. For instance, AR can be used to simulate complex machinery operations, enabling workers to gain hands-on experience without the risks associated with real-world training. This trend is supported by data indicating that companies using AR for training report a 25% reduction in training time and a 40% increase in retention rates. As organizations seek more effective training solutions, the Augmented Reality Market is poised for substantial growth.

Integration with Internet of Things (IoT)

The Augmented Reality Market is increasingly integrating with the Internet of Things (IoT), creating new opportunities for innovation. This convergence allows AR applications to leverage real-time data from connected devices, enhancing user experiences. For example, AR can provide users with contextual information about their surroundings by accessing data from IoT sensors. This integration is particularly beneficial in sectors such as smart homes and industrial automation, where AR can visualize data in a more intuitive manner. As the number of connected devices continues to grow, the potential for AR applications to enhance functionality and user interaction is substantial. This synergy is expected to drive further growth in the Augmented Reality Market, as businesses seek to capitalize on the benefits of both technologies.

Market Segment Insights

By Device Type: Head Mounted Display (Largest) vs. Head up Display (Fastest-Growing)

<p>In the Augmented Reality Market, the device type segment is primarily dominated by Head Mounted Displays (HMD), which account for a substantial share of the overall market. HMDs have become the preferred choice for consumers and enterprises alike due to their immersive experience and vast application in gaming, training, and education. On the other hand, Head up Displays (HUD) are gaining traction, particularly in automotive and industrial applications, as they offer hands-free information access without obstructing the user’s line of sight.</p>

<p>Device Type: Head Mounted Display (Dominant) vs. Head up Display (Emerging)</p>

<p>Head Mounted Displays (HMD) have established themselves as the dominant device type in the Augmented Reality Market, largely due to their ability to deliver truly immersive experiences across various sectors, including gaming, healthcare, and enterprise training. They incorporate advanced technologies such as eye tracking and gesture recognition, significantly enhancing user experiences. Conversely, Head up Displays (HUD) are emerging rapidly, particularly in automotive industries, providing drivers with essential information while ensuring safety and minimizing distractions. The growth of HUDs is fueled by the increasing demand for smart technologies, as well as advancements in optics and electronics, positioning them as a pivotal segment in the future of augmented reality.</p>

By Vertical: Consumer Electronics (Largest) vs. Medical (Fastest-Growing)

<p>The Augmented Reality Market (AR) market shows a diversified share distribution among various verticals. Consumer Electronics holds a significant portion of the market, driven by the popularity of AR devices like smart glasses and mobile AR applications. Conversely, while Medical is a smaller segment compared to Consumer Electronics, it is rapidly gaining traction due to increasing adoption of AR in surgical procedures, medical training, and patient care. This indicates the growing importance of AR solutions in enhancing service delivery and operational efficiencies across healthcare facilities.</p>

<p>Consumer Electronics: Dominant vs. Medical: Emerging</p>

<p>Consumer Electronics is the dominant vertical in the Augmented Reality Market, driven by innovations in AR-enabled devices and applications that enhance user experience. This segment encompasses a wide range of products, from smartphones to wearable AR gear, catering to tech-savvy consumers. On the other hand, the Medical segment is emerging swiftly, propelled by the integration of AR technologies into healthcare processes. The use of AR for surgical visualization, training simulations, and patient engagement is transforming how healthcare professionals deliver services, marking a significant shift in medical practices. As technological advances continue, both segments are poised to evolve significantly within the AR landscape.</p>

By Technology: Marker Based (Largest) vs. Marker Less (Fastest-Growing)

<p>In the augmented reality market, the segmentation by technology reveals a notable distribution with marker-based AR holding the largest market share. This segment leverages pre-defined markers, such as QR codes or images, to enhance user interactions. In contrast, marker-less AR is gaining traction due to its versatility and ease of accessibility. The adoption of both technologies is vital, as they cater to different use cases and preferences among industries like gaming, education, and retail. The growth trends for the augmented reality market are significantly influenced by advancements in smartphone technology and increased consumer awareness. Marker-less AR is projected to grow at a rapid pace driven by the rising demand for interactive and immersive user experiences. Industries are beginning to recognize the innovative potential of augmented reality, and as these technologies become more integrated into everyday applications, both marker-based and marker-less solutions will likely see accelerated growth, albeit at different rates.</p>

<p>Marker Based (Dominant) vs. Marker Less (Emerging)</p>

<p>Marker-based technology is recognized as a dominant force in the augmented reality market, primarily due to its foundation in established use cases that effectively enhance environments with digital overlays. By utilizing visual markers, this technology operates efficiently in controlled environments, providing reliable AR experiences largely seen in retail and marketing campaigns. Conversely, marker-less technology is emerging as a significant contender, offering a more flexible and user-friendly approach. This segment uses advanced algorithms and sensor data to create AR experiences without the need for physical markers, making it ideal for real-world applications like navigation and mobile gaming. The contrasting characteristics of these technologies highlight a dynamic market where both segments are evolving to cater to diverse consumer needs.</p>

Get more detailed insights about Augmented Reality Market Research Report – Forecast till 2035

Regional Insights

North America : Innovation and Leadership Hub

North America is the largest market for augmented reality, holding approximately 45% of the global share. The region's growth is driven by technological advancements, increasing investments in AR applications, and a robust ecosystem of tech giants. Regulatory support for innovation and digital transformation further catalyzes market expansion. The demand for AR in sectors like healthcare, education, and entertainment is on the rise, contributing to a vibrant market landscape. The United States leads the North American market, with significant contributions from companies like Microsoft, Apple, and Google. The competitive landscape is characterized by rapid innovation and collaboration among key players. The presence of major tech firms fosters a culture of research and development, ensuring that North America remains at the forefront of AR technology. The region's focus on enhancing user experience and integrating AR into everyday applications solidifies its market leadership.

Europe : Emerging Market with Potential

Europe is witnessing a significant rise in augmented reality adoption, holding around 30% of the global market share. The region's growth is fueled by increasing investments in AR technologies, particularly in retail, automotive, and manufacturing sectors. Regulatory frameworks promoting digital innovation and sustainability are also key drivers. Countries like Germany and the UK are at the forefront, showcasing a strong demand for AR solutions that enhance customer engagement and operational efficiency. Germany, the largest market in Europe, is home to numerous AR startups and established companies, fostering a competitive environment. The UK follows closely, with a growing focus on AR in education and training. The presence of key players such as PTC and Unity Technologies enhances the region's competitive landscape. Collaborative initiatives between tech firms and educational institutions are paving the way for innovative AR applications, positioning Europe as a promising market for future growth.

Asia-Pacific : Rapid Growth and Adoption

Asia-Pacific is rapidly emerging as a significant player in the augmented reality market, accounting for approximately 20% of the global share. The region's growth is driven by increasing smartphone penetration, rising consumer demand for immersive experiences, and substantial investments in AR technology. Countries like China and Japan are leading the charge, with government initiatives supporting digital innovation and technology adoption across various sectors. China stands out as the largest market in the region, with a booming AR industry fueled by major tech companies and startups. Japan follows closely, focusing on AR applications in gaming and retail. The competitive landscape is characterized by a mix of established players and innovative startups, creating a dynamic environment for AR development. The presence of key players like Niantic and Snap Inc. further enhances the region's market potential, driving advancements in AR technology and applications.

Middle East and Africa : Emerging Market with Opportunities

The Middle East and Africa region is gradually emerging in the augmented reality market, holding about 5% of the global share. The growth is primarily driven by increasing investments in technology and digital transformation initiatives across various sectors. Countries like the UAE and South Africa are leading the way, with government support for innovation and a growing interest in AR applications in tourism, education, and healthcare. The UAE is at the forefront of AR adoption, with numerous initiatives aimed at enhancing user experiences in tourism and retail. South Africa follows, focusing on AR in education and training. The competitive landscape is evolving, with both local and international players entering the market. The presence of innovative startups and collaborations with tech giants is fostering a vibrant AR ecosystem, positioning the region for future growth and development.

Key Players and Competitive Insights

The Augmented Reality Market (AR) market is currently characterized by a dynamic competitive landscape, driven by rapid technological advancements and increasing applications across various sectors. Major players such as Microsoft (US), Apple (US), and Meta Platforms (US) are at the forefront, each adopting distinct strategies to enhance their market positioning. Microsoft (US) focuses on enterprise solutions, leveraging its HoloLens technology to facilitate remote collaboration and training, while Apple (US) emphasizes consumer engagement through its ARKit, integrating AR capabilities into its ecosystem of devices. Meta Platforms (US), on the other hand, is heavily investing in social AR experiences, aiming to create immersive environments that enhance user interaction and engagement. Collectively, these strategies not only intensify competition but also foster innovation, as companies strive to differentiate their offerings in a rapidly evolving market.

In terms of business tactics, companies are increasingly localizing manufacturing and optimizing supply chains to enhance efficiency and responsiveness to market demands. The AR market appears moderately fragmented, with a mix of established players and emerging startups. This structure allows for diverse innovations and applications, as smaller firms often introduce niche solutions that challenge the larger incumbents. The collective influence of these key players shapes the market dynamics, as they engage in strategic partnerships and collaborations to expand their technological capabilities and market reach.

In August 2025, Microsoft (US) announced a significant partnership with a leading telecommunications provider to enhance the connectivity of its HoloLens devices. This collaboration aims to improve the performance of AR applications in remote locations, thereby expanding the potential use cases in industries such as construction and healthcare. The strategic importance of this move lies in its potential to enhance user experience and broaden the adoption of AR technologies in sectors that require reliable and high-speed connectivity.

In September 2025, Apple (US) unveiled a new AR headset, which integrates advanced features such as eye-tracking and gesture recognition. This product launch is pivotal as it positions Apple (US) to compete directly with existing AR hardware, potentially reshaping consumer expectations and experiences in the AR space. The introduction of such innovative technology underscores Apple's commitment to leading the consumer AR market and could significantly influence user engagement across its product ecosystem.

In October 2025, Meta Platforms (US) revealed a new initiative aimed at developing AR tools for small businesses, providing them with resources to create their own AR experiences. This strategic action reflects Meta's focus on democratizing AR technology, making it accessible to a broader audience. By empowering small businesses, Meta (US) not only enhances its user base but also fosters a community of creators that could drive further innovation in the AR landscape.

As of October 2025, the competitive trends in the AR market are increasingly defined by digitalization, sustainability, and the integration of artificial intelligence. Strategic alliances are becoming more prevalent, as companies recognize the value of collaboration in enhancing technological capabilities and market presence. Looking ahead, competitive differentiation is likely to evolve from traditional price-based competition to a focus on innovation, technological advancements, and supply chain reliability. This shift suggests that companies that prioritize these aspects will be better positioned to thrive in the increasingly competitive AR landscape.

Key Companies in the Augmented Reality Market market include

Industry Developments

  • Q2 2024: Apple launches Vision Pro mixed reality headset Apple officially launched its Vision Pro mixed reality headset in the United States, marking its entry into the augmented reality hardware market with a device that blends AR and VR capabilities.
  • Q2 2024: Snap partners with Live Nation to bring AR experiences to concerts Snap Inc. announced a partnership with Live Nation to integrate augmented reality features into live concerts, allowing attendees to access immersive AR experiences through the Snapchat app.
  • Q2 2024: Meta unveils new AR glasses in partnership with Ray-Ban Meta Platforms, Inc. launched a new generation of AR smart glasses in collaboration with Ray-Ban, featuring enhanced display technology and hands-free social media integration.
  • Q3 2024: Microsoft expands HoloLens 2 availability to new markets Microsoft announced the expansion of its HoloLens 2 augmented reality headset to additional international markets, aiming to increase enterprise adoption in manufacturing and healthcare sectors.
  • Q3 2024: Niantic acquires 8th Wall to boost AR development platform Niantic, the developer behind Pokémon Go, acquired AR development platform 8th Wall to strengthen its capabilities in web-based augmented reality experiences.
  • Q3 2024: Magic Leap raises $590 million in new funding round Magic Leap secured $590 million in a new funding round to accelerate the development and commercialization of its next-generation augmented reality headset.
  • Q4 2024: Meta and BMW announce partnership for in-car AR experiences Meta and BMW announced a partnership to develop augmented reality features for future BMW vehicles, aiming to enhance navigation and driver assistance systems.
  • Q4 2024: Google launches ARCore 3.0 with advanced spatial mapping Google released ARCore 3.0, the latest version of its augmented reality development platform, introducing advanced spatial mapping and improved object recognition for Android devices.
  • Q1 2025: Sony opens new AR R&D center in Tokyo Sony Corporation inaugurated a new research and development center in Tokyo dedicated to advancing augmented reality hardware and software technologies.
  • Q1 2025: Unity appoints new CEO to accelerate AR and VR strategy Unity Technologies appointed a new CEO with a mandate to drive the company's growth in augmented and virtual reality development tools.
  • Q2 2025: Vuzix wins contract to supply AR smart glasses to US Department of Defense Vuzix Corporation announced it has secured a contract to provide its augmented reality smart glasses to the US Department of Defense for use in field operations.
  • Q2 2025: Meta acquires AR startup WaveOptics to enhance display technology Meta acquired WaveOptics, a UK-based augmented reality display technology startup, to strengthen its hardware capabilities for future AR devices.

Future Outlook

Augmented Reality Market Future Outlook

<p>The Augmented Reality Market is projected to grow at a 35.49% CAGR from 2024 to 2035, driven by advancements in technology, increased adoption in various sectors, and enhanced user experiences.</p>

New opportunities lie in:

  • <p>Development of AR-enabled training programs for corporate sectors.</p><p>Integration of AR in e-commerce platforms for virtual try-ons.</p><p>Creation of location-based AR applications for tourism and navigation.</p>

<p>By 2035, the Augmented Reality Market is expected to be a pivotal component of digital transformation strategies.</p>

Market Segmentation

Augmented Reality Market Vertical Outlook

  • Consumer Electronics
  • Commercial
  • Aerospace & Defense
  • Medical

Augmented Reality Market Technology Outlook

  • Marker Based
  • Marker Less

Augmented Reality Market Device Type Outlook

  • Head Mounted Display
  • Head up Display

Report Scope

MARKET SIZE 202450.25(USD Billion)
MARKET SIZE 202568.08(USD Billion)
MARKET SIZE 20351419.67(USD Billion)
COMPOUND ANNUAL GROWTH RATE (CAGR)35.49% (2024 - 2035)
REPORT COVERAGERevenue Forecast, Competitive Landscape, Growth Factors, and Trends
BASE YEAR2024
Market Forecast Period2025 - 2035
Historical Data2019 - 2024
Market Forecast UnitsUSD Billion
Key Companies ProfiledMarket analysis in progress
Segments CoveredMarket segmentation analysis in progress
Key Market OpportunitiesIntegration of Augmented Reality in remote collaboration tools enhances user engagement and productivity.
Key Market DynamicsRising consumer demand for immersive experiences drives innovation and competition in the Augmented Reality Market.
Countries CoveredNorth America, Europe, APAC, South America, MEA

FAQs

What is the projected market valuation of the Augmented Reality Market by 2035?

The Augmented Reality Market is projected to reach a valuation of 1419.67 USD Billion by 2035.

What was the market valuation of the Augmented Reality Market in 2024?

In 2024, the Augmented Reality Market was valued at 50.25 USD Billion.

What is the expected CAGR for the Augmented Reality Market from 2025 to 2035?

The expected CAGR for the Augmented Reality Market during the forecast period 2025 - 2035 is 35.49%.

Which companies are considered key players in the Augmented Reality Market?

Key players in the Augmented Reality Market include Microsoft, Apple, Google, Facebook (Meta Platforms), Snap Inc., Niantic, PTC, Vuforia, Magic Leap, and Unity Technologies.

What are the main device types contributing to the Augmented Reality Market?

The main device types in the Augmented Reality Market include Head Mounted Displays and Head Up Displays, with valuations of 600.0 USD Billion and 819.67 USD Billion respectively.

How does the Augmented Reality Market perform across different verticals?

The Augmented Reality Market shows strong performance across various verticals, including Consumer Electronics at 284.12 USD Billion and Medical at 374.21 USD Billion.

  1. SECTION I: EXECUTIVE SUMMARY AND KEY HIGHLIGHTS
    1. EXECUTIVE SUMMARY
      1. Market Overview
      2. Key Findings
      3. Market Segmentation
      4. Competitive Landscape
      5. Challenges and Opportunities
      6. Future Outlook 2
  2. SECTION II: SCOPING, METHODOLOGY AND MARKET STRUCTURE
    1. MARKET INTRODUCTION
      1. Definition
      2. Scope of the study
    2. RESEARCH METHODOLOGY
      1. Overview
      2. Data Mining
      3. Secondary Research
      4. Primary Research
      5. Forecasting Model
      6. Market Size Estimation
      7. Data Triangulation
      8. Validation 3
  3. SECTION III: QUALITATIVE ANALYSIS
    1. MARKET DYNAMICS
      1. Overview
      2. Drivers
      3. Restraints
      4. Opportunities
    2. MARKET FACTOR ANALYSIS
      1. Value chain Analysis
      2. Porter's Five Forces Analysis
      3. COVID-19 Impact Analysis
  4. SECTION IV: QUANTITATIVE ANALYSIS
    1. Information and Communications Technology, BY Device Type (USD Billion)
      1. Head Mounted Display
      2. Head up Display
    2. Information and Communications Technology, BY Vertical (USD Billion)
      1. Consumer Electronics
      2. Commercial
      3. Aerospace & Defense
      4. Medical
    3. Information and Communications Technology, BY Technology (USD Billion)
      1. Marker Based
      2. Marker Less
    4. Information and Communications Technology, BY Region (USD Billion)
      1. North America
      2. Europe
      3. APAC
      4. South America
      5. MEA
  5. SECTION V: COMPETITIVE ANALYSIS
    1. Competitive Landscape
      1. Overview
      2. Competitive Analysis
      3. Market share Analysis
      4. Major Growth Strategy in the Information and Communications Technology
      5. Competitive Benchmarking
      6. Leading Players in Terms of Number of Developments in the Information and Communications Technology
      7. Key developments and growth strategies
      8. Major Players Financial Matrix
    2. Company Profiles
      1. Microsoft (US)
      2. Apple (US)
      3. Google (US)
      4. Facebook (Meta Platforms) (US)
      5. Snap Inc. (US)
      6. Niantic (US)
      7. PTC (US)
      8. Vuforia (US)
      9. Magic Leap (US)
      10. Unity Technologies (US)
    3. Appendix
      1. References
      2. Related Reports 6 LIST OF FIGURES
    4. MARKET SYNOPSIS
    5. NORTH AMERICA MARKET ANALYSIS
    6. US MARKET ANALYSIS BY DEVICE TYPE
    7. US MARKET ANALYSIS BY VERTICAL
    8. US MARKET ANALYSIS BY TECHNOLOGY
    9. CANADA MARKET ANALYSIS BY DEVICE TYPE
    10. CANADA MARKET ANALYSIS BY VERTICAL
    11. CANADA MARKET ANALYSIS BY TECHNOLOGY
    12. EUROPE MARKET ANALYSIS
    13. GERMANY MARKET ANALYSIS BY DEVICE TYPE
    14. GERMANY MARKET ANALYSIS BY VERTICAL
    15. GERMANY MARKET ANALYSIS BY TECHNOLOGY
    16. UK MARKET ANALYSIS BY DEVICE TYPE
    17. UK MARKET ANALYSIS BY VERTICAL
    18. UK MARKET ANALYSIS BY TECHNOLOGY
    19. FRANCE MARKET ANALYSIS BY DEVICE TYPE
    20. FRANCE MARKET ANALYSIS BY VERTICAL
    21. FRANCE MARKET ANALYSIS BY TECHNOLOGY
    22. RUSSIA MARKET ANALYSIS BY DEVICE TYPE
    23. RUSSIA MARKET ANALYSIS BY VERTICAL
    24. RUSSIA MARKET ANALYSIS BY TECHNOLOGY
    25. ITALY MARKET ANALYSIS BY DEVICE TYPE
    26. ITALY MARKET ANALYSIS BY VERTICAL
    27. ITALY MARKET ANALYSIS BY TECHNOLOGY
    28. SPAIN MARKET ANALYSIS BY DEVICE TYPE
    29. SPAIN MARKET ANALYSIS BY VERTICAL
    30. SPAIN MARKET ANALYSIS BY TECHNOLOGY
    31. REST OF EUROPE MARKET ANALYSIS BY DEVICE TYPE
    32. REST OF EUROPE MARKET ANALYSIS BY VERTICAL
    33. REST OF EUROPE MARKET ANALYSIS BY TECHNOLOGY
    34. APAC MARKET ANALYSIS
    35. CHINA MARKET ANALYSIS BY DEVICE TYPE
    36. CHINA MARKET ANALYSIS BY VERTICAL
    37. CHINA MARKET ANALYSIS BY TECHNOLOGY
    38. INDIA MARKET ANALYSIS BY DEVICE TYPE
    39. INDIA MARKET ANALYSIS BY VERTICAL
    40. INDIA MARKET ANALYSIS BY TECHNOLOGY
    41. JAPAN MARKET ANALYSIS BY DEVICE TYPE
    42. JAPAN MARKET ANALYSIS BY VERTICAL
    43. JAPAN MARKET ANALYSIS BY TECHNOLOGY
    44. SOUTH KOREA MARKET ANALYSIS BY DEVICE TYPE
    45. SOUTH KOREA MARKET ANALYSIS BY VERTICAL
    46. SOUTH KOREA MARKET ANALYSIS BY TECHNOLOGY
    47. MALAYSIA MARKET ANALYSIS BY DEVICE TYPE
    48. MALAYSIA MARKET ANALYSIS BY VERTICAL
    49. MALAYSIA MARKET ANALYSIS BY TECHNOLOGY
    50. THAILAND MARKET ANALYSIS BY DEVICE TYPE
    51. THAILAND MARKET ANALYSIS BY VERTICAL
    52. THAILAND MARKET ANALYSIS BY TECHNOLOGY
    53. INDONESIA MARKET ANALYSIS BY DEVICE TYPE
    54. INDONESIA MARKET ANALYSIS BY VERTICAL
    55. INDONESIA MARKET ANALYSIS BY TECHNOLOGY
    56. REST OF APAC MARKET ANALYSIS BY DEVICE TYPE
    57. REST OF APAC MARKET ANALYSIS BY VERTICAL
    58. REST OF APAC MARKET ANALYSIS BY TECHNOLOGY
    59. SOUTH AMERICA MARKET ANALYSIS
    60. BRAZIL MARKET ANALYSIS BY DEVICE TYPE
    61. BRAZIL MARKET ANALYSIS BY VERTICAL
    62. BRAZIL MARKET ANALYSIS BY TECHNOLOGY
    63. MEXICO MARKET ANALYSIS BY DEVICE TYPE
    64. MEXICO MARKET ANALYSIS BY VERTICAL
    65. MEXICO MARKET ANALYSIS BY TECHNOLOGY
    66. ARGENTINA MARKET ANALYSIS BY DEVICE TYPE
    67. ARGENTINA MARKET ANALYSIS BY VERTICAL
    68. ARGENTINA MARKET ANALYSIS BY TECHNOLOGY
    69. REST OF SOUTH AMERICA MARKET ANALYSIS BY DEVICE TYPE
    70. REST OF SOUTH AMERICA MARKET ANALYSIS BY VERTICAL
    71. REST OF SOUTH AMERICA MARKET ANALYSIS BY TECHNOLOGY
    72. MEA MARKET ANALYSIS
    73. GCC COUNTRIES MARKET ANALYSIS BY DEVICE TYPE
    74. GCC COUNTRIES MARKET ANALYSIS BY VERTICAL
    75. GCC COUNTRIES MARKET ANALYSIS BY TECHNOLOGY
    76. SOUTH AFRICA MARKET ANALYSIS BY DEVICE TYPE
    77. SOUTH AFRICA MARKET ANALYSIS BY VERTICAL
    78. SOUTH AFRICA MARKET ANALYSIS BY TECHNOLOGY
    79. REST OF MEA MARKET ANALYSIS BY DEVICE TYPE
    80. REST OF MEA MARKET ANALYSIS BY VERTICAL
    81. REST OF MEA MARKET ANALYSIS BY TECHNOLOGY
    82. KEY BUYING CRITERIA OF INFORMATION AND COMMUNICATIONS TECHNOLOGY
    83. RESEARCH PROCESS OF MRFR
    84. DRO ANALYSIS OF INFORMATION AND COMMUNICATIONS TECHNOLOGY
    85. DRIVERS IMPACT ANALYSIS: INFORMATION AND COMMUNICATIONS TECHNOLOGY
    86. RESTRAINTS IMPACT ANALYSIS: INFORMATION AND COMMUNICATIONS TECHNOLOGY
    87. SUPPLY / VALUE CHAIN: INFORMATION AND COMMUNICATIONS TECHNOLOGY
    88. INFORMATION AND COMMUNICATIONS TECHNOLOGY, BY DEVICE TYPE, 2024 (% SHARE)
    89. INFORMATION AND COMMUNICATIONS TECHNOLOGY, BY DEVICE TYPE, 2024 TO 2035 (USD Billion)
    90. INFORMATION AND COMMUNICATIONS TECHNOLOGY, BY VERTICAL, 2024 (% SHARE)
    91. INFORMATION AND COMMUNICATIONS TECHNOLOGY, BY VERTICAL, 2024 TO 2035 (USD Billion)
    92. INFORMATION AND COMMUNICATIONS TECHNOLOGY, BY TECHNOLOGY, 2024 (% SHARE)
    93. INFORMATION AND COMMUNICATIONS TECHNOLOGY, BY TECHNOLOGY, 2024 TO 2035 (USD Billion)
    94. BENCHMARKING OF MAJOR COMPETITORS 7 LIST OF TABLES
    95. LIST OF ASSUMPTIONS
    96. North America MARKET SIZE ESTIMATES; FORECAST
      1. BY DEVICE TYPE, 2025-2035 (USD Billion)
      2. BY VERTICAL, 2025-2035 (USD Billion)
      3. BY TECHNOLOGY, 2025-2035 (USD Billion)
    97. US MARKET SIZE ESTIMATES; FORECAST
      1. BY DEVICE TYPE, 2025-2035 (USD Billion)
      2. BY VERTICAL, 2025-2035 (USD Billion)
      3. BY TECHNOLOGY, 2025-2035 (USD Billion)
    98. Canada MARKET SIZE ESTIMATES; FORECAST
      1. BY DEVICE TYPE, 2025-2035 (USD Billion)
      2. BY VERTICAL, 2025-2035 (USD Billion)
      3. BY TECHNOLOGY, 2025-2035 (USD Billion)
    99. Europe MARKET SIZE ESTIMATES; FORECAST
      1. BY DEVICE TYPE, 2025-2035 (USD Billion)
      2. BY VERTICAL, 2025-2035 (USD Billion)
      3. BY TECHNOLOGY, 2025-2035 (USD Billion)
    100. Germany MARKET SIZE ESTIMATES; FORECAST
      1. BY DEVICE TYPE, 2025-2035 (USD Billion)
      2. BY VERTICAL, 2025-2035 (USD Billion)
      3. BY TECHNOLOGY, 2025-2035 (USD Billion)
    101. UK MARKET SIZE ESTIMATES; FORECAST
      1. BY DEVICE TYPE, 2025-2035 (USD Billion)
      2. BY VERTICAL, 2025-2035 (USD Billion)
      3. BY TECHNOLOGY, 2025-2035 (USD Billion)
    102. France MARKET SIZE ESTIMATES; FORECAST
      1. BY DEVICE TYPE, 2025-2035 (USD Billion)
      2. BY VERTICAL, 2025-2035 (USD Billion)
      3. BY TECHNOLOGY, 2025-2035 (USD Billion)
    103. Russia MARKET SIZE ESTIMATES; FORECAST
      1. BY DEVICE TYPE, 2025-2035 (USD Billion)
      2. BY VERTICAL, 2025-2035 (USD Billion)
      3. BY TECHNOLOGY, 2025-2035 (USD Billion)
    104. Italy MARKET SIZE ESTIMATES; FORECAST
      1. BY DEVICE TYPE, 2025-2035 (USD Billion)
      2. BY VERTICAL, 2025-2035 (USD Billion)
      3. BY TECHNOLOGY, 2025-2035 (USD Billion)
    105. Spain MARKET SIZE ESTIMATES; FORECAST
      1. BY DEVICE TYPE, 2025-2035 (USD Billion)
      2. BY VERTICAL, 2025-2035 (USD Billion)
      3. BY TECHNOLOGY, 2025-2035 (USD Billion)
    106. Rest of Europe MARKET SIZE ESTIMATES; FORECAST
      1. BY DEVICE TYPE, 2025-2035 (USD Billion)
      2. BY VERTICAL, 2025-2035 (USD Billion)
      3. BY TECHNOLOGY, 2025-2035 (USD Billion)
    107. APAC MARKET SIZE ESTIMATES; FORECAST
      1. BY DEVICE TYPE, 2025-2035 (USD Billion)
      2. BY VERTICAL, 2025-2035 (USD Billion)
      3. BY TECHNOLOGY, 2025-2035 (USD Billion)
    108. China MARKET SIZE ESTIMATES; FORECAST
      1. BY DEVICE TYPE, 2025-2035 (USD Billion)
      2. BY VERTICAL, 2025-2035 (USD Billion)
      3. BY TECHNOLOGY, 2025-2035 (USD Billion)
    109. India MARKET SIZE ESTIMATES; FORECAST
      1. BY DEVICE TYPE, 2025-2035 (USD Billion)
      2. BY VERTICAL, 2025-2035 (USD Billion)
      3. BY TECHNOLOGY, 2025-2035 (USD Billion)
    110. Japan MARKET SIZE ESTIMATES; FORECAST
      1. BY DEVICE TYPE, 2025-2035 (USD Billion)
      2. BY VERTICAL, 2025-2035 (USD Billion)
      3. BY TECHNOLOGY, 2025-2035 (USD Billion)
    111. South Korea MARKET SIZE ESTIMATES; FORECAST
      1. BY DEVICE TYPE, 2025-2035 (USD Billion)
      2. BY VERTICAL, 2025-2035 (USD Billion)
      3. BY TECHNOLOGY, 2025-2035 (USD Billion)
    112. Malaysia MARKET SIZE ESTIMATES; FORECAST
      1. BY DEVICE TYPE, 2025-2035 (USD Billion)
      2. BY VERTICAL, 2025-2035 (USD Billion)
      3. BY TECHNOLOGY, 2025-2035 (USD Billion)
    113. Thailand MARKET SIZE ESTIMATES; FORECAST
      1. BY DEVICE TYPE, 2025-2035 (USD Billion)
      2. BY VERTICAL, 2025-2035 (USD Billion)
      3. BY TECHNOLOGY, 2025-2035 (USD Billion)
    114. Indonesia MARKET SIZE ESTIMATES; FORECAST
      1. BY DEVICE TYPE, 2025-2035 (USD Billion)
      2. BY VERTICAL, 2025-2035 (USD Billion)
      3. BY TECHNOLOGY, 2025-2035 (USD Billion)
    115. Rest of APAC MARKET SIZE ESTIMATES; FORECAST
      1. BY DEVICE TYPE, 2025-2035 (USD Billion)
      2. BY VERTICAL, 2025-2035 (USD Billion)
      3. BY TECHNOLOGY, 2025-2035 (USD Billion)
    116. South America MARKET SIZE ESTIMATES; FORECAST
      1. BY DEVICE TYPE, 2025-2035 (USD Billion)
      2. BY VERTICAL, 2025-2035 (USD Billion)
      3. BY TECHNOLOGY, 2025-2035 (USD Billion)
    117. Brazil MARKET SIZE ESTIMATES; FORECAST
      1. BY DEVICE TYPE, 2025-2035 (USD Billion)
      2. BY VERTICAL, 2025-2035 (USD Billion)
      3. BY TECHNOLOGY, 2025-2035 (USD Billion)
    118. Mexico MARKET SIZE ESTIMATES; FORECAST
      1. BY DEVICE TYPE, 2025-2035 (USD Billion)
      2. BY VERTICAL, 2025-2035 (USD Billion)
      3. BY TECHNOLOGY, 2025-2035 (USD Billion)
    119. Argentina MARKET SIZE ESTIMATES; FORECAST
      1. BY DEVICE TYPE, 2025-2035 (USD Billion)
      2. BY VERTICAL, 2025-2035 (USD Billion)
      3. BY TECHNOLOGY, 2025-2035 (USD Billion)
    120. Rest of South America MARKET SIZE ESTIMATES; FORECAST
      1. BY DEVICE TYPE, 2025-2035 (USD Billion)
      2. BY VERTICAL, 2025-2035 (USD Billion)
      3. BY TECHNOLOGY, 2025-2035 (USD Billion)
    121. MEA MARKET SIZE ESTIMATES; FORECAST
      1. BY DEVICE TYPE, 2025-2035 (USD Billion)
      2. BY VERTICAL, 2025-2035 (USD Billion)
      3. BY TECHNOLOGY, 2025-2035 (USD Billion)
    122. GCC Countries MARKET SIZE ESTIMATES; FORECAST
      1. BY DEVICE TYPE, 2025-2035 (USD Billion)
      2. BY VERTICAL, 2025-2035 (USD Billion)
      3. BY TECHNOLOGY, 2025-2035 (USD Billion)
    123. South Africa MARKET SIZE ESTIMATES; FORECAST
      1. BY DEVICE TYPE, 2025-2035 (USD Billion)
      2. BY VERTICAL, 2025-2035 (USD Billion)
      3. BY TECHNOLOGY, 2025-2035 (USD Billion)
    124. Rest of MEA MARKET SIZE ESTIMATES; FORECAST
      1. BY DEVICE TYPE, 2025-2035 (USD Billion)
      2. BY VERTICAL, 2025-2035 (USD Billion)
      3. BY TECHNOLOGY, 2025-2035 (USD Billion)
    125. PRODUCT LAUNCH/PRODUCT DEVELOPMENT/APPROVAL
    126. ACQUISITION/PARTNERSHIP

Augmented Reality (AR) Market Segmentation

Augmented Reality (AR) Device Type Outlook (USD Billion, 2018-2032)

Head Mounted Display

Head up Display

Augmented Reality (AR) Vertical Outlook (USD Billion, 2018-2032)

Consumer Electronics

Commercial

Aerospace & Defense

Medical

Augmented Reality (AR) Technology Outlook (USD Billion, 2018-2032)

Marker Based

Marker Less

Augmented Reality (AR) Regional Outlook (USD Billion, 2018-2032)

North AmericaOutlook (USD Billion, 2018-2032)

North America Augmented Reality (AR) by Device Type

Head Mounted Display

Head up Display

North America Augmented Reality (AR) by Vertical

Consumer Electronics

Commercial

Bio-PET

Medical

North America Augmented Reality (AR) by Technology
  •  
    •  

Marker Based

Marker Less

US Outlook (USD Billion, 2018-2032)

US Augmented Reality (AR) by Device Type

Head Mounted Display

Head up Display

US Augmented Reality (AR) by Vertical

Consumer Electronics

Commercial

Aerospace & Defense

Medical

US Augmented Reality (AR) by Technology
  •  
    •  

Marker Based

Marker Less

CANADA Outlook (USD Billion, 2018-2032)

CANADA Augmented Reality (AR) by Device Type

Head Mounted Display

Head up Display

CANADA Augmented Reality (AR) by Vertical

Consumer Electronics

Commercial

Aerospace & Defense

CANADA Augmented Reality (AR) by Technology
  •  
    •  

Marker Based

Marker Less

Europe Outlook (USD Billion, 2018-2032)

Europe Augmented Reality (AR) by Device Type

Head Mounted Display

Head up Display

Europe Augmented Reality (AR) by Vertical

Consumer Electronics

Commercial

Aerospace & Defense

Medical

Europe Augmented Reality (AR) by Technology
  •  
    •  

Marker Based

Marker Less

Germany Outlook (USD Billion, 2018-2032)

Germany Augmented Reality (AR) by Device Type

Head Mounted Display

Head up Display

Germany Augmented Reality (AR) Vertical

Consumer Electronics

Commercial

Aerospace & Defense

Medical

Germany Augmented Reality (AR) by Technology
  •  
    •  

Marker Based

Marker Less

France Outlook (USD Billion, 2018-2032)

France Augmented Reality (AR) by Device Type

Head Mounted Display

Head up Display

France Augmented Reality (AR) by Vertical

Consumer Electronics

Bio-PA

Aerospace & Defense

Medical

France Augmented Reality (AR) by Technology
  •  
    •  

Marker Based

Marker Less

UK Outlook (USD Billion, 2018-2032)

UK Augmented Reality (AR) by Device Type

Head Mounted Display

Head up Display

UK Augmented Reality (AR) by Vertical

Consumer Electronics

Commercial

Aerospace & Defense

Medical

UK Augmented Reality (AR) by Technology
  •  
    •  

Marker Based

Marker Less

ITALY Outlook (USD Billion, 2018-2032)

ITALY Augmented Reality (AR) by Device Type

Head Mounted Display

Head up Display

ITALY Augmented Reality (AR) by Vertical

Consumer Electronics

Commercial

Aerospace & Defense

Medical

ITALY Augmented Reality (AR) by Technology
  •  
    •  

Marker Based

Marker Less

SPAIN Outlook (USD Billion, 2018-2032)

Spain Augmented Reality (AR) by Device Type

Head Mounted Display

Head up Display

Spain Augmented Reality (AR) by Vertical

Consumer Electronics

Bio-PA

Aerospace & Defense

Medical

Spain Augmented Reality (AR) by Technology
  •  
    •  

Marker Based

Marker Less

Rest Of Europe Outlook (USD Billion, 2018-2032)

Rest Of Europe Augmented Reality (AR) by Device Type

Head Mounted Display

Head up Display

REST OF EUROPE Augmented Reality (AR) by Vertical

Consumer Electronics

Commercial

Aerospace & Defense

Medical

REST OF EUROPE Augmented Reality (AR) by Technology
  •  
    •  

Marker Based

Marker Less

Asia-Pacific Outlook (USD Billion, 2018-2032)

Asia-Pacific Augmented Reality (AR) by Device Type

Head Mounted Display

Head up Display

Asia-Pacific Augmented Reality (AR) by Vertical

Consumer Electronics

Commercial

Aerospace & Defense

Medical

Asia-Pacific Augmented Reality (AR) by Technology
  •  
    •  

Marker Based

Marker Less

China Outlook (USD Billion, 2018-2032)

China Augmented Reality (AR) by Device Type

Head Mounted Display

Head up Display

China Augmented Reality (AR) by Vertical

Consumer Electronics

Commercial

Aerospace & Defense

Medical

China Augmented Reality (AR) by Technology
  •  
    •  

Marker Based

Marker Less

Japan Outlook (USD Billion, 2018-2032)

Japan Augmented Reality (AR) by Device Type

Head Mounted Display

Head up Display

Japan Augmented Reality (AR) by Vertical

Consumer Electronics

Commercial

Aerospace & Defense

Medical

Japan Augmented Reality (AR) by Technology
  •  
    •  

Marker Based

Marker Less

India Outlook (USD Billion, 2018-2032)

India Augmented Reality (AR) by Device Type

Head Mounted Display

Head up Display

India Augmented Reality (AR) by Vertical

Consumer Electronics

Commercial

Aerospace & Defense

Medical

India Augmented Reality (AR) by Technology
  •  
    •  

Marker Based

Marker Less

Australia Outlook (USD Billion, 2018-2032)

Australia Augmented Reality (AR) by Device Type

Head Mounted Display

Head up Display

Australia Augmented Reality (AR) by Vertical

Consumer Electronics

Bio-PA

Aerospace & Defense

Medical

Australia Augmented Reality (AR) by Technology
  •  
    •  

Marker Based

Marker Less

Rest of Asia-Pacific Outlook (USD Billion, 2018-2032)

Rest of Asia-Pacific Augmented Reality (AR) by Device Type

Head Mounted Display

Head up Display

Rest of Asia-Pacific Augmented Reality (AR) by Vertical

Consumer Electronics

Commercial

Aerospace & Defense

Medical

Rest of Asia-Pacific Augmented Reality (AR) by Technology
  •  
    •  

Marker Based

Marker Less

Rest of the World Outlook (USD Billion, 2018-2032)

Rest of the World Augmented Reality (AR) by Device Type

Head Mounted Display

Head up Display

Rest of the World Augmented Reality (AR) by Vertical

Consumer Electronics

Commercial

Aerospace & Defense

Medical

Rest of the World Augmented Reality (AR) by Technology
  •  
    •  

Marker Based

Marker Less

Middle East Outlook (USD Billion, 2018-2032)

Middle East Augmented Reality (AR) by Device Type

Head Mounted Display

Head up Display

Middle East Augmented Reality (AR) by Vertical

Consumer Electronics

Commercial

Aerospace & Defense

Medical

Middle East Augmented Reality (AR) by Technology
  •  
    •  

Marker Based

Marker Less

Africa Outlook (USD Billion, 2018-2032)

Africa Augmented Reality (AR) by Device Type

Head Mounted Display

Head up Display

Africa Augmented Reality (AR) by Vertical

Consumer Electronics

Commercial

Aerospace & Defense

Medical

Africa Augmented Reality (AR) by Technology
  •  
    •  

Marker Based

Marker Less

Latin America Outlook (USD Billion, 2018-2032)

Latin America Augmented Reality (AR) by Device Type

Head Mounted Display

Head up Display

Latin America Augmented Reality (AR) by Vertical

Consumer Electronics

Commercial

Aerospace & Defense

Medical

Latin America Augmented Reality (AR) by Technology
  •  
    •  

Marker Based

Marker Less


Infographic

Free Sample Request

Kindly complete the form below to receive a free sample of this Report

Get Free Sample

Customer Strories

“I am very pleased with how market segments have been defined in a relevant way for my purposes (such as "Portable Freezers & refrigerators" and "last-mile"). In general the report is well structured. Thanks very much for your efforts.”

Victoria Milne

Founder

Compare Licence

×
Features License Type
Single User Multiuser License Enterprise User
Price $4,950 $5,950 $7,250
Maximum User Access Limit 1 User Upto 10 Users Unrestricted Access Throughout the Organization
Free Customization
Direct Access to Analyst
Deliverable Format
Platform Access
Discount on Next Purchase 10% 15% 15%
Printable Versions