ID: MRFR/MED/3529-HCR | February 2021 | Region: Global | 100 Pages
TABLE OF CONTENT
Chapter 1. Report Prologue
Chapter 2. Market Introduction
2.1 Definition
2.2 Scope Of The Study
2.2.1 Research Objective
2.2.2 Assumptions
2.2.3 Limitations
Chapter 3. Research Methodology
3.1 Introduction
3.2 Primary Research
3.3 Secondary Research
3.4 Market Size Estimation
Chapter 4. Market Dynamics
4.1 Drivers
4.2 Restrains
4.3 Opportunities
4.4 Challenges
4.5 Macroeconomic Indicators
4.6 Technology Trends & Assessment
Chapter 5. Market Factor Analysis
5.1 Porterβs Five Forces Analysis
5.1.1 Bargaining Power Of Suppliers
5.1.2 Bargaining Power Of Buyers
5.1.3 Threat Of New Entrants
5.1.4 Threat Of Substitutes
5.1.5 Intensity Of Rivalry
5.2 Value Chain Analysis
5.3 Investment Feasibility Analysis
5.4 Pricing Analysis
Chapter 6. Global Augmented Bone Graft Market, By Imaging Modality
6.1 Introduction
6.2 Allografts
6.2.1 Market Estimates & Forecast, 2016 β 2023
6.3 Bone Grafts Substitutes
6.3.1 Market Estimates & Forecast, 2016 β 2023
6.4 Cell-Based Matrices
6.4.1 Market Estimates & Forecast, 2016 β 2023
Chapter 7. Global Augmented Bone Graft Market, By Applications
7.1 Introduction
7.2 Craniomaxillofacial
7.2.1 Market Estimates & Forecast, 2020 β 2027
7.3 Dental
7.3.1 Market Estimates & Forecast, 2020 β 2027
7.4 Foot & Ankle
7.4.1 Market Estimates & Forecast, 2020 β 2027
7.5 Joint Reconstruction
7.5.1 Market Estimates & Forecast, 2020 β 2027
7.6 Long Bone
7.6.1 Market Estimates & Forecast, 2020 β 2027
7.7 Spinal Fusion
7.7.1 Market Estimates & Forecast, 2020 β 2027
Chapter 8. Global Augmented Bone Graft Market, By End User
8.1 Introduction
8.2 Hospitals
8.2.1 Market Estimates & Forecast, 2020 β 2027
8.3 Clinics
8.3.2 Market Estimates & Forecast, 2020 β 2027
8.4 Ambulatory Surgical Centers
8.4.2 Market Estimates & Forecast, 2020 β 2027
8.5 Others
8.5.2 Market Estimates & Forecast, 2020 β 2027
Chapter .9 Global Augmented Bone Graft Market, By Region
9.1 Introduction
9.2 Americas
9.2.1 North America
9.2.1.1 U.S.
9.2.1.1 Canada
9.2.2 South America
9.3 Europe
9.3.1 Western Europe
9.3.1.1 Germany
9.3.1.2 France
9.3.1.3 Italy
9.3.1.4 Spain
9.3.1.5 U.K
9.3.1.6 Rest Of Western Europe
9.3.2 Eastern Europe
9.4 Asia Pacific
9.4.1 Japan
9.4.2 China
9.4.3 India
9.4.4 Australia
9.4.5 Republic Of Korea
9.4.6 Rest Of Asia Pacific
9.5 The Middle East & Africa
9.5.1 United Arab Emirates
9.5.2 Saudi Arabia
9.5.3 Oman
9.5.4 Kuwait
9.5.5 Qatar
9.5.6 Rest Of The Middle East & Africa
Chapter 10 Company Landscape
10.1 Introduction
10.2 Market Share Analysis
10.3 Key Development & Strategies
10.3.1 Key Developments
Chapter 11 Company Profiles
11.1 Wright Medical Group
11.1.1 Company Overview
11.1.2 Product Overview
11.1.3 Financials
11.1.4 SWOT Analysis
11.2 Zimmer Holdings, Inc.
11.2.1 Company Overview
11.2.2 Product Overview
11.2.3 Financial Overview
11.2.4 Key Developments
11.2.5 SWOT Analysis
11.3 BioMimetic Therapeutics LLC
11.3.1 Company Overview
11.3.2 Product Overview
11.3.3 Financial Overview
11.3.4 Key Development
11.3.5 SWOT Analysis
11.4 Stryker Corporation
11.4.1 Company Overview
11.4.2 Product/Business Segment Overview
11.4.3 Financial Overview
11.4.4 Key Development
11.4.5 SWOT Analysis
11.5 NovaBone Products LLC
11.5.1 Company Overview
11.5.2 Product Overview
11.5.3 Financial Overview
11.5.4 Key Developments
11.6 RTI Surgical, Inc.
11.6.1 Company Overview
11.6.2 Product Overview
11.6.3 Financial Overview
11.6.4 Key Developments
11.7 Olympus Biotech Corporation.
11.7.1 Overview
11.7.2 Product Overview
11.7.3 Financials
11.7.4 Key Developments
11.7.5 SWOT Analysis
11.8 NuVasive, Inc.
11.8.1 Company Overview
11.8.2 Product/Business Segment Overview
11.8.3 Financial Overview
11.8.4 Key Development
11.8.5 SWOT Analysis
11.9 Smith & Nephew Plc
11.9.1 Company Overview
11.9.2 Product Overview
11.9.3 Financial Overview
11.9.4 Key Developments
11.10 Others
Chapter 12 MRFR Conclusion
12.1 Key Findings
12.1.1 From CEOβs View Point
12.1.2 Unmet Needs Of The Market
12.2 Key Companies To Watch
12.3 Prediction Of Pharmaceutical Industry
Chapter 13 Appendix
LIST OF TABLES
Table 1 Augmented Bone Graft Industry Synopsis, 2020 β 2027
Table 2 Augmented Bone Graft Market Estimates And Forecast, 2020 β 2027, (USD Million)
Table 3 Augmented Bone Graft Market By Region, 2020 β 2027, (USD Million)
Table 4 Augmented Bone Graft Market By Diagnosis, 2020 β 2027, (USD Million)
Table 5 Augmented Bone Graft Market By Treatment, 2020 β 2027, (USD Million)
Table 6 Augmented Bone Graft Market By End Users, 2020 β 2027, (USD Million)
Table 7 North America Augmented Bone Graft Market By Diagnosis, 2020 β 2027, (USD Million)
Table 8 North America Augmented Bone Graft Market By Treatment, 2020 β 2027, (USD Million)
Table 9 North America Augmented Bone Graft Market By End Users, 2020 β 2027, (USD Million)
Table 10 US Augmented Bone Graft Market By Diagnosis, 2020 β 2027, (USD Million)
Table 11 US Augmented Bone Graft Market By Treatment, 2020 β 2027, (USD Million)
Table 12 US Augmented Bone Graft Market By End Users, 2020 β 2027, (USD Million)
Table 13 Canada Augmented Bone Graft Market By Diagnosis, 2020 β 2027, (USD Million)
Table 14 Canada Augmented Bone Graft Market By Treatment, 2020 β 2027, (USD Million)
Table 15 Canada Augmented Bone Graft Market By End Users, 2020 β 2027, (USD Million)
Table 16 South America Augmented Bone Graft Market By Diagnosis, 2020 β 2027, (USD Million)
Table 17 South America Augmented Bone Graft Market By Treatment, 2020 β 2027, (USD Million)
Table 18 South America Augmented Bone Graft Market By End Users, 2020 β 2027, (USD Million)
Table 19 Europe Augmented Bone Graft Market By Diagnosis, 2020 β 2027, (USD Million)
Table 20 Europe Augmented Bone Graft Market By Treatment, 2020 β 2027, (USD Million)
Table 21 Europe Augmented Bone Graft Market By End Users, 2020 β 2027, (USD Million)
Table 22 Western Europe Augmented Bone Graft Market By Diagnosis, 2020 β 2027, (USD Million)
Table 23 Western Europe Augmented Bone Graft Market By Treatment, 2020 β 2027, (USD Million)
Table 24 Western Europe Augmented Bone Graft Market By End Users, 2020 β 2027, (USD Million)
Table 25 Eastern Europe Augmented Bone Graft Market By Diagnosis, 2020 β 2027, (USD Million)
Table 26 Eastern Europe Augmented Bone Graft Market By Treatment, 2020 β 2027, (USD Million)
Table 27 Eastern Europe Augmented Bone Graft Market By End Users, 2020 β 2027, (USD Million)
Table 28 Asia Pacific Augmented Bone Graft Market By Diagnosis, 2020 β 2027, (USD Million)
Table 29 Asia Pacific Augmented Bone Graft Market By Treatment, 2020 β 2027, (USD Million)
Table 30 Asia Pacific Augmented Bone Graft Market By End Users, 2020 β 2027, (USD Million)
Table 31 Middle East & Africa Augmented Bone Graft Market By Diagnosis, 2020 β 2027, (USD Million)
Table 32 Middle East & Africa Augmented Bone Graft Market By Treatment, 2020 β 2027, (USD Million)
Table 33 Middle East & Africa Augmented Bone Graft Market By End Users, 2020 β 2027, (USD Million)
LIST OF FIGURES
Figure 1 Research Process
Figure 2 Segmentation For Augmented Bone Graft Market
Figure 3 Segmentation Market Dynamics For Augmented Bone Graft Market
Figure 4 Global Augmented Bone Graft Market Share, By Diagnosis 2016
Figure 5 Global Augmented Bone Graft Market Share, By Treatment 2016
Figure 6 Global Augmented Bone Graft Market Share, By End Users, 2016
Figure 7 Global Augmented Bone Graft Market Share, By Region, 2016
Figure 8 North America Augmented Bone Graft Market Share, By Country, 2016
Figure 9 Europe Augmented Bone Graft Market Share, By Country, 2016
Figure 10 Asia Pacific Augmented Bone Graft Market Share, By Country, 2016
Figure 11 Middle East & Africa Augmented Bone Graft Market Share, By Country, 2016
Figure 12 Global Augmented Bone Graft Market: Company Share Analysis, 2016 (%)
Figure 13 Wright Medical Technology, Inc.: Key Financials
Figure 14 Wright Medical Technology, Inc.: Segmental Revenue
Figure 15 Wright Medical Technology, Inc.: Geographical Revenue
Figure 16 Zimmer Holdings, Inc.: Key Financials
Figure 17 Zimmer Holdings, Inc.: Segmental Revenue
Figure 18 Zimmer Holdings, Inc.: Geographical Revenue
Figure 19 BioMimetic Therapeutics LLC: Key Financials
Figure 20 BioMimetic Therapeutics LLC: Segmental Revenue
Figure 21 BioMimetic Therapeutics LLC: Geographical Revenue
Figure 22 Stryker Corporation: Key Financials
Figure 23 Stryker Corporation: Segmental Revenue
Figure 24 Stryker Corporation: Geographical Revenue
Figure 25 RTI Surgical, Inc: Key Financials
Figure 26 RTI Surgical, Inc: Segmental Revenue
Figure 27 RTI Surgical, Inc: Geographical Revenue
Figure 28 Olympus Biotech Corporation: Key Financials
Figure 29 Olympus Biotech Corporation: Segmental Revenue
Figure 30 Olympus Biotech Corporation: Geographical Revenue
Figure 31 NuVasive, Inc.: Key Financials
Figure 32 NuVasive, Inc.: Segmental Revenue
Figure 33 NuVasive, Inc.: Geographical Revenue
Figure 34 NovaBone Products LLC: Key Financials
Figure 35 NovaBone Products LLC: Segmental Revenue
Figure 36 NovaBone Products LLC: Geographical Revenue
Figure 37 Smith & Nephew Plc: Key Financials
Figure 38 Smith & Nephew Plc: Segmental Revenue
Figure 39 Smith & Nephew Plc: Geographical Revenue
Augmented Bone Grafts are gaining prominence in the bone graft market. The increasing incidence of musculoskeletal conditions and technological advancements in medical devices leading to shift from autograft to allograft procedures are some factors responsible for the growth of the augmented bone grafts market.
Augment Bone Graft is a combination drug/device product used for repairing the bone and reviving its regenerative properties. It is used as an alternative to autograft in arthrodesis of the ankle or hindfoot indicating the need for supplemental graft material. The use of augment bone graft eliminates the need for a second surgery to harvest autologous bone, thereby avoiding donor site morbidity. According to the National Health Interview Survey, in 2012, around 126 million adults were affected by this disease in the U.S. According to the Labor Force Survey (LFS), about 553,000 cases were registered for all work-related musculoskeletal disorder out of the total of 1,243,000 cases.
Allografts and bovine-derived bone graft products dominate the augmented bone graft market. These materials have variations in particle size which is their main drawback. The recent technological trend is to replace these natural materials with alloplastic bone grafts such as ceramics and polymers as they can be manufactured to the precise size and characteristics.
According to the British Editorial Society of Bone & Joint Surgery, bone is the second most common transplanted tissue after blood with an estimated 2.2 million grafting procedures worldwide annually as recorded in 2015. This development has been fuelled by the increasing cases of fractures and accidents around the world. There has been increasing acceptance of bone grafting procedures which drives the Augmented Bone Graft Market products. Many healthcare professionals have started using these bone grafts, especially in tertiary care centers and specialty hospitals which may promote and increase the demand for augmented bone graft. These bone graft works in a unique way to stimulate three key processes of early bone healing.
Various other factors such as, increasing advancement in technology, and rising adoption rate of new technology continuously contribute to the growth of Augmented Bone Graft Market. Despite these developments, high cost of surgeries and ethical issues related with bone grafting procedures may hamper the growth of the market. For instance, a study conducted by BMC Medical Ethics states that in a sample of 100 patients, about 20% of the patients refuse to accept allografts for their grafting surgery.
Additionally, stringent regulations obstruct the growth of bone grafts market and inadequate reimbursement policies for bone grafting also hampers the growth of global bone grafts market. Rapid product launches and increasing mergers and acquisitions between bone graft systems manufacturing companies are some of the major trends in the Augmented Bone Graft Market.
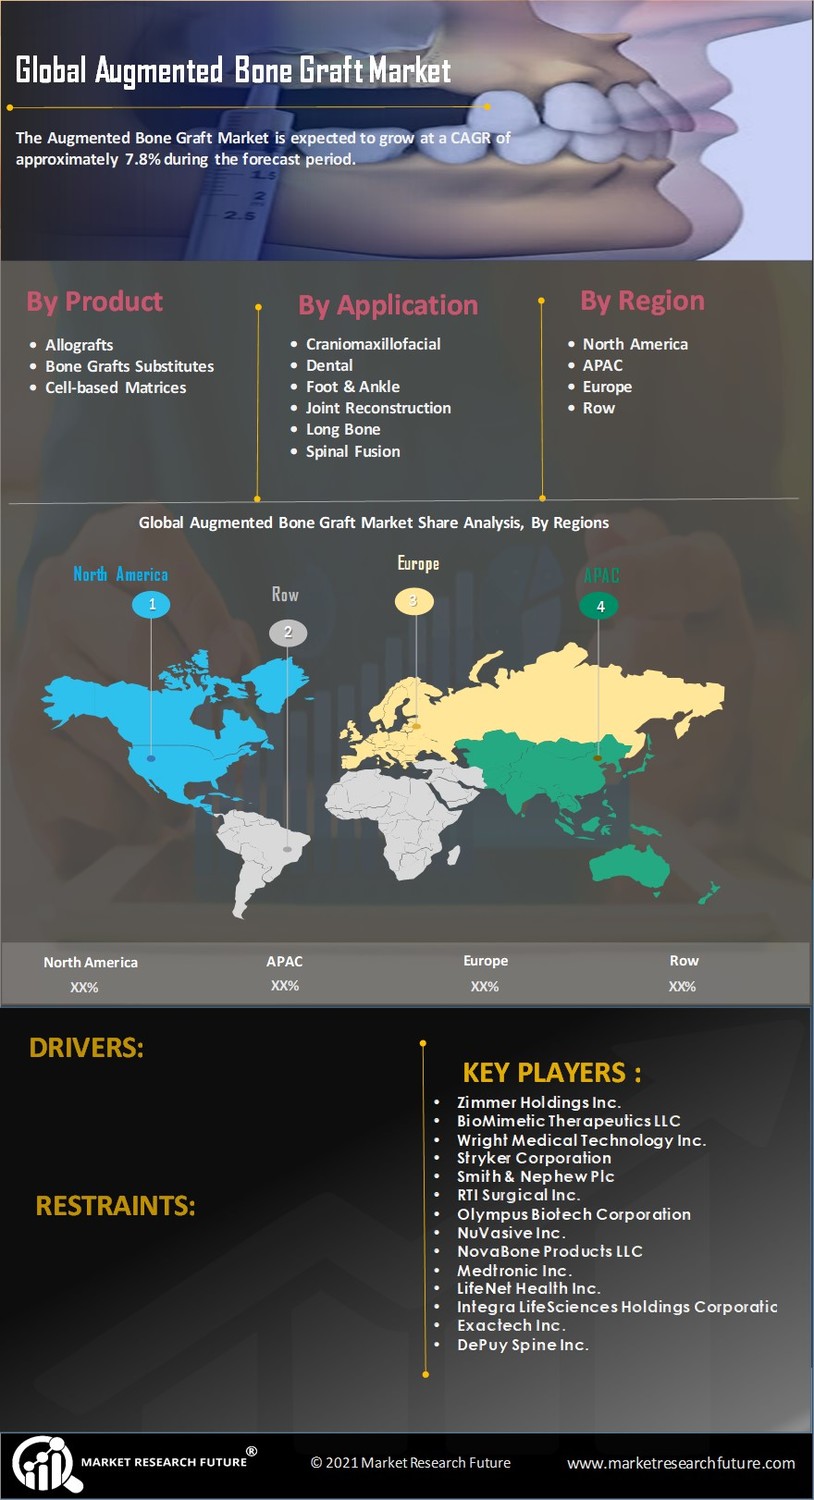
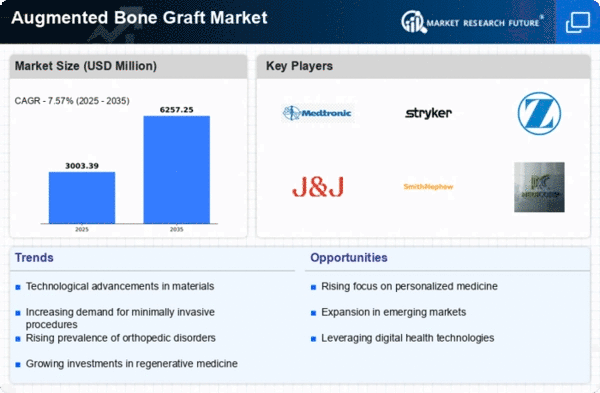
The Augmented Bone Graft Market is expected to grow at a CAGR of approximately 7.8% during the forecast period 2017-2023.
Intended Audience
Segmentation
The Augmented Bone Graft Market is segmented on the basis of products, application, and end-users.
On the basis of product, the market is segmented into the Allografts, Bone Grafts Substitutes, and Cell-based Matrices. The Allografts segment is further sub divided into Machined Allografts and Demineralized Bone Matrix. The Bone Grafts Substitutes is also sub categorized as Bone Morphogenic Proteins (BMP) and Synthetic Bone Grafts.
On the basis of application, the market is segmented into the Craniomaxillofacial, Dental, Foot & Ankle, Joint Reconstruction, Long Bone, and Spinal Fusion
On the basis of end-user, the market is segmented into hospitals, clinics, ambulatory surgical centers and others.
Regional Analysis
The Augmented Bone Graft Market consists of countries namely America, Europe, Asia Pacific, and the Middle East.
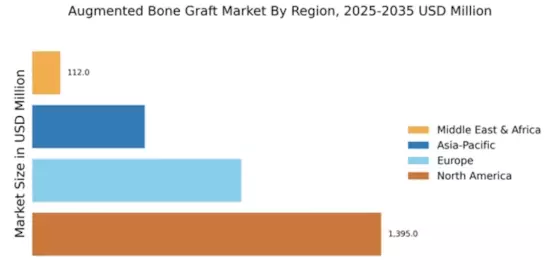
North America dominated the global augmented bone graft market owing to the increasing healthcare expenditure in North America since 2016. Canadian healthcare specifically was stressed by an advancing demographic move. The increase of insurance coverage because of health care reform (Affordable Care Act) in the United States additionally prompted an expansion in health care spending. In 2016, healthcare organizations found liberation from a special tax on medical devices (Medical Device Excise Tax). The United States Congress put off the tax for a long two years in 2015.
For Europe, the healthcare spending has expanded slightly in Germany. Neverthelss, the orthopedic biologics market including the bone graft substitute market has been determined by solid strong competition and price pressure. While volume of sales and the scope of new treatment techniques are on the ascent, net revenues in the German market are declining. Western Europe continues to see a need to save money on healthcare because of a slight drop in financial growth and obstinate economic pressure.
Healthcare spending in Asia expanded in 2016 due to an extension of state health care programs and the increasing affluence of the population. India, in specific, saw an expansion in spending due to a government resolution to enhance healthcare services.
Furthermore in the Middle East & Africa the spending for healthcare was also increased. This was essentially because of elections in a few nations, (for example, Ghana, Niger, Uganda, Zambia and Somalia), healthcare growth and population growth. Awareness for medicinal technology likewise expanded extraordinarily. Due to of low local production, the region is dependent on imported medicinal products. The import standard in numerous nations is 80% to 90%.
Key Players
Many new companies have jumped into the market in order to make the most out of the opportunities. Companies are implementing the strategies of mergers and acquisitions with other players. For example, the Stryker Corporation, in order to enhance its business, acquired companies such as Novadaq Technologies Inc. in 2017, Stanmore Implants Worldwide Limited, Physio-Control International Inc, & Vertebral compression fracture portfolio from BD in 2016; and some other companies in the recent past.
Some of key the players in the Augmented Bone Graft Market are Zimmer Holdings, Inc., BioMimetic Therapeutics LLC, Wright Medical Technology, Inc., Stryker Corporation, Smith & Nephew Plc, RTI Surgical, Inc., Olympus Biotech Corporation, NuVasive, Inc., NovaBone Products LLC, Medtronic, Inc., LifeNet Health, Inc., Integra LifeSciences Holdings Corporation, Exactech, Inc., DePuy Spine, Inc., Synthes Inc., DePuy Synthes Companies, Biomet, Inc. and AlloSource.
Research Methodology
Sources: Annual reports, Press release, White paper, and Company presentation
Frequently Asked Questions (FAQ) :
Augmented bone graft market is projected to grow at approximately 7.8% CAGR during the assessment period (2017-2023).
Increasing incidence of musculoskeletal conditions and technological advancements in medical devices leading to shift from autograft to allograft procedures are the major tailwinds pushing the growth of the global augmented bone graft market.
High cost of surgeries and ethical issues related with bone grafting procedures are major growth impeders for the global augmented bone graft market.
North America holds the largest share in the global augmented bone graft market, followed by Europe and the Asia Pacific, respectively.
BioMimetic Therapeutics LLC, Zimmer Holdings, Inc., Wright Medical Technology, Inc., Smith & Nephew Plc, Stryker Corporation, RTI Surgical, Inc., NuVasive, Inc., Olympus Biotech Corporation, NovaBone Products LLC, LifeNet Health, Inc., Medtronic, Inc., Integra LifeSciences Holdings Corporation, DePuy Spine, Inc., Exactech, Inc., Synthes Inc., Biomet, Inc. DePuy Synthes Companies, and AlloSource, are some of the top players operating in the global augmented bone graft market.