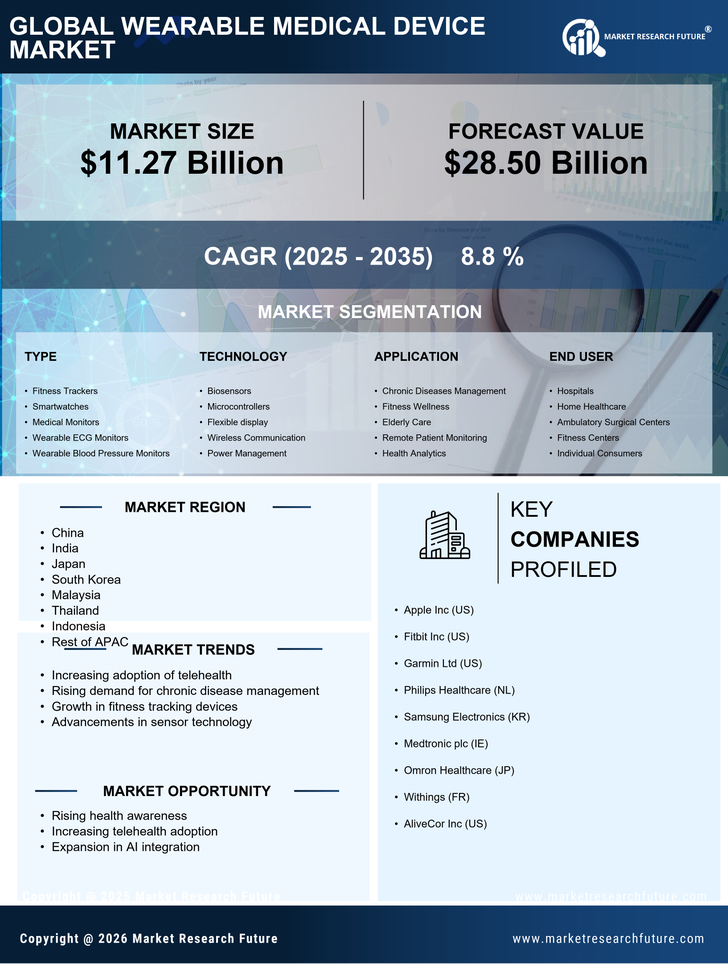
Request Free Sample ×

Kindly complete the form below to receive a free sample of this Report

* Please use a valid business email

Leading companies partner with us for data-driven Insights

clients tt-cursor
Hero Background

Asia Pacific Wearable Medical Device Market

ID: MRFR/MED/0186-HCR
128 Pages
Rahul Gotadki
Last Updated: April 06, 2026

Asia Pacific Wearable Medical Device Market Research Report Information By Type (Diagnostic Devices and Therapeutic Devices), By Device (Wristwatch/Wristband, Smart Clothing, Smartwatch, Ear Wear, and Others), By Site (Headband, Handheld, Arm & Wrist, Clip, Shoe Sensor, and Others), By Application (Cardiac Health, Obesity Control, Diabetes Care, Fitness Monitoring, and Sleep Tracking) – APAC Market Forecast Till 2035

Share:
Download PDF ×

We do not share your information with anyone. However, we may send you emails based on your report interest from time to time. You may contact us at any time to opt-out.

Asia Pacific Wearable Medical Device Market Infographic
Purchase Options
  1. 1 SECTION I: EXECUTIVE SUMMARY AND KEY HIGHLIGHTS
  2.   1.1 EXECUTIVE SUMMARY
  3.     1.1.1 Market Overview
  4.     1.1.2 Key Findings
  5.     1.1.3 Market Segmentation
  6.     1.1.4 Competitive Landscape
  7.     1.1.5 Challenges and Opportunities
  8.     1.1.6 Future Outlook
  9. 2 SECTION II: SCOPING, METHODOLOGY AND MARKET STRUCTURE
  10.   2.1 MARKET INTRODUCTION
  11.     2.1.1 Definition
  12.     2.1.2 Scope of the study
  13.       2.1.2.1 Research Objective
  14.       2.1.2.2 Assumption
  15.       2.1.2.3 Limitations
  16.   2.2 RESEARCH METHODOLOGY
  17.     2.2.1 Overview
  18.     2.2.2 Data Mining
  19.     2.2.3 Secondary Research
  20.     2.2.4 Primary Research
  21.       2.2.4.1 Primary Interviews and Information Gathering Process
  22.       2.2.4.2 Breakdown of Primary Respondents
  23.     2.2.5 Forecasting Model
  24.     2.2.6 Market Size Estimation
  25.       2.2.6.1 Bottom-Up Approach
  26.       2.2.6.2 Top-Down Approach
  27.     2.2.7 Data Triangulation
  28.     2.2.8 Validation
  29. 3 SECTION III: QUALITATIVE ANALYSIS
  30.   3.1 MARKET DYNAMICS
  31.     3.1.1 Overview
  32.     3.1.2 Drivers
  33.     3.1.3 Restraints
  34.     3.1.4 Opportunities
  35.   3.2 MARKET FACTOR ANALYSIS
  36.     3.2.1 Value chain Analysis
  37.     3.2.2 Porter's Five Forces Analysis
  38.       3.2.2.1 Bargaining Power of Suppliers
  39.       3.2.2.2 Bargaining Power of Buyers
  40.       3.2.2.3 Threat of New Entrants
  41.       3.2.2.4 Threat of Substitutes
  42.       3.2.2.5 Intensity of Rivalry
  43.     3.2.3 COVID-19 Impact Analysis
  44.       3.2.3.1 Market Impact Analysis
  45.       3.2.3.2 Regional Impact
  46.       3.2.3.3 Opportunity and Threat Analysis
  47. 4 SECTION IV: QUANTITATIVE ANALYSIS
  48.   4.1 Industrial Automation & Equipment, BY Type (USD Billion)
  49.     4.1.1 Fitness Trackers
  50.     4.1.2 Smartwatches
  51.     4.1.3 Medical Monitors
  52.     4.1.4 Wearable ECG Monitors
  53.     4.1.5 Wearable Blood Pressure Monitors
  54.   4.2 Industrial Automation & Equipment, BY Technology (USD Billion)
  55.     4.2.1 Biosensors
  56.     4.2.2 Microcontrollers
  57.     4.2.3 Flexible display
  58.     4.2.4 Wireless Communication
  59.     4.2.5 Power Management
  60.   4.3 Industrial Automation & Equipment, BY Application (USD Billion)
  61.     4.3.1 Chronic Diseases Management
  62.     4.3.2 Fitness Wellness
  63.     4.3.3 Elderly Care
  64.     4.3.4 Remote Patient Monitoring
  65.     4.3.5 Health Analytics
  66.   4.4 Industrial Automation & Equipment, BY End User (USD Billion)
  67.     4.4.1 Hospitals
  68.     4.4.2 Home Healthcare
  69.     4.4.3 Ambulatory Surgical Centers
  70.     4.4.4 Fitness Centers
  71.     4.4.5 Individual Consumers
  72. 5 SECTION V: COMPETITIVE ANALYSIS
  73.   5.1 Competitive Landscape
  74.     5.1.1 Overview
  75.     5.1.2 Competitive Analysis
  76.     5.1.3 Market share Analysis
  77.     5.1.4 Major Growth Strategy in the Industrial Automation & Equipment
  78.     5.1.5 Competitive Benchmarking
  79.     5.1.6 Leading Players in Terms of Number of Developments in the Industrial Automation & Equipment
  80.     5.1.7 Key developments and growth strategies
  81.       5.1.7.1 New Product Launch/Service Deployment
  82.       5.1.7.2 Merger & Acquisitions
  83.       5.1.7.3 Joint Ventures
  84.     5.1.8 Major Players Financial Matrix
  85.       5.1.8.1 Sales and Operating Income
  86.       5.1.8.2 Major Players R&D Expenditure. 2023
  87.   5.2 Company Profiles
  88.     5.2.1 Apple Inc (US)
  89.       5.2.1.1 Financial Overview
  90.       5.2.1.2 Products Offered
  91.       5.2.1.3 Key Developments
  92.       5.2.1.4 SWOT Analysis
  93.       5.2.1.5 Key Strategies
  94.     5.2.2 Fitbit Inc (US)
  95.       5.2.2.1 Financial Overview
  96.       5.2.2.2 Products Offered
  97.       5.2.2.3 Key Developments
  98.       5.2.2.4 SWOT Analysis
  99.       5.2.2.5 Key Strategies
  100.     5.2.3 Garmin Ltd (US)
  101.       5.2.3.1 Financial Overview
  102.       5.2.3.2 Products Offered
  103.       5.2.3.3 Key Developments
  104.       5.2.3.4 SWOT Analysis
  105.       5.2.3.5 Key Strategies
  106.     5.2.4 Philips Healthcare (NL)
  107.       5.2.4.1 Financial Overview
  108.       5.2.4.2 Products Offered
  109.       5.2.4.3 Key Developments
  110.       5.2.4.4 SWOT Analysis
  111.       5.2.4.5 Key Strategies
  112.     5.2.5 Samsung Electronics (KR)
  113.       5.2.5.1 Financial Overview
  114.       5.2.5.2 Products Offered
  115.       5.2.5.3 Key Developments
  116.       5.2.5.4 SWOT Analysis
  117.       5.2.5.5 Key Strategies
  118.     5.2.6 Medtronic plc (IE)
  119.       5.2.6.1 Financial Overview
  120.       5.2.6.2 Products Offered
  121.       5.2.6.3 Key Developments
  122.       5.2.6.4 SWOT Analysis
  123.       5.2.6.5 Key Strategies
  124.     5.2.7 Omron Healthcare (JP)
  125.       5.2.7.1 Financial Overview
  126.       5.2.7.2 Products Offered
  127.       5.2.7.3 Key Developments
  128.       5.2.7.4 SWOT Analysis
  129.       5.2.7.5 Key Strategies
  130.     5.2.8 Withings (FR)
  131.       5.2.8.1 Financial Overview
  132.       5.2.8.2 Products Offered
  133.       5.2.8.3 Key Developments
  134.       5.2.8.4 SWOT Analysis
  135.       5.2.8.5 Key Strategies
  136.     5.2.9 AliveCor Inc (US)
  137.       5.2.9.1 Financial Overview
  138.       5.2.9.2 Products Offered
  139.       5.2.9.3 Key Developments
  140.       5.2.9.4 SWOT Analysis
  141.       5.2.9.5 Key Strategies
  142.   5.3 Appendix
  143.     5.3.1 References
  144.     5.3.2 Related Reports
  145. 6 LIST OF FIGURES
  146.   6.1 MARKET SYNOPSIS
  147.   6.2 APAC MARKET ANALYSIS BY TYPE
  148.   6.3 APAC MARKET ANALYSIS BY TECHNOLOGY
  149.   6.4 APAC MARKET ANALYSIS BY APPLICATION
  150.   6.5 APAC MARKET ANALYSIS BY END USER
  151.   6.6 KEY BUYING CRITERIA OF INDUSTRIAL AUTOMATION & EQUIPMENT
  152.   6.7 RESEARCH PROCESS OF MRFR
  153.   6.8 DRO ANALYSIS OF INDUSTRIAL AUTOMATION & EQUIPMENT
  154.   6.9 DRIVERS IMPACT ANALYSIS: INDUSTRIAL AUTOMATION & EQUIPMENT
  155.   6.10 RESTRAINTS IMPACT ANALYSIS: INDUSTRIAL AUTOMATION & EQUIPMENT
  156.   6.11 SUPPLY / VALUE CHAIN: INDUSTRIAL AUTOMATION & EQUIPMENT
  157.   6.12 INDUSTRIAL AUTOMATION & EQUIPMENT, BY TYPE, 2024 (% SHARE)
  158.   6.13 INDUSTRIAL AUTOMATION & EQUIPMENT, BY TYPE, 2024 TO 2035 (USD Billion)
  159.   6.14 INDUSTRIAL AUTOMATION & EQUIPMENT, BY TECHNOLOGY, 2024 (% SHARE)
  160.   6.15 INDUSTRIAL AUTOMATION & EQUIPMENT, BY TECHNOLOGY, 2024 TO 2035 (USD Billion)
  161.   6.16 INDUSTRIAL AUTOMATION & EQUIPMENT, BY APPLICATION, 2024 (% SHARE)
  162.   6.17 INDUSTRIAL AUTOMATION & EQUIPMENT, BY APPLICATION, 2024 TO 2035 (USD Billion)
  163.   6.18 INDUSTRIAL AUTOMATION & EQUIPMENT, BY END USER, 2024 (% SHARE)
  164.   6.19 INDUSTRIAL AUTOMATION & EQUIPMENT, BY END USER, 2024 TO 2035 (USD Billion)
  165.   6.20 BENCHMARKING OF MAJOR COMPETITORS
  166. 7 LIST OF TABLES
  167.   7.1 LIST OF ASSUMPTIONS
  168.     7.1.1
  169.   7.2 APAC MARKET SIZE ESTIMATES; FORECAST
  170.     7.2.1 BY TYPE, 2025-2035 (USD Billion)
  171.     7.2.2 BY TECHNOLOGY, 2025-2035 (USD Billion)
  172.     7.2.3 BY APPLICATION, 2025-2035 (USD Billion)
  173.     7.2.4 BY END USER, 2025-2035 (USD Billion)
  174.   7.3 PRODUCT LAUNCH/PRODUCT DEVELOPMENT/APPROVAL
  175.     7.3.1
  176.   7.4 ACQUISITION/PARTNERSHIP
  177.     7.4.1

APAC Industrial Automation & Equipment Market Segmentation

Industrial Automation & Equipment By Type (USD Billion, 2025-2035)

  • Fitness Trackers
  • Smartwatches
  • Medical Monitors
  • Wearable ECG Monitors
  • Wearable Blood Pressure Monitors

Industrial Automation & Equipment By Technology (USD Billion, 2025-2035)

  • Biosensors
  • Microcontrollers
  • Flexible display
  • Wireless Communication
  • Power Management

Industrial Automation & Equipment By Application (USD Billion, 2025-2035)

  • Chronic Diseases Management
  • Fitness Wellness
  • Elderly Care
  • Remote Patient Monitoring
  • Health Analytics

Industrial Automation & Equipment By End User (USD Billion, 2025-2035)

  • Hospitals
  • Home Healthcare
  • Ambulatory Surgical Centers
  • Fitness Centers
  • Individual Consumers

Compare Licence

×
Features License Type
Single User Multiuser License Enterprise User
Price $4,950 $5,950 $7,250
Maximum User Access Limit 1 User Upto 10 Users Unrestricted Access Throughout the Organization
Free Customization
Direct Access to Analyst
Deliverable Format
Platform Access
Discount on Next Purchase 10% 15% 15%
Printable Versions