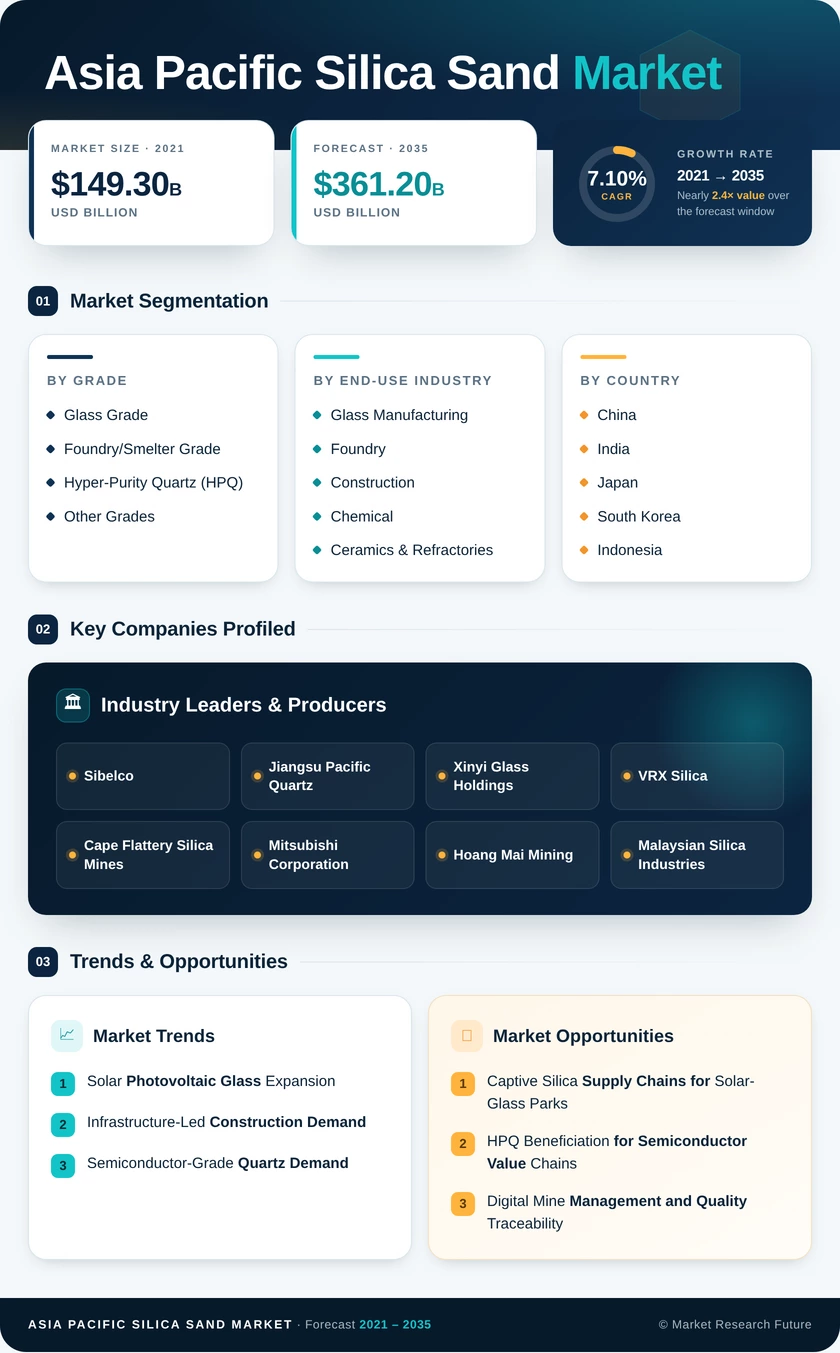
Certified Global Research Member
Isomar fd.webp Wcrc 57.webp
Key Questions Answered
  • Global Market Outlook
  • In-depth analysis of global and regional trends
  • Analyze and identify the major players in the market, their market share, key developments, etc.
  • To understand the capability of the major players based on products offered, financials, and strategies.
  • Identify disrupting products, companies, and trends.
  • To identify opportunities in the market.
  • Analyze the key challenges in the market.
  • Analyze the regional penetration of players, products, and services in the market.
  • Comparison of major players’ financial performance.
  • Evaluate strategies adopted by major players.
  • Recommendations
Why Choose Market Research Future?
  • Vigorous research methodologies for specific market.
  • Knowledge partners across the globe
  • Large network of partner consultants.
  • Ever-increasing/ Escalating data base with quarterly monitoring of various markets
  • Trusted by fortune 500 companies/startups/ universities/organizations
  • Large database of 5000+ markets reports.
  • Effective and prompt pre- and post-sales support.

Asia Pacific Silica Sand Market Research Report Information By Grade (Glass, Foundry, and Chemical), By Process (Wet and Dry), By End-User Industry (Glass Manufacturing, Foundry, Chemical Production, Construction, Paints and Coatings, Ceramics and Refractories, Filtration, Oil and Gas Recovery, and Other End User Industries (Food Processing, Industrial Abrasives and Sports Fields)) – and Asia Pacific Market Forecast Till 2032


ID: MRFR/CnM/11161-HCR | 128 Pages | Author: Anshula Mandaokar| May 2024
Leading companies partner with us for data-driven Insights
client_1 client_2 client_3 client_4 client_5 client_6 client_7 client_8 client_9 client_10
Please fill in Business Email for Quick Response

TABLE OF CONTENTS

1. EXECUTIVE SUMMARY

2. MARKET INTRODUCTION

2.1. Definition

2.2. Scope of the Study

2.2.1. Research Objective

2.2.2. Assumptions

2.2.3. Limitations

3. RESEARCH METHODOLOGY

3.1. Overview

3.2. Data Mining

3.3. Secondary Research

3.4. Primary Research

3.4.1. Primary Interviews and Information Gathering Process

3.4.2. Breakdown of Primary Respondents

3.5. Forecasting Modality

3.6. Market Size Estimation

3.6.1. Bottom-Up Approach

3.6.2. Top-Down Approach

3.7. Data Triangulation

3.8. Validation

4. MARKET DYNAMICS

4.1. Overview

4.2. Drivers

4.3. Restraints

4.4. Opportunities

5. MARKET FACTOR ANALYSIS

5.1. Value Chain Analysis

5.2. Porter’s Five Forces Analysis

5.2.1. Bargaining Power of Suppliers

5.2.2. Bargaining Power of Buyers

5.2.3. Threat of New Entrants

5.2.4. Threat of Substitutes

5.2.5. Intensity of Rivalry

5.3. COVID-19 Impact Analysis

5.3.1. Market Impact Analysis

5.3.2. Regional Impact

5.3.3. Opportunity and Threat Analysis

6. ASIA PACIFIC SILICA SAND MARKET, BY GRADE

6.1. Overview

6.2. Glass

6.3. Foundry

6.4. Chemical

7. ASIA PACIFIC SILICA SAND MARKET, BY PROCESS

7.1. Overview

7.2. Wet

7.3. Dry

8. ASIA PACIFIC SILICA SAND MARKET, BY END-USER INDUSTRY

8.1. Overview

8.2. Glass Manufacturing

8.3. Foundry

8.4. Chemical Production

8.5. Construction

8.6. Paints and Coatings

8.7. Ceramics and Refractories

8.8. Filtration

8.9. Oil and Gas Recovery

8.10. Other End User Industries (Food Processing, Industrial Abrasives and Sports Fields)

9. ASIA PACIFIC SILICA SAND MARKET, BY REGION

9.1. Overview

9.2. Asia-Pacific

- China

- Japan

- India

- Australia

- South Korea

- Indonesia

- Thailand

- Vietnam

- Malaysia

- Singapore

- Rest of Asia-Pacific

10. COMPETITIVE LANDSCAPE

10.1. Overview

10.2. Competitive Analysis

10.3. Market Share Analysis

10.4. Major Growth Strategy in the Asia Pacific SILICA SAND Market,

10.5. Competitive Benchmarking

10.6. Leading Players in Terms of Number of Developments in the Asia Pacific SILICA SAND Market,

10.7. Key developments and Growth Strategies

10.7.1. New Product Launch/Service Deployment

10.7.2. Merger & Acquisitions

10.7.3. Joint Ventures

10.8. Major Players Financial Matrix

10.8.1. Sales & Operating Income, 2022

10.8.2. Major Players R&D Expenditure. 2022

11. COMPANY PROFILES

11.1. Chongqing Changjiang River Moulding Material Group Co. Ltd (CCRMM)

11.1.1. Company Overview

11.1.2. Financial Overview

11.1.3. Products Offered

11.1.4. Key Developments

11.1.5. SWOT Analysis

11.1.6. Key Strategies

11.2. HEBEI SHENGHUO NEW MATERIAL TECHNOLOGY CO., LTD.

11.2.1. Company Overview

11.2.2. Financial Overview

11.2.3. Products Offered

11.2.4. Key Developments

11.2.5. SWOT Analysis

11.2.6. Key Strategies

11.3. JFE MINERAL & ALLOY COMPANY LTD

11.3.1. Company Overview

11.3.2. Financial Overview

11.3.3. Products Offered

11.3.4. Key Developments

11.3.5. SWOT Analysis

11.3.6. Key Strategies

11.4. MANGAL MINERALS

11.4.1. Company Overview

11.4.2. Financial Overview

11.4.3. Products Offered

11.4.4. Key Developments

11.4.5. SWOT Analysis

11.4.6. Key Strategies

11.5. MITSUBISHI CORPORATION

11.5.1. Company Overview

11.5.2. Financial Overview

11.5.3. Products Offered

11.5.4. Key Developments

11.5.5. SWOT Analysis

11.5.6. Key Strategies

11.6. PUM GROUP

11.6.1. Company Overview

11.6.2. Financial Overview

11.6.3. Products Offered

11.6.4. Key Developments

11.6.5. SWOT Analysis

11.6.6. Key Strategies

11.7. Petrazehra Berhad

11.7.1. Company Overview

11.7.2. Financial Overview

11.7.3. Products Offered

11.7.4. Key Developments

11.7.5. SWOT Analysis

11.7.6. Key Strategies

11.8. SIBELCO

11.8.1. Company Overview

11.8.2. Financial Overview

11.8.3. Products Offered

11.8.4. Key Developments

11.8.5. SWOT Analysis

11.8.6. Key Strategies

11.9. TOCHU CORPORATION

11.9.1. Company Overview

11.9.2. Financial Overview

11.9.3. Products Offered

11.9.4. Key Developments

11.9.5. SWOT Analysis

11.9.6. Key Strategies

11.10. TOYOURA KEISEKI KOGYO CO., LTD

11.10.1. Company Overview

11.10.2. Financial Overview

11.10.3. Products Offered

11.10.4. Key Developments

11.10.5. SWOT Analysis

11.10.6. Key Strategies

11.11. VRX Silica Ltd

11.11.1. Company Overview

11.11.2. Financial Overview

11.11.3. Products Offered

11.11.4. Key Developments

11.11.5. SWOT Analysis

11.11.6. Key Strategies

12. APPENDIX

12.1. References

12.2. Related Reports

LIST OF TABLES

TABLE 1 ASIA PACIFIC SILICA SAND MARKET, SYNOPSIS, 2018-2032

TABLE 2 ASIA PACIFIC SILICA SAND MARKET, ESTIMATES & FORECAST, 2018-2032 (USD BILLION)

TABLE 3 ASIA PACIFIC SILICA SAND MARKET, BY GRADE, 2018-2032 (USD BILLION)

TABLE 4 ASIA PACIFIC SILICA SAND MARKET, BY PROCESS , 2018-2032 (USD BILLION)

TABLE 5 ASIA PACIFIC SILICA SAND MARKET, BY END-USER INDUSTRY , 2018-2032 (USD BILLION)

TABLE 6 CHINA SILICA SAND MARKET, BY GRADE, 2018-2032 (USD BILLION)

TABLE 7 CHINA SILICA SAND MARKET, BY PROCESS , 2018-2032 (USD BILLION)

TABLE 8 CHINA SILICA SAND MARKET, BY END-USER INDUSTRY , 2018-2032 (USD BILLION)

TABLE 9 JAPAN SILICA SAND MARKET, BY GRADE, 2018-2032 (USD BILLION)

TABLE 10 JAPAN SILICA SAND MARKET, BY PROCESS , 2018-2032 (USD BILLION)

TABLE 11 JAPAN SILICA SAND MARKET, BY END-USER INDUSTRY , 2018-2032 (USD BILLION)

TABLE 12 INDIA SILICA SAND MARKET, BY GRADE, 2018-2032 (USD BILLION)

TABLE 13 INDIA SILICA SAND MARKET, BY PROCESS , 2018-2032 (USD BILLION)

TABLE 14 INDIA SILICA SAND MARKET, BY END-USER INDUSTRY , 2018-2032 (USD BILLION)

TABLE 15 AUSTRALIA SILICA SAND MARKET, BY GRADE, 2018-2032 (USD BILLION)

TABLE 16 AUSTRALIA SILICA SAND MARKET, BY PROCESS , 2018-2032 (USD BILLION)

TABLE 17 AUSTRALIA SILICA SAND MARKET, BY END-USER INDUSTRY , 2018-2032 (USD BILLION)

TABLE 18 SOUTH KOREA SILICA SAND MARKET, BY GRADE, 2018-2032 (USD BILLION)

TABLE 19 SOUTH KOREA SILICA SAND MARKET, BY PROCESS , 2018-2032 (USD BILLION)

TABLE 20 SOUTH KOREA SILICA SAND MARKET, BY END-USER INDUSTRY , 2018-2032 (USD BILLION)

TABLE 21 INDONESIA SILICA SAND MARKET, BY GRADE, 2018-2032 (USD BILLION)

TABLE 22 INDONESIA SILICA SAND MARKET, BY PROCESS , 2018-2032 (USD BILLION)

TABLE 23 INDONESIA SILICA SAND MARKET, BY END-USER INDUSTRY , 2018-2032 (USD BILLION)

TABLE 24 THAILAND SILICA SAND MARKET, BY GRADE, 2018-2032 (USD BILLION)

TABLE 25 THAILAND SILICA SAND MARKET, BY PROCESS , 2018-2032 (USD BILLION)

TABLE 26 THAILAND SILICA SAND MARKET, BY END-USER INDUSTRY , 2018-2032 (USD BILLION)

TABLE 27 VIETNAM SILICA SAND MARKET, BY GRADE, 2018-2032 (USD BILLION)

TABLE 28 VIETNAM SILICA SAND MARKET, BY PROCESS , 2018-2032 (USD BILLION)

TABLE 29 VIETNAM SILICA SAND MARKET, BY END-USER INDUSTRY , 2018-2032 (USD BILLION)

TABLE 30 MALAYSIA SILICA SAND MARKET, BY GRADE, 2018-2032 (USD BILLION)

TABLE 31 MALAYSIA SILICA SAND MARKET, BY PROCESS , 2018-2032 (USD BILLION)

TABLE 32 MALAYSIA SILICA SAND MARKET, BY END-USER INDUSTRY , 2018-2032 (USD BILLION)

TABLE 33 SINGAPORE SILICA SAND MARKET, BY GRADE, 2018-2032 (USD BILLION)

TABLE 34 SINGAPORE SILICA SAND MARKET, BY PROCESS , 2018-2032 (USD BILLION)

TABLE 35 SINGAPORE SILICA SAND MARKET, BY END-USER INDUSTRY , 2018-2032 (USD BILLION)

TABLE 36 REST OF ASIA PACIFIC SILICA SAND MARKET, BY GRADE, 2018-2032 (USD BILLION)

TABLE 37 REST OF ASIA PACIFIC SILICA SAND MARKET, BY PROCESS , 2018-2032 (USD BILLION)

TABLE 38 REST OF ASIA PACIFIC SILICA SAND MARKET, BY END-USER INDUSTRY , 2018-2032 (USD BILLION)

LIST OF FIGURES

FIGURE 1 RESEARCH PROCESS

FIGURE 2 MARKET STRUCTURE FOR THE ASIA PACIFIC SILICA SAND MARKET

FIGURE 3 MARKET DYNAMICS FOR THE ASIA PACIFIC SILICA SAND MARKET

FIGURE 4 ASIA PACIFIC SILICA SAND MARKET, SHARE (%), BY GRADE, 2022

FIGURE 5 ASIA PACIFIC SILICA SAND MARKET, SHARE (%), BY PROCESS , 2022

FIGURE 6 ASIA PACIFIC SILICA SAND MARKET, SHARE (%), BY END-USER INDUSTRY , 2022

FIGURE 7 ASIA PACIFIC SILICA SAND MARKET, SHARE (%), BY REGION, 2022

FIGURE 8 ASIA PACIFIC SILICA SAND MARKET: COMPANY SHARE ANALYSIS, 2022 (%)

FIGURE 9 CHONGQING CHANGJIANG RIVER MOULDING MATERIAL GROUP CO. LTD (CCRMM): FINANCIAL OVERVIEW SNAPSHOT

FIGURE 10 CHONGQING CHANGJIANG RIVER MOULDING MATERIAL GROUP CO. LTD (CCRMM): SWOT ANALYSIS

FIGURE 11 HEBEI SHENGHUO NEW MATERIAL TECHNOLOGY CO., LTD.: FINANCIAL OVERVIEW SNAPSHOT

FIGURE 12 HEBEI SHENGHUO NEW MATERIAL TECHNOLOGY CO., LTD.: SWOT ANALYSIS

FIGURE 13 JFE MINERAL & ALLOY COMPANY LTD: FINANCIAL OVERVIEW SNAPSHOT

FIGURE 14 JFE MINERAL & ALLOY COMPANY LTD: SWOT ANALYSIS

FIGURE 15 MANGAL MINERALS: FINANCIAL OVERVIEW SNAPSHOT

FIGURE 16 MANGAL MINERALS: SWOT ANALYSIS

FIGURE 17 MITSUBISHI CORPORATION: FINANCIAL OVERVIEW SNAPSHOT

FIGURE 18 MITSUBISHI CORPORATION: SWOT ANALYSIS

FIGURE 19 PUM GROUP: FINANCIAL OVERVIEW SNAPSHOT

FIGURE 20 PUM GROUP: SWOT ANALYSIS

FIGURE 21 PETRAZEHRA BERHAD: FINANCIAL OVERVIEW SNAPSHOT

FIGURE 22 PETRAZEHRA BERHAD: SWOT ANALYSIS

FIGURE 23 SIBELCO: FINANCIAL OVERVIEW SNAPSHOT

FIGURE 24 SIBELCO: SWOT ANALYSIS

FIGURE 25 TOCHU CORPORATION: FINANCIAL OVERVIEW SNAPSHOT

FIGURE 26 TOCHU CORPORATION: SWOT ANALYSIS

FIGURE 27 TOYOURA KEISEKI KOGYO CO., LTD: FINANCIAL OVERVIEW SNAPSHOT

FIGURE 28 TOYOURA KEISEKI KOGYO CO., LTD: SWOT ANALYSIS

FIGURE 29 VRX SILICA LTD: FINANCIAL OVERVIEW SNAPSHOT

FIGURE 30 VRX SILICA LTD: SWOT ANALYSIS

Purchase Option
Single User $ 4,950
Multiuser License $ 5,950
Enterprise User $ 7,250
Compare Licenses
Tailored for You
  • Dedicated Research on any specifics segment or region.
  • Focused Research on specific players in the market.
  • Custom Report based only on your requirements.
  • Flexibility to add or subtract any chapter in the study.
  • Historic data from 2014 and forecasts outlook till 2040.
  • Flexibility of providing data/insights in formats (PDF, PPT, Excel).
  • Provide cross segmentation in applicable scenario/markets.