• Cat-intel
  • MedIntelliX
  • Resources
  • About Us
  • Hero Background
    English
    Chinese
    French
    Japanese
    Korean
    German
    Spanish

    Asia Pacific Graphene Market Size

    ID: MRFR/CnM/12432-HCR
    128 Pages
    Anshula Mandaokar
    October 2025

    Asia Pacific Graphene Market Research Repor Information By Type (Monolayer and Bilayer, Graphene Nano-platelets, Graphene Oxide, and Others), By Application (Composites, Functional Inks, Paints & Coatings, Energy Storage, Electronics, Polymer Additives, RFID, and Others) – and Asia Pacific Market Forecast Till 2035

    Share:
    Download PDF ×

    We do not share your information with anyone. However, we may send you emails based on your report interest from time to time. You may contact us at any time to opt-out.

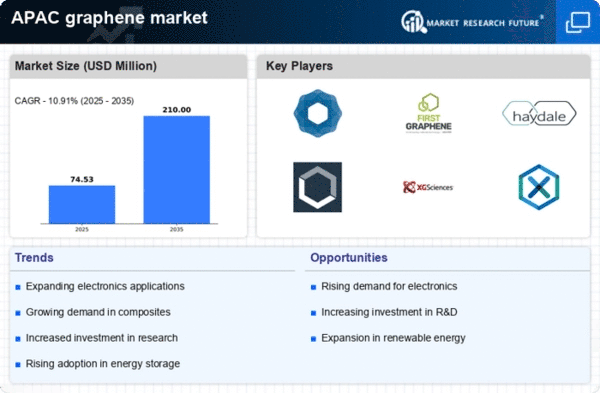
    Asia Pacific Graphene Market Infographic
    $ 4,950.0
    $ 5,950.0
    $ 7,250.0

    Asia Pacific Graphene Size

    Asia Pacific Graphene Market Growth Projections and Opportunities

    The Asia Pacific Graphene Market is shaped by a multitude of market factors contributing to its growth and development. A significant driver is the region's emphasis on technological innovation and research and development. Asia Pacific countries, particularly China and South Korea, have been at the forefront of graphene research, exploring its potential applications in various industries. As a result, the region has become a key player in the global graphene market, with continuous efforts to harness the unique properties of graphene for advancements in electronics, energy storage, and materials science.

    Government initiatives and funding play a crucial role in propelling the Asia Pacific Graphene Market forward. Governments across the region have recognized the strategic importance of graphene in driving innovation and economic development. Funding programs and initiatives supporting graphene research and commercialization have been implemented to accelerate the translation of research findings into practical applications. The collaboration between governments, research institutions, and industry stakeholders fosters an environment conducive to the growth of the graphene market in Asia Pacific.

    The electronics and semiconductor industries are pivotal drivers for the adoption of graphene in the Asia Pacific region. Graphene's exceptional electrical conductivity and thermal properties make it an attractive material for applications in electronics, such as transistors, sensors, and flexible displays. The continuous demand for smaller, faster, and more efficient electronic devices in Asia Pacific countries drives the exploration and integration of graphene-based solutions, positioning the region as a major contributor to the global graphene market in the electronics sector.

    Market factors related to energy storage technologies significantly influence the Asia Pacific Graphene Market. With the increasing focus on renewable energy sources and the development of energy storage solutions, graphene's use in batteries and supercapacitors gains prominence. The superior conductivity and high surface area of graphene contribute to enhanced energy storage capacity and faster charging times. As Asia Pacific nations actively invest in clean energy technologies, the demand for graphene in energy storage applications is expected to grow, shaping the dynamics of the regional graphene market.

    Environmental considerations and sustainability also play a role in influencing the Asia Pacific Graphene Market. The material's potential applications in water purification, environmental monitoring, and eco-friendly technologies align with the region's commitment to sustainable development. Researchers and industries in Asia Pacific explore graphene's role in addressing environmental challenges, contributing to a more sustainable and environmentally conscious market.

    Market competition and industry collaborations are notable factors in the Asia Pacific Graphene Market. The region features a mix of established companies and startups, fostering a competitive landscape. Collaborations and partnerships between graphene producers, research institutions, and end-users facilitate the development of practical applications and enhance the commercialization prospects of graphene-based products. The collaborative efforts contribute to the overall growth and maturity of the graphene market in Asia Pacific.

    The impact of global economic conditions and trade dynamics is evident in the Asia Pacific Graphene Market. As a globally traded commodity, market participants in the region closely monitor international developments, trade agreements, and geopolitical factors that may impact the supply chain and market conditions for graphene. Economic stability and trade policies play a role in determining the accessibility of graphene materials and their cost in the Asia Pacific market.

    Challenges related to standardization, large-scale production, and cost-effectiveness are factors that the graphene industry in Asia Pacific addresses. While graphene exhibits exceptional properties at the nanoscale, achieving scalable and cost-effective production methods is an ongoing challenge. The development of standardized processes and the integration of graphene into commercial products at an economically viable scale are crucial for the widespread adoption of graphene in various industries in the Asia Pacific region.
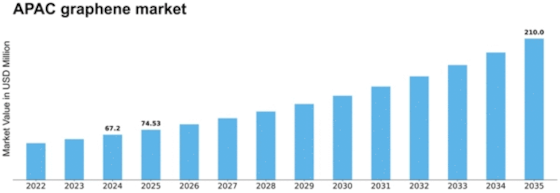
    Asia Pacific Graphene Market Size Graph

    Market Summary

    The Asia-Pacific Graphene market is projected to experience substantial growth from 0.88 USD Billion in 2024 to 34.46 USD Billion by 2035.

    Key Market Trends & Highlights

    Asia Pacific Graphene Key Trends and Highlights

    • The market is expected to grow at a remarkable CAGR of 36.57% from 2025 to 2035.
    • By 2035, the Asia-Pacific Graphene market is anticipated to reach a valuation of 24.7 USD Billion.
    • In 2024, the market valuation stands at 0.8 USD Billion, indicating a strong growth trajectory.
    • Growing adoption of advanced materials due to increasing demand for lightweight and high-strength products is a major market driver.

    Market Size & Forecast

    2024 Market Size 0.88 (USD Billion)
    2035 Market Size 34.46 (USD Billion)
    CAGR (2025-2035) 39.58%
    Largest Regional Market Share in 2024 latin_america)

    Major Players

    XG Sciences, The Sixth Element Materials Technology Co., Ltd, Directa Plus S.p.A, Global Graphene Group, AVANZARE INNOVACION TECNOLOGICA SL, Graphenea, Inc., Morsh, Thomas Swan & Co. Ltd., Perpetuus Advanced Materials PLC

    Market Trends

    Increasing Product Adoption in the Electronics Sector to Accelerate Market Growth

    Electronics applications are best suited for it because of its extraordinarily high electrical and thermal conductivity and lightweight design. Compared to semiconductors, such as silicon, which are widely used in electronic devices, the electrons in this allotrope of carbon have greater mobility and, consequently, speed when applied electric field. These attributes enable it to create more efficient gadgets that use less power and operate more quickly than conventional alternatives. Furthermore, it can withstand relatively higher voltages because of this material's great mechanical durability. Because more industries are embracing electrification, this is probably going to have an impact on growth.

    Moreover, the strong demand from nations like China, Japan, and India has caused the Asia-Pacific electronic sector to expand quickly in recent years. Because of its liberal policies and low labor costs, China is a strong and attractive market for electronics manufacturers. The production of the worldwide electronics and IT sector was estimated by the Japan Electronics and Information Technology Industries Association (JEITA) to be worth USD 3,436.8 billion in 2022, representing a 1% annual rise from USD 3,360.2 billion in 2021.

    Furthermore, it is anticipated that the industry will increase by 3% annually this year to reach USD 3,436.8 billion. Thus, the aforementioned considerations indicate that there will be a rise in the market for electronic goods during the forecast period, which would in turn drive up demand for graphene.

    The main factor driving the graphene market and propelling growth is the expanding application of graphene in the construction sector. Green building materials that are both affordable and highly effective are essential for the construction sector, which plays a major role in the world economy. About 8% of the world's CO2 emissions are caused by cement, a crucial component of concrete. In order to solve this, new mortar and concrete composites that use less cement and are more durable are required. Through structural alterations and functionalization, the intriguing material graphene improves the characteristics of concrete.

    It is appropriate for a variety of uses in the construction industry due to its exceptional strength attributes, which include high tensile strength and Young's modulus. The addition of graphene to cement increases its strength and makes it possible to produce ecologically friendly, self-cleaning concrete. The worldwide graphene market is expanding as a result of graphene's many advantages being adopted by the building and construction industries around the world. Thus, driving the graphene market revenue.

    Asia Pacific Graphene Market Market Drivers

    Market Segment Insights

    Graphene Type Insights

    The Asia Pacific Graphene market segmentation, based on type includes Monolayer and Bilayer, Graphene Nano-platelets, Graphene Oxide, and Others. The graphene nano-platelets category led the market in 2022 because the energy storage and generation, medical aerospace, and telecommunications industries all have enormous need for it. Additionally essential to the operation of flexible electronics, tablets, optoelectronic gadgets, medical equipment, and other supercapacitors are transparent conductive films made of graphene oxide. Superior product attributes like power, flexibility, electrical conductivity, high heat and permeability, and so on elevate demand greatly.

    Figure 1: Asia Pacific Graphene Market, by Type, 2022 & 2032 (USD Billion)Source: Secondary Research, Primary Research, Market Research Future Database and Analyst Review

    Graphene Application Insights

    The Asia Pacific Graphene market segmentation, based on application, includes Composites, Functional Inks, Paints & Coatings, Energy Storage, Electronics, Polymer Additives, RFID, and Others. The composites category generated the most income. These are used in the manufacturing, aerospace, and automotive sectors, among other industries. By adding a little amount of graphene to materials like plastics, metals, and ceramics, producers may produce robust, lightweight materials with excellent electrical conductivity and heat resistance. The material is also used in the synthesis and storage of energy.

    Graphene Country Insights

    The major portion of the graphene market is accounted for by the Asia-Pacific region. Graphene oxide is expected to expand at a high rate due to the region's rapid industrialization and growing number of graphene-based application patents. China is home to one of the biggest electronics manufacturing bases. It presents a fierce rivalry to the current upstream manufacturers, including Taiwan, South Korea, and Singapore. When it comes to demand, consumer electronics products like tablets, OLED TVs, and smartphones are growing at the fastest rates possible. Moreover, lighter and more impact-resistant helicopter and airplane structures are made with graphene.

    Graphene can be used to create deicing systems for wings. Owing to its mechanical resistance, thermal and electrical conductivity, and simple functionalization, graphene finds use in a variety of defense applications, such as optoelectronic devices, ballistic protection materials, military helmets, lightweight armor, flexible systems, camouflage, and signature management.

    Source: Secondary Research, Primary Research, Market Research Future Database and Analyst Review

    Get more detailed insights about Asia Pacific Graphene Market Research Report - Forecast by 2032

    Regional Insights

    Key Players and Competitive Insights

    Leading market players are investing heavily in research and development in order to expand their product lines, which will help the graphene market, grow even more. Market participants are also undertaking a variety of strategic activities to expand their footprint, with important market developments including new product launches, contractual agreements, mergers and acquisitions, higher investments, and collaboration with other organizations. To expand and survive in a more competitive and rising market climate, graphene industry must offer cost-effective items.

    Major players in the graphene market are attempting to increase market demand by investing in research and development operations includes XG Sciences; The Sixth Element Materials Technology Co., Ltd; Directa Plus S.p.A; Global Graphene Group; AVANZARE INNOVACION TECNOLOGICA SL; Graphenea, Inc.; Morsh; Thomas Swan & Co. Ltd.; and Perpetuus Advanced Materials PLC.

    Key Companies in the Asia Pacific Graphene Market market include

    Industry Developments

    November 2021: Graphite (GNP) materials were first produced by NeoGraf Solutions under the Graf-X trademark. Approximately 750 metric tonnes of GNP material can be produced by the company each year. Approximately 1,300 tonnes of graphite precursors (GP) are produced by the company with the goal of effectively transforming graphite materials.

    July 2021: AGM unveiled a cutting-edge new line of environmentally sustainable GNP dispersions. Customers of paints, graphene, and composite materials will be able to develop the sustainability of their varied product compositions with the help of these dispersions.

    Market Segmentation

    Graphene Type Outlook

    • Monolayer and Bilayer
    • Graphene Nano-platelets
    • Graphene Oxide
    • Others

    Graphene Regional Outlook

    • China
    • Japan
    • India
    • Australia
    • South Korea
    • Indonesia
    • Thailand
    • Vietnam
    • Malaysia
    • Singapore
    • Rest of Asia-Pacific

    Graphene Application Outlook

    • Composites
    • Functional Inks
    • Paints & Coatings
    • Energy Storage
    • Electronics
    • Polymer Additives
    • RFID
    • Others

    Report Scope

    Report Attribute/Metric Details
    Market Size 2035 34.46 (Value (USD Billion))
    Compound Annual Growth Rate (CAGR) 39.58% (2025 - 2035)
    Base Year 2024
    Market Forecast Period 2025 - 2035
    Historical Data 2018- 2022
    Market Forecast Units Value (USD Billion)
    Report Coverage Revenue Forecast, Market Competitive Landscape, Growth Factors, and Trends
    Segments Covered Type, Application, and Region
    Region Covered Asia Pacific
    Countries Covered China, Japan, India, Australia, South Korea, Indonesia, Thailand, Vietnam, Malaysia, Singapore, and Rest of Asia-Pacific
    Key Companies Profiled XG Sciences; The Sixth Element Materials Technology Co., Ltd; Directa Plus S.p.A; Global Graphene Group; AVANZARE INNOVACION TECNOLOGICA SL; Graphenea, Inc.; Morsh; Thomas Swan & Co. Ltd.; and Perpetuus Advanced Materials PLC
    Key Market Opportunities Expanding product adoption and rising demand from the transportation and automotive end-use industries
    Key Market Dynamics Growing need for graphene across a range of industries, including composites, energy, and conductive films and inks Increasing application of graphene in the construction sector
    Market Size 2024 0.88 (Value (USD Billion))
    Market Size 2025 1.23 (Value (USD Billion))

    Market Highlights

    Author

    Anshula Mandaokar
    Team Lead - Research

    She holds an experience of about 6+ years in market research and business consulting, working under the spectrum of information communication technology, telecommunications and semiconductor domains. aarti conceptualizes and implements a scalable business strategy and provides strategic leadership to the clients. her expertise lies in market estimation, competitive intelligence, pipeline analysis, customer assessment, etc.

    Leave a Comment

    Latest Comments

    John Doe
    john@example.com

    This is a great article! Really helped me understand the topic better.

    Posted on July 23, 2025, 10:15 AM
    Jane Smith
    jane@domain.com

    Thanks for sharing this. I’ve bookmarked it for later reference.

    Posted on July 22, 2025, 7:45 PM

    FAQs

    How much is the graphene market?

    The Asia Pacific graphene market size was valued at USD 0.4 Billion in 2022.

    What is the growth rate of the graphene market?

    Europe Graphene Market is expected to grow with a CAGR of 31.5% in the period 2025-2035

    Who are the key players in the graphene market?

    The key players in the market are XG Sciences; The Sixth Element Materials Technology Co., Ltd; Directa Plus S.p.A; Global Graphene Group; AVANZARE INNOVACION TECNOLOGICA SL; Graphenea, Inc.; Morsh; Thomas Swan & Co. Ltd.; and Perpetuus Advanced Materials PLC.

    Which type led the graphene market?

    The graphene nano-platelets category dominated the market in 2022.

    Which application had the largest market share in the graphene market?

    The composites category had the largest share in the market.

    1. MARKET DYNAMICS
      1. \r\n4.1. Overview
      2. \r\n4.2. Drivers
      3. \r\n4.3. Restraints
      4. \r\n4.4.
      5. Opportunities
      6. \r\n5. MARKET FACTOR ANALYSIS
      7. \r\n5.1. Value Chain Analysis
      8. \r\n5.2.
      9. Porter’s Five Forces Analysis
      10. \r\n5.2.1. Bargaining Power of Suppliers
      11. \r\n5.2.2.
      12. Bargaining Power of Buyers
      13. \r\n5.2.3. Threat of New Entrants
      14. \r\n5.2.4.
      15. Threat of Substitutes
      16. \r\n5.2.5. Intensity of Rivalry
      17. \r\n5.3. COVID-19
      18. Impact Analysis
      19. \r\n5.3.1. Market Impact Analysis
      20. \r\n5.3.2. Regional
      21. Impact
      22. \r\n5.3.3. Opportunity and Threat Analysis
      23. \r\n6. ASIA PACIFIC
    2. GRAPHENE MARKET, BY TYPE
      1. \r\n6.1. Overview
      2. \r\n6.2. Monolayer and Bilayer
      3. \r\n6.3.
      4. Graphene Nano-platelets
      5. \r\n6.4. Graphene Oxide
      6. \r\n6.5. Others
      7. \r\n7.
    3. ASIA PACIFIC GRAPHENE MARKET, BY APPLICATION
      1. \r\n7.1. Overview
      2. \r\n7.2.
      3. Composites
      4. \r\n7.3. Functional Inks
      5. \r\n7.4. Paints & Graphene
      6. \r\n7.5.
      7. Energy Storage
      8. \r\n7.6. Electronics
      9. \r\n7.7. Polymer Additives
      10. \r\n7.8.
      11. RFID
      12. \r\n7.9. Others
    4. \r\n8. ASIA PACIFIC GRAPHENE MARKET, BY REGION
      1. \r\n8.1.
      2. Overview
      3. \r\n8.2. Asia-Pacific
      4. \r\n8.2.1. China
      5. \r\n8.2.2. Japan
      6. \r\n8.2.3.
      7. India
      8. \r\n8.2.4. Australia
      9. \r\n8.2.5. South Korea
      10. \r\n8.2.6. Indonesia
      11. \r\n8.2.7.
      12. Thailand
      13. \r\n8.2.8. Vietnam
      14. \r\n8.2.9. Malaysia
      15. \r\n8.2.10. Singapore
      16. \r\n8.2.11.
      17. Rest of Asia-Pacific
      18. \r\n9. COMPETITIVE LANDSCAPE
      19. \r\n9.1. Overview
      20. \r\n9.2.
      21. Competitive Analysis
      22. \r\n9.3. Market Share Analysis
      23. \r\n9.4. Major Growth
      24. Strategy in the Asia Pacific Graphene Market,
      25. \r\n9.5. Competitive Benchmarking
      26. \r\n9.6.
      27. Leading Players in Terms of Number of Developments in the Asia Pacific Graphene
      28. Market,
      29. \r\n9.7. Key developments and Growth Strategies
      30. \r\n9.7.1. New
      31. Product Launch/Service Deployment
      32. \r\n9.7.2. Merger & Acquisitions
      33. \r\n9.7.3.
      34. Joint Ventures
      35. \r\n9.8. Major Players Financial Matrix
      36. \r\n9.8.1. Sales
      37. & Operating Income, 2022
      38. \r\n9.8.2. Major Players R&D Expenditure.
      39. \r\n10. COMPANY PROFILES
      40. \r\n10.1. XG SCIENCES
      41. \r\n10.1.1.
      42. Company Overview
      43. \r\n10.1.2. Financial Overview
      44. \r\n10.1.3. Products
      45. Offered
      46. \r\n10.1.4. Key Developments
      47. \r\n10.1.5. SWOT Analysis
      48. \r\n10.1.6.
      49. Key Strategies
      50. \r\n10.2. The Sixth Element Materials Technology Co. Ltd
      51. \r\n10.2.1.
      52. Company Overview
      53. \r\n10.2.2. Financial Overview
      54. \r\n10.2.3. Products
      55. Offered
      56. \r\n10.2.4. Key Developments
      57. \r\n10.2.5. SWOT Analysis
      58. \r\n10.2.6.
      59. Key Strategies
      60. \r\n10.3. Directa Plus S.p.A
      61. \r\n10.3.1. Company Overview
      62. \r\n10.3.2.
      63. Financial Overview
      64. \r\n10.3.3. Products Offered
      65. \r\n10.3.4. Key Developments
      66. \r\n10.3.5.
      67. SWOT Analysis
      68. \r\n10.3.6. Key Strategies
      69. \r\n10.4. Global Graphene Group
      70. \r\n10.4.1.
      71. Company Overview
      72. \r\n10.4.2. Financial Overview
      73. \r\n10.4.3. Products
      74. Offered
      75. \r\n10.4.4. Key Developments
      76. \r\n10.4.5. SWOT Analysis
      77. \r\n10.4.6.
      78. Key Strategies
      79. \r\n10.5. AVANZARE INNOVACION TECNOLOGICA SL
      80. \r\n10.5.1.
      81. Company Overview
      82. \r\n10.5.2. Financial Overview
      83. \r\n10.5.3. Products
      84. Offered
      85. \r\n10.5.4. Key Developments
      86. \r\n10.5.5. SWOT Analysis
      87. \r\n10.5.6.
      88. Key Strategies
      89. \r\n10.6. Graphenea, Inc.
      90. \r\n10.6.1. Company Overview
      91. \r\n10.6.2.
      92. Financial Overview
      93. \r\n10.6.3. Products Offered
      94. \r\n10.6.4. Key Developments
      95. \r\n10.6.5.
      96. SWOT Analysis
      97. \r\n10.6.6. Key Strategies
      98. \r\n10.7. MORSH
      99. \r\n10.7.1.
      100. Company Overview
      101. \r\n10.7.2. Financial Overview
      102. \r\n10.7.3. Products
      103. Offered
      104. \r\n10.7.4. Key Developments
      105. \r\n10.7.5. SWOT Analysis
      106. \r\n10.7.6.
      107. Key Strategies
      108. \r\n10.8. THOMAS SWAN & CO. LTD
      109. \r\n10.8.1. Company
      110. Overview
      111. \r\n10.8.2. Financial Overview
      112. \r\n10.8.3. Products Offered
      113. \r\n10.8.4.
      114. Key Developments
      115. \r\n10.8.5. SWOT Analysis
      116. \r\n10.8.6. Key Strategies
      117. \r\n10.9.
      118. Perpetuus Advanced Materials PLC
      119. \r\n10.9.1. Company Overview
      120. \r\n10.9.2.
      121. Financial Overview
      122. \r\n10.9.3. Products Offered
      123. \r\n10.9.4. Key Developments
      124. \r\n10.9.5.
      125. SWOT Analysis
      126. \r\n10.9.6. Key Strategies
      127. \r\n11. APPENDIX
      128. \r\n11.1.
      129. References
      130. \r\n11.2. Related Reports
      131. \r\n 
      132. \r\nLIST OF TABLES
      133. \r\nTABLE
    5. ASIA PACIFIC GRAPHENE MARKET, SYNOPSIS, 2018–2032
      1. \r\nTABLE 2 ASIA
      2. PACIFIC GRAPHENE MARKET, ESTIMATES & FORECAST, 2018–2032 (USD BILLION)
      3. \r\nTABLE
    6. ASIA PACIFIC GRAPHENE MARKET, BY TYPE, 2018–2032 (USD BILLION)
      1. \r\nTABLE
    7. ASIA PACIFIC GRAPHENE MARKET, BY APPLICATION, 2018–2032 (USD BILLION)
      1. \r\nTABLE
    8. CHINA: GRAPHENE MARKET, BY TYPE, 2018–2032 (USD BILLION)
      1. \r\nTABLE
    9. CHINA GRAPHENE MARKET, BY APPLICATION, 2018–2032 (USD BILLION)
      1. \r\nTABLE
    10. JAPAN: GRAPHENE MARKET, BY TYPE, 2018–2032 (USD BILLION)
      1. \r\nTABLE
    11. JAPAN GRAPHENE MARKET, BY APPLICATION, 2018–2032 (USD BILLION)
      1. \r\nTABLE
    12. INDIA: GRAPHENE MARKET, BY TYPE, 2018–2032 (USD BILLION)
      1. \r\nTABLE
    13. INDIA GRAPHENE MARKET, BY APPLICATION, 2018–2032 (USD BILLION)
      1. \r\nTABLE
    14. AUSTRALIA: GRAPHENE MARKET, BY TYPE, 2018–2032 (USD BILLION)
      1. \r\nTABLE
    15. AUSTRALIA GRAPHENE MARKET, BY APPLICATION, 2018–2032 (USD BILLION)
      1. \r\nTABLE
    16. SOUTH KOREA: GRAPHENE MARKET, BY TYPE, 2018–2032 (USD BILLION)
      1. \r\nTABLE
    17. SOUTH KOREA GRAPHENE MARKET, BY APPLICATION, 2018–2032 (USD BILLION)
      1. \r\nTABLE
    18. INDONESIA: GRAPHENE MARKET, BY TYPE, 2018–2032 (USD BILLION)
      1. \r\nTABLE
    19. INDONESIA GRAPHENE MARKET, BY APPLICATION, 2018–2032 (USD BILLION)
      1. \r\nTABLE
    20. THAILAND: GRAPHENE MARKET, BY TYPE, 2018–2032 (USD BILLION)
      1. \r\nTABLE
    21. THAILAND GRAPHENE MARKET, BY APPLICATION, 2018–2032 (USD BILLION)
      1. \r\nTABLE
    22. VIETNAM: GRAPHENE MARKET, BY TYPE, 2018–2032 (USD BILLION)
      1. \r\nTABLE
    23. VIETNAM GRAPHENE MARKET, BY APPLICATION, 2018–2032 (USD BILLION)
      1. \r\nTABLE
    24. MALAYSIA: GRAPHENE MARKET, BY TYPE, 2018–2032 (USD BILLION)
      1. \r\nTABLE
    25. MALAYSIA GRAPHENE MARKET, BY APPLICATION, 2018–2032 (USD BILLION)
      1. \r\nTABLE
    26. SINGAPORE: GRAPHENE MARKET, BY TYPE, 2018–2032 (USD BILLION)
      1. \r\nTABLE
    27. SINGAPORE GRAPHENE MARKET, BY APPLICATION, 2018–2032 (USD BILLION)
      1. \r\nTABLE
    28. REST OF ASIA-PACIFIC: GRAPHENE MARKET, BY TYPE, 2018–2032 (USD BILLION)
      1. \r\nTABLE
    29. REST OF ASIA-PACIFIC GRAPHENE MARKET, BY APPLICATION, 2018–2032 (USD BILLION)
      1. \r\nLIST
    30. OF FIGURES
      1. \r\nFIGURE 1 RESEARCH PROCESS
      2. \r\nFIGURE 2 MARKET STRUCTURE
    31. FOR THE ASIA PACIFIC GRAPHENE MARKET
      1. \r\nFIGURE 3 MARKET DYNAMICS FOR THE
    32. ASIA PACIFIC GRAPHENE MARKET
      1. \r\nFIGURE 4 ASIA PACIFIC GRAPHENE MARKET, SHARE
      2. (%), BY TYPE, 2021
      3. \r\nFIGURE 5 ASIA PACIFIC GRAPHENE MARKET, SHARE (%), BY
      4. APPLICATION, 2021
      5. \r\nFIGURE 6 ASIA PACIFIC GRAPHENE MARKET, SHARE (%), BY
      6. REGION, 2021
      7. \r\nFIGURE 7 XG SCIENCES: FINANCIAL OVERVIEW SNAPSHOT
      8. \r\nFIGURE
    33. XG SCIENCES: SWOT ANALYSIS
      1. \r\nFIGURE 9 THE SIXTH ELEMENT MATERIALS TECHNOLOGY
      2. CO. LTD: FINANCIAL OVERVIEW SNAPSHOT
      3. \r\nFIGURE 10 THE SIXTH ELEMENT MATERIALS
      4. TECHNOLOGY CO. LTD: SWOT ANALYSIS
      5. \r\nFIGURE 11 DIRECTA PLUS S.P.A: FINANCIAL
      6. OVERVIEW SNAPSHOT
      7. \r\nFIGURE 12 DIRECTA PLUS S.P.A: SWOT ANALYSIS
      8. \r\nFIGURE
    34. GLOBAL GRAPHENE GROUP: FINANCIAL OVERVIEW SNAPSHOT
      1. \r\nFIGURE 14 GLOBAL
      2. GRAPHENE GROUP: SWOT ANALYSIS
      3. \r\nFIGURE 15 AVANZARE INNOVACION TECNOLOGICA
      4. SL: FINANCIAL OVERVIEW SNAPSHOT
      5. \r\nFIGURE 16 AVANZARE INNOVACION TECNOLOGICA
      6. SL: SWOT ANALYSIS
      7. \r\nFIGURE 17 GRAPHENEA, INC.: FINANCIAL OVERVIEW SNAPSHOT
      8. \r\nFIGURE
    35. GRAPHENEA, INC.: SWOT ANALYSIS
      1. \r\nFIGURE 19 MORSH: FINANCIAL OVERVIEW
      2. SNAPSHOT
      3. \r\nFIGURE 20 MORSH: SWOT ANALYSIS
      4. \r\nFIGURE 21 THOMAS SWAN
      5. & CO. LTD: FINANCIAL OVERVIEW SNAPSHOT
      6. \r\nFIGURE 22 THOMAS SWAN &
      7. CO. LTD: SWOT ANALYSIS
      8. \r\nFIGURE 23 PERPETUUS ADVANCED MATERIALS PLC: FINANCIAL
      9. OVERVIEW SNAPSHOT
      10. \r\nFIGURE 24 PERPETUUS ADVANCED MATERIALS PLC: SWOT ANALYSIS

    Asia Pacific Graphene Market Segmentation

    Market Segmentation Overview

    • Detailed segmentation data will be available in the full report
    • Comprehensive analysis by multiple parameters
    • Regional and country-level breakdowns
    • Market size forecasts by segment
    Infographic

    Free Sample Request

    Kindly complete the form below to receive a free sample of this Report

    Get Free Sample

    Customer Strories

    “I am very pleased with how market segments have been defined in a relevant way for my purposes (such as "Portable Freezers & refrigerators" and "last-mile"). In general the report is well structured. Thanks very much for your efforts.”

    Victoria Milne

    Founder
    Case Study
    Chemicals and Materials