info@marketresearchfuture.com   📞 +1 (855) 661-4441(US)   📞 +44 1720 412 167(UK)   📞 +91 2269738890(APAC)
Certified Global Research Member
Isomar 1 Iso 1
Key Questions Answered
  • Global Market Outlook
  • In-depth analysis of global and regional trends
  • Analyze and identify the major players in the market, their market share, key developments, etc.
  • To understand the capability of the major players based on products offered, financials, and strategies.
  • Identify disrupting products, companies, and trends.
  • To identify opportunities in the market.
  • Analyze the key challenges in the market.
  • Analyze the regional penetration of players, products, and services in the market.
  • Comparison of major players financial performance.
  • Evaluate strategies adopted by major players.
  • Recommendations
Why Choose Market Research Future?
  • Vigorous research methodologies for specific market.
  • Knowledge partners across the globe
  • Large network of partner consultants.
  • Ever-increasing/ Escalating data base with quarterly monitoring of various markets
  • Trusted by fortune 500 companies/startups/ universities/organizations
  • Large database of 5000+ markets reports.
  • Effective and prompt pre- and post-sales support.

Graphene Market Research Report By Application (Electronics, Energy Storage, Composites, Coatings, Biomedicine), By Type (Graphene Oxide, Reduced Graphene Oxide, Graphene Nanoplatelets, Monolayer Graphene), By End Use Industry (Consumer Electronics, Automotive, Aerospace, Healthcare, Construction), By Form (Powder, Suspension, Film, Dispersions) and By Regional (North America, Europe, South America, Asia Pacific, Middle East and Africa) - Forecast to 2035


ID: MRFR/CnM/2201-HCR | 140 Pages | Author: Chitranshi Jaiswal| August 2025

Graphene Market Summary

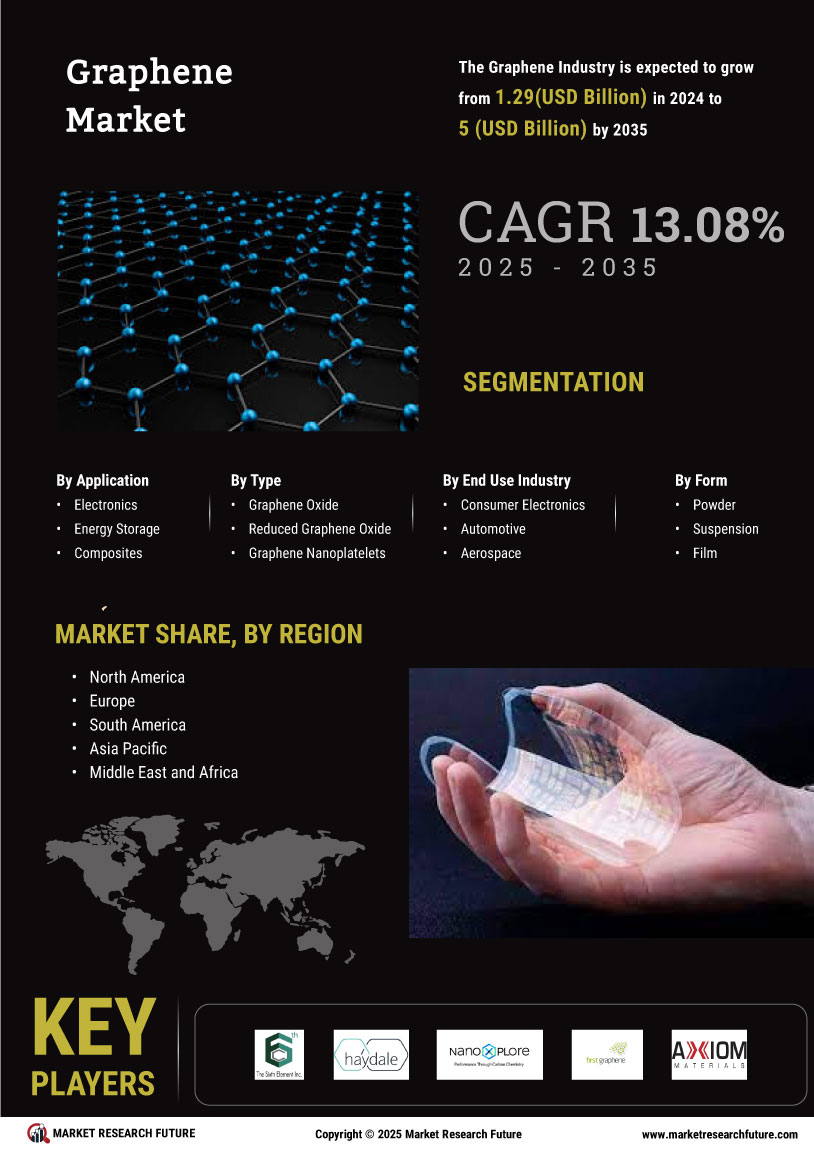
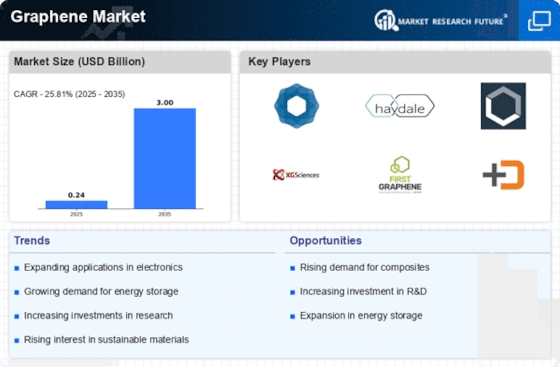
As per Market Research Future Analysis, the Global Graphene Market is poised for significant growth, driven by increasing demand for lightweight and high-performance materials across various sectors. The market was valued at 1.14 USD Billion in 2023 and is projected to reach 5.0 USD Billion by 2035, reflecting a CAGR of 13.11% from 2025 to 2035. Key applications include electronics, energy storage, composites, coatings, and biomedicine, showcasing the material's versatility and potential in enhancing product performance.

Key Market Trends & Highlights

The global graphene market is experiencing transformative trends fueled by technological advancements and industrial applications.

  • Market size in 2024: USD 1.29 Billion; projected to grow to USD 5.0 Billion by 2035.
  • Electronics application expected to grow from USD 0.3 Billion in 2024 to USD 1.15 Billion by 2035.
  • Energy Storage segment projected to increase from USD 0.25 Billion in 2024 to USD 1.0 Billion by 2035.
  • Government initiatives have allocated over EUR 1.5 billion for graphene-related projects.

Market Size & Forecast

2023 Market Size: USD 1.14 Billion
2024 Market Size: USD 1.29 Billion
2035 Market Size: USD 5.0 Billion
CAGR (2025-2035): 13.11%
Largest Regional Market Share in 2024: North America.

Major Players

Key companies include Sixth Element Materials, Haydale Graphene Industries, Applied Graphene Materials, NanoXplore, and First Graphene.

Key Graphene Market Trends Highlighted

Graphene Market Overview

Source: Primary Research, Secondary Research, Market Research Future Database and Analyst Review

Graphene Market Drivers

  • Rising Demand for Lightweight Materials

The Graphene Market Industry is seeing an increase in demand for lightweight materials, notably from the automotive and aerospace industries. Stringent rules drive the automobile industry's goal of reducing vehicle weight in order to enhance fuel economy and lower carbon emissions. For example, the International Energy Agency estimates that CO2 emissions from the transportation sector must be reduced by around 30% by 2030 in order to reach climate targets.

Manufacturers such as Boeing and Airbus are aggressively exploring and incorporating graphene-based materials into their designs, which can provide considerable weight savings over standard materials. Graphene's unique features, such as its high strength-to-weight ratio and flexibility, make it a perfect option for these uses, garnering significant investment in R&D from large corporations and governments alike. This trend represents a significant opportunity for growth in the Graphene Market Industry as more industries utilize graphene to fulfill environmental regulations while improving product performance.

Advancements in Electronics and Energy Storage

An essential driver for the growth of the Graphene Market Industry is the rapid development of electronics and energy storage systems. The market for energy storage, especially batteries, is projected to see substantial growth, driven by the increasing demand for electric vehicles and renewable energy systems. According to the International Renewable Energy Agency, energy storage capacity is expected to reach 10% of installed renewable energy capacity by 2030.

Companies like Tesla and Samsung are actively investing in graphene-based batteries, which are anticipated to offer longer life cycles and faster charging times compared to traditional lithium-ion batteries. This transformation in energy storage technology spurs interest in graphene, making it a key material in the race for efficient energy solutions.

Growing Applications in Healthcare

The application of graphene in healthcare is a significant growth driver for the Graphene Market Industry. Graphene’s biocompatibility and electrical properties make it an excellent candidate for use in drug delivery systems, biosensors, and medical imaging. The World Health Organization predicts that, by 2030, the burden of diseases will rise substantially, necessitating innovative solutions that can improve diagnosis and treatment.

Research institutions and large pharmaceutical companies are actively collaborating on projects to develop graphene-based solutions for targeted drug delivery, which could revolutionize patient treatment. This increasing focus on healthcare applications indicates a robust growth trajectory for graphene technologies in the coming years.

Graphene Market Segment Insights 

Graphene Market Application Insights 

The Graphene Market demonstrates considerable growth potential across various applications, further emphasizing its versatility and relevance in today's technological landscape. In 2024, the overall market value is projected to be 1.29 USD Billion, reflecting a burgeoning interest in graphene across multiple sectors. The electronics application, valued at 0.39 USD Billion in 2024, is expected to see significant advancements, driven by the material's excellent electrical conductivity and potential to enhance electronic devices, thus capturing a notable share of the market. The energy storage application follows closely, with a projected valuation of 0.30 USD Billion in 2024, leveraging graphene's ability to improve battery performance and charging capabilities, making it an indispensable component in the push towards more efficient energy storage solutions.
Graphene's role in composites, valued at 0.26 USD Billion in 2024, cannot be understated, as this application takes advantage of the material's lightweight and strength properties to enhance various composite materials used in industries such as aerospace and automotive. The coatings sector, valued at 0.20 USD Billion in 2024, leverages graphene's unique properties to develop advanced coatings that offer tremendous benefits, including enhanced durability and anti-corrosion capabilities, thus playing a critical role in protecting surfaces and extending the longevity of products. Meanwhile, the biomedicine application, although currently valued at 0.14 USD Billion in 2024, is significant as it showcases graphene's potential in drug delivery and medical diagnostics, thereby opening new avenues for healthcare innovation.
As the Graphene Market evolves, these applications are expected to drive substantial growth, with electronics and energy storage leading the charge due to their pressing demand for efficient, high-performance materials. The significant advancement anticipated in graphene technologies will undoubtedly underpin the market's expansion throughout the coming years, showcasing the material's diverse applications while presenting opportunities for innovation and growth across multiple industries. The focus on the application of graphene in these sectors not only underlines its technological importance but also aligns perfectly with the shift towards more sustainable and efficient solutions in various fields.

Graphene Market Application Insights

Source: Primary Research, Secondary Research, Market Research Future Database and Analyst Review

Graphene Market Type Insights 

The Graphene Market is projected to be valued at 1.29 billion USD in 2024, with significant growth expected in the coming years. As part of this dynamic market, the Type segment encompasses various forms of graphene, including Graphene Oxide, Reduced Graphene Oxide, Graphene Nanoplatelets, and Monolayer Graphene. Each of these types plays a crucial role in the market's expansion, driven by unique properties and applications. Graphene Oxide is recognized for its compatibility with a wide range of composites and holds a significant share within the market due to its ease of functionalization.

Meanwhile, Reduced Graphene Oxide, known for its excellent electrical conductivity, finds use in various technological applications, further enhancing its relevance. Graphene Nanoplatelets, valued for their mechanical strength and lightweight nature, dominate the market in composite material applications. Lastly, Monolayer Graphene, celebrated for its unparalleled properties, is increasingly sought after in advanced technology sectors, driving innovation and research. The Graphene Market data reflects a robust growth trend fueled by increasing demand from industries such as electronics, energy storage, and materials science, presenting numerous opportunities for stakeholders.

However, the market also faces challenges related to production scalability and cost-effectiveness, which could impact overall market growth.

Graphene Market End Use Industry Insights  

The Graphene Market is witnessing significant growth driven by its applications across various End Use Industries, positioning it as a key player in the advancement of technology and manufacturing. By 2024, the market is expected to be valued at 1.29 USD Billion, showcasing the increasing importance of graphene in diverse sectors. Notably, the Consumer Electronics segment is becoming a major contributor, leveraging graphene's conductive properties to enhance the performance of electronic devices. The Automotive sector shows promising potential as well, with graphene being utilized to improve fuel efficiency and reduce vehicle weight, making it a critical material for electric vehicles.

In Aerospace, graphene's lightweight and strong characteristics are transforming design and safety standards. The Healthcare segment benefits from graphene's biocompatibility, leading to innovations in drug delivery systems and medical devices. Finally, the Construction industry is increasingly adopting graphene for applications that enhance structural strength and reduce material usage, thus promoting sustainability. Overall, the Graphene Market segmentation across these industries illustrates a robust potential for market growth, driven by technological advancements and a rising demand for high-performance materials.

Graphene Market Form Insights   

The Graphene Market is projected to reach a valuation of 1.29 USD Billion by 2024, showcasing significant growth momentum within the Form segment, which includes various forms of graphene such as Powder, Suspension, Film, and Dispersions. As the industry evolves, these forms are becoming increasingly crucial due to their diverse applications across multiple sectors such as electronics, energy storage, and materials science. Powder graphene is valued for its ease of integration into multiple composite materials, while film has been recognized for its potential in high-performance applications, including flexible electronics.

Suspensions and dispersions offer unique advantages with their usability in coatings and inks, making them essential for innovative product development. The Graphene Market statistics emphasize that these forms contribute to the expanding market growth, driven by advancements in Research and Development, increasing investments, and rising demand for lightweight and high-strength materials. However, challenges such as production scalability and cost remain important hurdles for widespread adoption. The opportunities in the Graphene Market present a path for innovation with the potential to unlock new applications and thereby propel the industry to new heights.

Graphene Market Regional Insights   

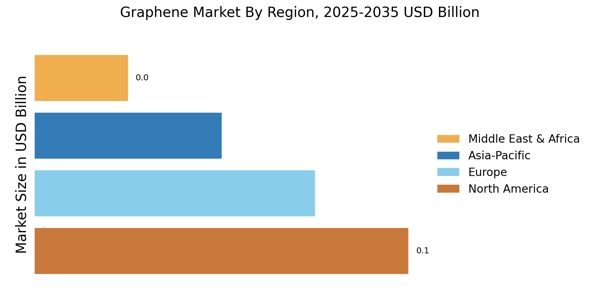
The Graphene Market showcases a diverse landscape segmented by various regions, with North America and Europe being the dominant players. In 2024, North America holds a market value of 0.385 USD Billion, expanding to 1.54 USD Billion by 2035, indicating its strong foothold due to extensive Research and Development efforts and advanced technological applications. Europe follows closely with valuations of 0.42 USD Billion in 2024 and a projected 1.68 USD Billion in 2035, driven by a strong industrial base and supportive policies for graphene innovations.

The Asia Pacific region, valued at 0.265 USD Billion initially and expected to reach 1.06 USD Billion, reflects significant growth potential spurred by increasing applications in electronics and telecommunications. South America, with a starting value of 0.13 USD Billion in 2024 and 0.52 USD Billion by 2035, is gradually gaining momentum in the market as economic developments promote material sciences. The Middle East and Africa, though smaller with a valuation of 0.09 USD Billion in 2024, is poised for growth, focusing on sustainable materials and eco-friendly applications.

This regional segmentation of the Graphene Market revenue exemplifies the varying growth dynamics influenced by economic conditions, technological advancements, and strategic industry initiatives. The continuous evolution of these markets presents numerous opportunities and challenges, illustrating the intricate landscape of the Graphene Market data and its segmentation. 

Graphene Market Regional Insights

Source: Primary Research, Secondary Research, Market Research Future Database and Analyst Review 

Graphene Market Key Players and Competitive Insights

The Graphene Market is characterized by rapid technological advancements and growing interest from various industries, leading to a competitive landscape that is dynamic and multifaceted. As the demand for graphene rises due to its exceptional properties, including electrical conductivity and mechanical strength, numerous players are vying for market share. The competitive insights reveal that companies are not only focusing on enhancing their product offerings but also on strategic partnerships and collaborations to increase their reach and innovation capabilities. This increasing competition is resulting in a notable expansion of applications across sectors, including electronics, composites, energy storage, and biomedical, which reinforces the potential for growth in the graphene market. With a diverse range of companies engaging in research and development, the market continues to evolve, driven by emerging needs and technology trends.

Graphenea is recognized as a prominent player in the Graphene Market, with a strong commitment to the development and production of high-quality graphene. The company is known for its advanced manufacturing processes and has established a notable market presence that supports diverse applications, including electronics and materials science. Graphenea's strengths lie in its innovative research capabilities and its ability to collaborate with academic institutions and industrial partners to advance graphene technology. The company has positioned itself as a leader through consistent investment in manufacturing infrastructure and talent acquisition, enabling it to effectively meet increasing demands for graphene-related products and maintain its competitive edge in a rapidly evolving market.

First Graphene is another significant entity in the Graphene Market, renowned for its focus on providing high-quality graphene products that cater to various industrial applications. The company offers a range of products, including graphene powder and inks, designed for use in sectors such as construction, automotive, and coatings. First Graphene has developed strong strategic partnerships that enhance its market presence and bolster its research and development efforts. The company’s strengths are showcased through its commitment to sustainability and the high purity of its graphene products, which stand out in a competitive landscape. Furthermore, First Graphene has engaged in mergers and acquisitions to expand its capabilities and market reach, reinforcing its position as a key player in the graphene arena. Through these strategic initiatives, First Graphene aims to capitalize on emerging opportunities and continue to lead the market forward.

Key Companies in the Graphene Market Include 

  • Graphenea
  • First Graphene
  • XG Sciences
  • Graphene Nanochem
  • Haydale Graphene Industries
  • Thomas Swan
  • NanoXplore
  • Metalliferous
  • Zhangjiagang Gohigh Semiconductor Material
  • Versarien
  • Southern Research
  • Applied Graphene Materials
  • Directa Plus
  • Grafoid

Graphene Industry Developments

  • Q2 2024: Georgia Tech researchers create first functional graphene semiconductor A team led by Walter de Heer at Georgia Tech announced the creation of the first functional graphene semiconductor, solving the 'band gap problem' and paving the way for faster, more energy-efficient electronics.
  • Q2 2024: Versarien appoints new CEO to drive graphene commercialization UK-based advanced materials company Versarien announced the appointment of a new CEO, Stephen Hodge, to accelerate the commercialization of its graphene technologies in global markets.
  • Q2 2024: NanoXplore announces opening of new graphene production facility in Montreal NanoXplore, a leading graphene producer, inaugurated a new large-scale production facility in Montreal, Canada, increasing its annual graphene output capacity to 4,000 metric tons.
  • Q3 2024: Directa Plus secures contract to supply graphene for Italian road resurfacing project Directa Plus, an Italian graphene company, won a contract to supply its graphene-enhanced asphalt additive for a major road resurfacing project in Italy, marking a significant commercial deployment.
  • Q3 2024: First Graphene signs strategic partnership with Petronas for energy storage applications First Graphene, an Australian company, entered a strategic partnership with Malaysian energy giant Petronas to develop and commercialize graphene-based materials for next-generation energy storage.
  • Q3 2024: Graphenea raises €15 million in Series C funding to expand graphene production Spanish graphene manufacturer Graphenea closed a €15 million Series C funding round led by European industrial investors to scale up its production facilities and accelerate R&D.
  • Q4 2024: Haydale announces launch of graphene-enhanced composite for aerospace sector Haydale, a UK-based advanced materials group, launched a new graphene-enhanced composite material designed for use in aerospace components, offering improved strength-to-weight ratios.
  • Q4 2024: Talga Group receives regulatory approval for Vittangi graphene battery anode facility in Sweden Talga Group, an Australian-Swedish battery materials company, received final regulatory approval to begin construction of its Vittangi graphene battery anode facility in northern Sweden.
  • Q1 2025: Samsung Electronics unveils prototype graphene battery for smartphones Samsung Electronics showcased a prototype smartphone battery using graphene technology, promising faster charging and longer lifespan compared to conventional lithium-ion batteries.
  • Q1 2025: XG Sciences announces partnership with Ford to develop graphene-enhanced automotive parts XG Sciences, a US-based graphene producer, entered a partnership with Ford Motor Company to co-develop graphene-enhanced plastics and composites for use in next-generation vehicles.
  • Q2 2025: Graphene Manufacturing Group completes IPO on Australian Securities Exchange Graphene Manufacturing Group, an Australian company specializing in graphene-based energy and filtration products, completed its initial public offering (IPO) on the ASX, raising AUD 40 million.
  • Q2 2025: China’s Sinopec launches commercial production of graphene-enhanced lubricants Chinese energy giant Sinopec announced the commercial launch of a new line of graphene-enhanced lubricants, targeting the automotive and industrial sectors for improved performance and durability.

Graphene Market Segmentation Insights 

Graphene Market Application Outlook

  • Electronics
  • Energy Storage
  • Composites
  • Coatings
  • Biomedicine 

Graphene Market Type Outlook

  • Graphene Oxide
  • Reduced Graphene Oxide
  • Graphene Nanoplatelets
  • Monolayer Graphene 

Graphene Market End Use Industry Outlook

  • Consumer Electronics
  • Automotive
  • Aerospace
  • Healthcare
  • Construction 

Graphene Market Form Outlook

  • Powder
  • Suspension
  • Film
  • Dispersions 

Graphene Market Regional Outlook

  • North America
  • Europe
  • South America
  • Asia Pacific
  • Middle East and Africa
Report Attribute/Metric Details
Market Size 2023 1.14(USD Billion)
Market Size 2024 1.29(USD Billion)
Market Size 2035 5.0(USD Billion)
Compound Annual Growth Rate (CAGR) 13.11% (2025 - 2035)
Report Coverage Revenue Forecast, Competitive Landscape, Growth Factors, and Trends
Base Year 2024
Market Forecast Period 2025 - 2035
Historical Data 2019 - 2024
Market Forecast Units USD Billion
Key Companies Profiled Graphenea, First Graphene, XG Sciences, Graphene Nanochem, Haydale Graphene Industries, Thomas Swan, NanoXplore, Metalliferous, Zhangjiagang Gohigh Semiconductor Material, Versarien, Southern Research, Applied Graphene Materials, Directa Plus, Grafoid
Segments Covered Application, Type, End Use Industry, Form, Regional
Key Market Opportunities Increasing demand in electronics, Growth in energy storage applications, Advancements in composite materials, Rising interest in biomedical applications, Expanding use in automotive industries
Key Market Dynamics Rising demand for advanced materials, Increased application in electronics, Government investments in nanotechnology, Growth in the renewable energy sector, Expanding automotive industry applications
Countries Covered North America, Europe, APAC, South America, MEA
   

Frequently Asked Questions (FAQ):

The Graphene Market is expected to be valued at 1.29 USD Billion in 2024

By 2035, the Graphene Market is projected to reach a value of 5.0 USD Billion.

The anticipated CAGR for the Graphene Market from 2025 to 2035 is 13.11%.

North America is expected to have the largest market share with a projected value of 1.54 USD Billion by 2035.

The market size for Graphene in the Electronics application is projected to reach 1.41 USD Billion by 2035.

Key players in the market include Graphenea, First Graphene, XG Sciences, and Haydale Graphene Industries.

The projected market value for the Energy Storage application is expected to be 1.08 USD Billion by 2035.

The market value for Coatings application is expected to grow to 0.73 USD Billion by 2035.

The South America market for Graphene is expected to reach a value of 0.52 USD Billion by 2035.

The market size for the Biomedicine application of Graphene is projected to be 0.53 USD Billion by 2035.

Comments

Graphene Market Segmentation

  • Graphene Market By Application (USD Billion, 2019-2035)
    • Electronics
    • Energy Storage
    • Composites
    • Coatings
    • Biomedicine
  • Graphene Market By Type (USD Billion, 2019-2035)
    • Oxide
    • Reduced Oxide
    • Nanoplatelets
    • Monolayer Graphene
  • Graphene Market By End Use Industry (USD Billion, 2019-2035)
    • Consumer Electronics
    • Automotive
    • Aerospace
    • Healthcare
    • Construction
  • Graphene Market By Form (USD Billion, 2019-2035)
    • Powder
    • Suspension
    • Film
    • Dispersions
  • Graphene Market By Regional (USD Billion, 2019-2035)
    • North America
    • Europe
    • South America
    • Asia Pacific
    • Middle East and Africa

Graphene Market Regional Outlook (USD Billion, 2019-2035)

  • North America Graphene Market Outlook (USD Billion, 2019-2035)
    • North America Market by Application Type
      • Electronics
      • Energy Storage
      • Composites
      • Coatings
      • Biomedicine
    • North America Market by Type
      • Oxide
      • Reduced Oxide
      • Nanoplatelets
      • Monolayer Graphene
    • North America Market by End Use Industry Type
      • Consumer Electronics
      • Automotive
      • Aerospace
      • Healthcare
      • Construction
    • North America Market by Form Type
      • Powder
      • Suspension
      • Film
      • Dispersions
    • North America Market by Regional Type
      • US
      • Canada
    • US Graphene Market  Outlook (USD Billion, 2019-2035)
    • US Market by Application Type
      • Electronics
      • Energy Storage
      • Composites
      • Coatings
      • Biomedicine
    • US Market by Type
      • Oxide
      • Reduced Oxide
      • Nanoplatelets
      • Monolayer Graphene
    • US Market by End Use Industry Type
      • Consumer Electronics
      • Automotive
      • Aerospace
      • Healthcare
      • Construction
    • US Market by Form Type
      • Powder
      • Suspension
      • Film
      • Dispersions
    • CANADA Graphene Market Outlook (USD Billion, 2019-2035)
    • CANADA Market by Application Type
      • Electronics
      • Energy Storage
      • Composites
      • Coatings
      • Biomedicine
    • CANADA Market by Type
      • Oxide
      • Reduced Oxide
      • Nanoplatelets
      • Monolayer Graphene
    • CANADA Market by End Use Industry Type
      • Consumer Electronics
      • Automotive
      • Aerospace
      • Healthcare
      • Construction
    • CANADA Market by Form Type
      • Powder
      • Suspension
      • Film
      • Dispersions
  • Europe Graphene Market Outlook (USD Billion, 2019-2035)
    • Europe Market by Application Type
      • Electronics
      • Energy Storage
      • Composites
      • Coatings
      • Biomedicine
    • Europe Market by Type
      • Oxide
      • Reduced Oxide
      • Nanoplatelets
      • Monolayer Graphene
    • Europe Market by End Use Industry Type
      • Consumer Electronics
      • Automotive
      • Aerospace
      • Healthcare
      • Construction
    • Europe Market by Form Type
      • Powder
      • Suspension
      • Film
      • Dispersions
    • Europe Market by Regional Type
      • Germany
      • UK
      • France
      • Russia
      • Italy
      • Spain
      • Rest of Europe
    • GERMANY Graphene Market Outlook (USD Billion, 2019-2035)
    • GERMANY Market by Application Type
      • Electronics
      • Energy Storage
      • Composites
      • Coatings
      • Biomedicine
    • GERMANY Market by Type
      • Oxide
      • Reduced Oxide
      • Nanoplatelets
      • Monolayer Graphene
    • GERMANY Market by End Use Industry Type
      • Consumer Electronics
      • Automotive
      • Aerospace
      • Healthcare
      • Construction
    • GERMANY Market by Form Type
      • Powder
      • Suspension
      • Film
      • Dispersions
    • UK Graphene Market Outlook (USD Billion, 2019-2035)
    • UK Market by Application Type
      • Electronics
      • Energy Storage
      • Composites
      • Coatings
      • Biomedicine
    • UK Market by Type
      • Oxide
      • Reduced Oxide
      • Nanoplatelets
      • Monolayer Graphene
    • UK Market by End Use Industry Type
      • Consumer Electronics
      • Automotive
      • Aerospace
      • Healthcare
      • Construction
    • UK Market by Form Type
      • Powder
      • Suspension
      • Film
      • Dispersions
    • FRANCE Graphene Market Outlook (USD Billion, 2019-2035)
    • FRANCE Market by Application Type
      • Electronics
      • Energy Storage
      • Composites
      • Coatings
      • Biomedicine
    • FRANCE Market by Type
      • Oxide
      • Reduced Oxide
      • Nanoplatelets
      • Monolayer Graphene
    • FRANCE Market by End Use Industry Type
      • Consumer Electronics
      • Automotive
      • Aerospace
      • Healthcare
      • Construction
    • FRANCE Market by Form Type
      • Powder
      • Suspension
      • Film
      • Dispersions
    • RUSSIA Graphene Market Outlook (USD Billion, 2019-2035)
    • RUSSIA Market by Application Type
      • Electronics
      • Energy Storage
      • Composites
      • Coatings
      • Biomedicine
    • RUSSIA Market by Type
      • Oxide
      • Reduced Oxide
      • Nanoplatelets
      • Monolayer Graphene
    • RUSSIA Market by End Use Industry Type
      • Consumer Electronics
      • Automotive
      • Aerospace
      • Healthcare
      • Construction
    • RUSSIA Market by Form Type
      • Powder
      • Suspension
      • Film
      • Dispersions
    • ITALY Graphene Market Outlook (USD Billion, 2019-2035)
    • ITALY Market by Application Type
      • Electronics
      • Energy Storage
      • Composites
      • Coatings
      • Biomedicine
    • ITALY Market by Type
      • Oxide
      • Reduced Oxide
      • Nanoplatelets
      • Monolayer Graphene
    • ITALY Market by End Use Industry Type
      • Consumer Electronics
      • Automotive
      • Aerospace
      • Healthcare
      • Construction
    • ITALY Market by Form Type
      • Powder
      • Suspension
      • Film
      • Dispersions
    • SPAIN Graphene Market Outlook (USD Billion, 2019-2035)
    • SPAIN Market by Application Type
      • Electronics
      • Energy Storage
      • Composites
      • Coatings
      • Biomedicine
    • SPAIN Market by Type
      • Oxide
      • Reduced Oxide
      • Nanoplatelets
      • Monolayer Graphene
    • SPAIN Market by End Use Industry Type
      • Consumer Electronics
      • Automotive
      • Aerospace
      • Healthcare
      • Construction
    • SPAIN Market by Form Type
      • Powder
      • Suspension
      • Film
      • Dispersions
    • REST OF EUROPE Graphene Market Outlook (USD Billion, 2019-2035)
    • REST OF EUROPE Market by Application Type
      • Electronics
      • Energy Storage
      • Composites
      • Coatings
      • Biomedicine
    • REST OF EUROPE Market by Type
      • Oxide
      • Reduced Oxide
      • Nanoplatelets
      • Monolayer Graphene
    • REST OF EUROPE Market by End Use Industry Type
      • Consumer Electronics
      • Automotive
      • Aerospace
      • Healthcare
      • Construction
    • REST OF EUROPE Market by Form Type
      • Powder
      • Suspension
      • Film
      • Dispersions
  • APAC Graphene Market Outlook (USD Billion, 2019-2035)
    • APAC Market by Application Type
      • Electronics
      • Energy Storage
      • Composites
      • Coatings
      • Biomedicine
    • APAC Market by Type
      • Oxide
      • Reduced Oxide
      • Nanoplatelets
      • Monolayer Graphene
    • APAC Market by End Use Industry Type
      • Consumer Electronics
      • Automotive
      • Aerospace
      • Healthcare
      • Construction
    • APAC Market by Form Type
      • Powder
      • Suspension
      • Film
      • Dispersions
    • APAC Market by Regional Type
      • China
      • India
      • Japan
      • South Korea
      • Malaysia
      • Thailand
      • Indonesia
      • Rest of APAC
    • CHINA Graphene Market Outlook (USD Billion, 2019-2035)
    • CHINA Market by Application Type
      • Electronics
      • Energy Storage
      • Composites
      • Coatings
      • Biomedicine
    • CHINA Market by Type
      • Oxide
      • Reduced Oxide
      • Nanoplatelets
      • Monolayer Graphene
    • CHINA Market by End Use Industry Type
      • Consumer Electronics
      • Automotive
      • Aerospace
      • Healthcare
      • Construction
    • CHINA Market by Form Type
      • Powder
      • Suspension
      • Film
      • Dispersions
    • INDIA Graphene Market Outlook (USD Billion, 2019-2035)
    • INDIA Market by Application Type
      • Electronics
      • Energy Storage
      • Composites
      • Coatings
      • Biomedicine
    • INDIA Market by Type
      • Oxide
      • Reduced Oxide
      • Nanoplatelets
      • Monolayer Graphene
    • INDIA Market by End Use Industry Type
      • Consumer Electronics
      • Automotive
      • Aerospace
      • Healthcare
      • Construction
    • INDIA Market by Form Type
      • Powder
      • Suspension
      • Film
      • Dispersions
    • JAPAN Graphene Market Outlook (USD Billion, 2019-2035)
    • JAPAN Market by Application Type
      • Electronics
      • Energy Storage
      • Composites
      • Coatings
      • Biomedicine
    • JAPAN Market by Type
      • Oxide
      • Reduced Oxide
      • Nanoplatelets
      • Monolayer Graphene
    • JAPAN Market by End Use Industry Type
      • Consumer Electronics
      • Automotive
      • Aerospace
      • Healthcare
      • Construction
    • JAPAN Market by Form Type
      • Powder
      • Suspension
      • Film
      • Dispersions
    • SOUTH KOREA Graphene Market Outlook (USD Billion, 2019-2035)
    • SOUTH KOREA Market by Application Type
      • Electronics
      • Energy Storage
      • Composites
      • Coatings
      • Biomedicine
    • SOUTH KOREA Market by Type
      • Oxide
      • Reduced Oxide
      • Nanoplatelets
      • Monolayer Graphene
    • SOUTH KOREA Market by End Use Industry Type
      • Consumer Electronics
      • Automotive
      • Aerospace
      • Healthcare
      • Construction
    • SOUTH KOREA Market by Form Type
      • Powder
      • Suspension
      • Film
      • Dispersions
    • MALAYSIA Graphene Market Outlook (USD Billion, 2019-2035)
    • MALAYSIA Market by Application Type
      • Electronics
      • Energy Storage
      • Composites
      • Coatings
      • Biomedicine
    • MALAYSIA Market by Type
      • Oxide
      • Reduced Oxide
      • Nanoplatelets
      • Monolayer Graphene
    • MALAYSIA Market by End Use Industry Type
      • Consumer Electronics
      • Automotive
      • Aerospace
      • Healthcare
      • Construction
    • MALAYSIA Market by Form Type
      • Powder
      • Suspension
      • Film
      • Dispersions
    • THAILAND Graphene Market Outlook (USD Billion, 2019-2035)
    • THAILAND Market by Application Type
      • Electronics
      • Energy Storage
      • Composites
      • Coatings
      • Biomedicine
    • THAILAND Market by Type
      • Oxide
      • Reduced Oxide
      • Nanoplatelets
      • Monolayer Graphene
    • THAILAND Market by End Use Industry Type
      • Consumer Electronics
      • Automotive
      • Aerospace
      • Healthcare
      • Construction
    • THAILAND Market by Form Type
      • Powder
      • Suspension
      • Film
      • Dispersions
    • INDONESIA Graphene Market Outlook (USD Billion, 2019-2035)
    • INDONESIA Market by Application Type
      • Electronics
      • Energy Storage
      • Composites
      • Coatings
      • Biomedicine
    • INDONESIA Market by Type
      • Oxide
      • Reduced Oxide
      • Nanoplatelets
      • Monolayer Graphene
    • INDONESIA Market by End Use Industry Type
      • Consumer Electronics
      • Automotive
      • Aerospace
      • Healthcare
      • Construction
    • INDONESIA Market by Form Type
      • Powder
      • Suspension
      • Film
      • Dispersions
    • REST OF APAC Graphene Market Outlook (USD Billion, 2019-2035)
    • REST OF APAC Market by Application Type
      • Electronics
      • Energy Storage
      • Composites
      • Coatings
      • Biomedicine
    • REST OF APAC Market by Type
      • Oxide
      • Reduced Oxide
      • Nanoplatelets
      • Monolayer Graphene
    • REST OF APAC Market by End Use Industry Type
      • Consumer Electronics
      • Automotive
      • Aerospace
      • Healthcare
      • Construction
    • REST OF APAC Market by Form Type
      • Powder
      • Suspension
      • Film
      • Dispersions
  • South America Graphene Market Outlook (USD Billion, 2019-2035)
    • South America Market by Application Type
      • Electronics
      • Energy Storage
      • Composites
      • Coatings
      • Biomedicine
    • South America Market by Type
      • Oxide
      • Reduced Oxide
      • Nanoplatelets
      • Monolayer Graphene
    • South America Market by End Use Industry Type
      • Consumer Electronics
      • Automotive
      • Aerospace
      • Healthcare
      • Construction
    • South America Market by Form Type
      • Powder
      • Suspension
      • Film
      • Dispersions
    • South America Market by Regional Type
      • Brazil
      • Mexico
      • Argentina
      • Rest of South America
    • BRAZIL Graphene Market Outlook (USD Billion, 2019-2035)
    • BRAZIL Market by Application Type
      • Electronics
      • Energy Storage
      • Composites
      • Coatings
      • Biomedicine
    • BRAZIL Market by Type
      • Oxide
      • Reduced Oxide
      • Nanoplatelets
      • Monolayer Graphene
    • BRAZIL Market by End Use Industry Type
      • Consumer Electronics
      • Automotive
      • Aerospace
      • Healthcare
      • Construction
    • BRAZIL Market by Form Type
      • Powder
      • Suspension
      • Film
      • Dispersions
    • MEXICO Graphene Market Outlook (USD Billion, 2019-2035)
    • MEXICO Market by Application Type
      • Electronics
      • Energy Storage
      • Composites
      • Coatings
      • Biomedicine
    • MEXICO Market by Type
      • Oxide
      • Reduced Oxide
      • Nanoplatelets
      • Monolayer Graphene
    • MEXICO Market by End Use Industry Type
      • Consumer Electronics
      • Automotive
      • Aerospace
      • Healthcare
      • Construction
    • MEXICO Market by Form Type
      • Powder
      • Suspension
      • Film
      • Dispersions
    • ARGENTINA Graphene Market Outlook (USD Billion, 2019-2035)
    • ARGENTINA Market by Application Type
      • Electronics
      • Energy Storage
      • Composites
      • Coatings
      • Biomedicine
    • ARGENTINA Market by Type
      • Oxide
      • Reduced Oxide
      • Nanoplatelets
      • Monolayer Graphene
    • ARGENTINA Market by End Use Industry Type
      • Consumer Electronics
      • Automotive
      • Aerospace
      • Healthcare
      • Construction
    • ARGENTINA Market by Form Type
      • Powder
      • Suspension
      • Film
      • Dispersions
    • REST OF SOUTH AMERICA Graphene Market Outlook (USD Billion, 2019-2035)
    • REST OF SOUTH AMERICA Market by Application Type
      • Electronics
      • Energy Storage
      • Composites
      • Coatings
      • Biomedicine
    • REST OF SOUTH AMERICA Market by Type
      • Oxide
      • Reduced Oxide
      • Nanoplatelets
      • Monolayer Graphene
    • REST OF SOUTH AMERICA Market by End Use Industry Type
      • Consumer Electronics
      • Automotive
      • Aerospace
      • Healthcare
      • Construction
    • REST OF SOUTH AMERICA Market by Form Type
      • Powder
      • Suspension
      • Film
      • Dispersions
  • MEA Outlook (USD Billion, 2019-2035)
    • MEA Market by Application Type
      • Electronics
      • Energy Storage
      • Composites
      • Coatings
      • Biomedicine
    • MEA Market by Type
      • Oxide
      • Reduced Oxide
      • Nanoplatelets
      • Monolayer Graphene
    • MEA Market by End Use Industry Type
      • Consumer Electronics
      • Automotive
      • Aerospace
      • Healthcare
      • Construction
    • MEA Market by Form Type
      • Powder
      • Suspension
      • Film
      • Dispersions
    • MEA Market by Regional Type
      • GCC Countries
      • South Africa
      • Rest of MEA
    • GCC COUNTRIES Graphene Market Outlook (USD Billion, 2019-2035)
    • GCC COUNTRIES Market by Application Type
      • Electronics
      • Energy Storage
      • Composites
      • Coatings
      • Biomedicine
    • GCC COUNTRIES Market by Type
      • Oxide
      • Reduced Oxide
      • Nanoplatelets
      • Monolayer Graphene
    • GCC COUNTRIES Market by End Use Industry Type
      • Consumer Electronics
      • Automotive
      • Aerospace
      • Healthcare
      • Construction
    • GCC COUNTRIES Market by Form Type
      • Powder
      • Suspension
      • Film
      • Dispersions
    • SOUTH AFRICA Graphene Market Outlook (USD Billion, 2019-2035)
    • SOUTH AFRICA Market by Application Type
      • Electronics
      • Energy Storage
      • Composites
      • Coatings
      • Biomedicine
    • SOUTH AFRICA Market by Type
      • Oxide
      • Reduced Oxide
      • Nanoplatelets
      • Monolayer Graphene
    • SOUTH AFRICA Market by End Use Industry Type
      • Consumer Electronics
      • Automotive
      • Aerospace
      • Healthcare
      • Construction
    • SOUTH AFRICA Market by Form Type
      • Powder
      • Suspension
      • Film
      • Dispersions
    • REST OF MEA Graphene Market Outlook (USD Billion, 2019-2035)
    • REST OF MEA Market by Application Type
      • Electronics
      • Energy Storage
      • Composites
      • Coatings
      • Biomedicine
    • REST OF MEA Market by Type
      • Oxide
      • Reduced Oxide
      • Nanoplatelets
      • Monolayer Graphene
    • REST OF MEA Market by End Use Industry Type
      • Consumer Electronics
      • Automotive
      • Aerospace
      • Healthcare
      • Construction
    • REST OF MEA Market by Form Type
      • Powder
      • Suspension
      • Film
      • Dispersions

Research Methodology on Graphene Market


1. Introduction


The research methodology of the Graphene Market report outlines the data collection plan and approach used to ensure the accuracy and completeness of the study’s results. It describes the key techniques and tools used to test the hypotheses and provides detailed information about the research design and techniques used to obtain data.


2. Objectives


The objective of the Graphene Market report is to analyze the market size, region-wide market trends and opportunities, and to identify and understand the major market factors influencing the growth of the graphene market.


3. Research Design & Development


The research design adopted for the Graphene Market report is a mix of qualitative & quantitative approaches, combining primary & secondary research. A thorough understanding of the market is obtained from primary and secondary sources such as industry-related seminars, conferences and events, industry interviews, and other published materials.


4. Source of Data


Data for the Graphene Market report are collected from secondary and primary sources. Secondary sources include published documents such as company reports and industry databases. On the other hand, primary sources include interviews and surveys of industry experts and representatives. Furthermore, our research team used powerful market analysis tools such as SWOT analysis and Porter’s Five Forces analysis to compare the performance of the market and to identify potential segments of opportunity.


5. Sampling & Data Collection


The sampling is done by selecting the strategically important market participants who are experienced in the likely progress of the Graphene Market. Data is collected through structured questionnaires and interviews, which are selected through screening criteria focusing on factors such as age, occupation, educational and economic background, etc. Primary interviews are conducted with industry experts, senior executives and suppliers. Secondary data sources include corporate presentations, national and international trade databases, business magazines, and journals.


6. Data Analysis


The primary and secondary data collected are analyzed and validated to arrive at conclusions. The market estimates are compiled through a combination of bottom-up and top-down approaches. With the help of SWOT analysis and Porter’s Five Forces analysis, the market size of the Graphene Market is estimated and the forecast was provided.


7. Conclusions


The research provides a comprehensive analysis of the Graphene Market. The globally competitive Graphene Market is analyzed and segmented into various market segments and estimated in terms of market size and growth rate. The research is conducted through both qualitative & quantitative analyses, which have resulted in a comprehensive understanding of the Graphene Market.

TABLE OF CONTENTS


1. EXECUTIVE SUMMARY   


1.1. Market Overview     


1.2. Key Findings     


1.3. Market Segmentation     


1.4. Competitive Landscape     


1.5. Challenges and Opportunities     


1.6. Future Outlook        


2. MARKET INTRODUCTION   


2.1. Definition     


2.2. Scope of the study   


2.2.1. Research Objective         


2.2.2. Assumption         


2.2.3. Limitations              


3. RESEARCH METHODOLOGY   


3.1. Overview     


3.2. Data Mining     


3.3. Secondary Research     


3.4. Primary Research   


3.4.1. Primary Interviews and Information Gathering Process         


3.4.2. Breakdown of Primary Respondents           


3.5. Forecasting Model     


3.6. Market Size Estimation   


3.6.1. Bottom-Up Approach         


3.6.2. Top-Down Approach           


3.7. Data Triangulation     


3.8. Validation        


4. MARKET DYNAMICS   


4.1. Overview     


4.2. Drivers     


4.3. Restraints     


4.4. Opportunities        


5. MARKET FACTOR ANALYSIS   


5.1. Value chain Analysis     


5.2. Porter's Five Forces Analysis   


5.2.1. Bargaining Power of Suppliers         


5.2.2. Bargaining Power of Buyers         


5.2.3. Threat of New Entrants         


5.2.4. Threat of Substitutes         


5.2.5. Intensity of Rivalry           


5.3. COVID-19 Impact Analysis   


5.3.1. Market Impact Analysis         


5.3.2. Regional Impact         


5.3.3. Opportunity and Threat Analysis              


6. GRAPHENE MARKET, BY APPLICATION (USD BILLION)   


6.1. Electronics     


6.2. Energy Storage     


6.3. Composites     


6.4. Coatings     


6.5. Biomedicine        


7. GRAPHENE MARKET, BY TYPE (USD BILLION)   


7.1. Graphene Oxide     


7.2. Reduced Graphene Oxide     


7.3. Graphene Nanoplatelets     


7.4. Monolayer Graphene        


8. GRAPHENE MARKET, BY END USE INDUSTRY (USD BILLION)   


8.1. Consumer Electronics     


8.2. Automotive     


8.3. Aerospace     


8.4. Healthcare     


8.5. Construction        


9. GRAPHENE MARKET, BY FORM (USD BILLION)   


9.1. Powder     


9.2. Suspension     


9.3. Film     


9.4. Dispersions        


10. GRAPHENE MARKET, BY REGIONAL (USD BILLION)   


10.1. North America   


10.1.1. US         


10.1.2. Canada           


10.2. Europe   


10.2.1. Germany         


10.2.2. UK         


10.2.3. France         


10.2.4. Russia         


10.2.5. Italy         


10.2.6. Spain         


10.2.7. Rest of Europe           


10.3. APAC   


10.3.1. China         


10.3.2. India         


10.3.3. Japan         


10.3.4. South Korea         


10.3.5. Malaysia         


10.3.6. Thailand         


10.3.7. Indonesia         


10.3.8. Rest of APAC           


10.4. South America   


10.4.1. Brazil         


10.4.2. Mexico         


10.4.3. Argentina         


10.4.4. Rest of South America           


10.5. MEA   


10.5.1. GCC Countries         


10.5.2. South Africa         


10.5.3. Rest of MEA              


11. COMPETITIVE LANDSCAPE   


11.1. Overview     


11.2. Competitive Analysis     


11.3. Market share Analysis     


11.4. Major Growth Strategy in the Graphene Market     


11.5. Competitive Benchmarking     


11.6. Leading Players in Terms of Number of Developments in the Graphene Market     


11.7. Key developments and growth strategies   


11.7.1. New Product Launch/Service Deployment         


11.7.2. Merger & Acquisitions         


11.7.3. Joint Ventures           


11.8. Major Players Financial Matrix    


11.8.1. Sales and Operating Income         


11.8.2. Major Players R&D Expenditure. 2023              


12. COMPANY PROFILES   


12.1. Graphenea   


12.1.1. Financial Overview         


12.1.2. Products Offered         


12.1.3. Key Developments         


12.1.4. SWOT Analysis         


12.1.5. Key Strategies           


12.2. First Graphene   


12.2.1. Financial Overview         


12.2.2. Products Offered         


12.2.3. Key Developments         


12.2.4. SWOT Analysis         


12.2.5. Key Strategies           


12.3. XG Sciences   


12.3.1. Financial Overview         


12.3.2. Products Offered         


12.3.3. Key Developments         


12.3.4. SWOT Analysis         


12.3.5. Key Strategies           


12.4. Graphene Nanochem   


12.4.1. Financial Overview         


12.4.2. Products Offered         


12.4.3. Key Developments         


12.4.4. SWOT Analysis         


12.4.5. Key Strategies           


12.5. Haydale Graphene Industries   


12.5.1. Financial Overview         


12.5.2. Products Offered         


12.5.3. Key Developments         


12.5.4. SWOT Analysis         


12.5.5. Key Strategies           


12.6. Thomas Swan   


12.6.1. Financial Overview         


12.6.2. Products Offered         


12.6.3. Key Developments         


12.6.4. SWOT Analysis         


12.6.5. Key Strategies           


12.7. NanoXplore   


12.7.1. Financial Overview         


12.7.2. Products Offered         


12.7.3. Key Developments         


12.7.4. SWOT Analysis         


12.7.5. Key Strategies           


12.8. Metalliferous   


12.8.1. Financial Overview         


12.8.2. Products Offered         


12.8.3. Key Developments         


12.8.4. SWOT Analysis         


12.8.5. Key Strategies           


12.9. Zhangjiagang Gohigh Semiconductor Material   


12.9.1. Financial Overview         


12.9.2. Products Offered         


12.9.3. Key Developments         


12.9.4. SWOT Analysis         


12.9.5. Key Strategies           


12.10. Versarien   


12.10.1. Financial Overview         


12.10.2. Products Offered         


12.10.3. Key Developments         


12.10.4. SWOT Analysis         


12.10.5. Key Strategies           


12.11. Southern Research   


12.11.1. Financial Overview         


12.11.2. Products Offered         


12.11.3. Key Developments         


12.11.4. SWOT Analysis         


12.11.5. Key Strategies           


12.12. Applied Graphene Materials   


12.12.1. Financial Overview         


12.12.2. Products Offered         


12.12.3. Key Developments         


12.12.4. SWOT Analysis         


12.12.5. Key Strategies           


12.13. Directa Plus   


12.13.1. Financial Overview         


12.13.2. Products Offered         


12.13.3. Key Developments         


12.13.4. SWOT Analysis         


12.13.5. Key Strategies           


12.14. Grafoid   


12.14.1. Financial Overview         


12.14.2. Products Offered         


12.14.3. Key Developments         


12.14.4. SWOT Analysis         


12.14.5. Key Strategies              


13. APPENDIX   


13.1. References     


13.2. Related Reports        


LIST OF TABLES


TABLE 1. LIST OF ASSUMPTIONS   


TABLE 2. NORTH AMERICA GRAPHENE MARKET SIZE ESTIMATES & FORECAST BY APPLICATION, 2019-2035 (USD BILLIONS)   


TABLE 3. NORTH AMERICA MARKET SIZE ESTIMATES & FORECAST BY TYPE, 2019-2035 (USD BILLIONS)   


TABLE 4. NORTH AMERICA MARKET SIZE ESTIMATES & FORECAST BY END USE INDUSTRY, 2019-2035 (USD BILLIONS)   


TABLE 5. NORTH AMERICA MARKET SIZE ESTIMATES & FORECAST BY FORM, 2019-2035 (USD BILLIONS)   


TABLE 6. NORTH AMERICA MARKET SIZE ESTIMATES & FORECAST BY REGIONAL, 2019-2035 (USD BILLIONS)   


TABLE 7. US GRAPHENE MARKET SIZE ESTIMATES & FORECAST BY APPLICATION, 2019-2035 (USD BILLIONS)   


TABLE 8. US MARKET SIZE ESTIMATES & FORECAST BY TYPE, 2019-2035 (USD BILLIONS)   


TABLE 9. US MARKET SIZE ESTIMATES & FORECAST BY END USE INDUSTRY, 2019-2035 (USD BILLIONS)   


TABLE 10. US MARKET SIZE ESTIMATES & FORECAST BY FORM, 2019-2035 (USD BILLIONS)   


TABLE 11. US MARKET SIZE ESTIMATES & FORECAST BY REGIONAL, 2019-2035 (USD BILLIONS)   


TABLE 12. CANADA GRAPHENE MARKET SIZE ESTIMATES & FORECAST BY APPLICATION, 2019-2035 (USD BILLIONS)   


TABLE 13. CANADA MARKET SIZE ESTIMATES & FORECAST BY TYPE, 2019-2035 (USD BILLIONS)   


TABLE 14. CANADA MARKET SIZE ESTIMATES & FORECAST BY END USE INDUSTRY, 2019-2035 (USD BILLIONS)   


TABLE 15. CANADA MARKET SIZE ESTIMATES & FORECAST BY FORM, 2019-2035 (USD BILLIONS)   


TABLE 16. CANADA MARKET SIZE ESTIMATES & FORECAST BY REGIONAL, 2019-2035 (USD BILLIONS)   


TABLE 17. EUROPE GRAPHENE MARKET SIZE ESTIMATES & FORECAST BY APPLICATION, 2019-2035 (USD BILLIONS)   


TABLE 18. EUROPE MARKET SIZE ESTIMATES & FORECAST BY TYPE, 2019-2035 (USD BILLIONS)   


TABLE 19. EUROPE MARKET SIZE ESTIMATES & FORECAST BY END USE INDUSTRY, 2019-2035 (USD BILLIONS)   


TABLE 20. EUROPE MARKET SIZE ESTIMATES & FORECAST BY FORM, 2019-2035 (USD BILLIONS)   


TABLE 21. EUROPE MARKET SIZE ESTIMATES & FORECAST BY REGIONAL, 2019-2035 (USD BILLIONS)   


TABLE 22. GERMANY GRAPHENE MARKET SIZE ESTIMATES & FORECAST BY APPLICATION, 2019-2035 (USD BILLIONS)   


TABLE 23. GERMANY MARKET SIZE ESTIMATES & FORECAST BY TYPE, 2019-2035 (USD BILLIONS)   


TABLE 24. GERMANY MARKET SIZE ESTIMATES & FORECAST BY END USE INDUSTRY, 2019-2035 (USD BILLIONS)   


TABLE 25. GERMANY MARKET SIZE ESTIMATES & FORECAST BY FORM, 2019-2035 (USD BILLIONS)   


TABLE 26. GERMANY MARKET SIZE ESTIMATES & FORECAST BY REGIONAL, 2019-2035 (USD BILLIONS)   


TABLE 27. UK GRAPHENE MARKET SIZE ESTIMATES & FORECAST BY APPLICATION, 2019-2035 (USD BILLIONS)   


TABLE 28. UK MARKET SIZE ESTIMATES & FORECAST BY TYPE, 2019-2035 (USD BILLIONS)   


TABLE 29. UK MARKET SIZE ESTIMATES & FORECAST BY END USE INDUSTRY, 2019-2035 (USD BILLIONS)   


TABLE 30. UK MARKET SIZE ESTIMATES & FORECAST BY FORM, 2019-2035 (USD BILLIONS)   


TABLE 31. UK MARKET SIZE ESTIMATES & FORECAST BY REGIONAL, 2019-2035 (USD BILLIONS)   


TABLE 32. FRANCE GRAPHENE MARKET SIZE ESTIMATES & FORECAST BY APPLICATION, 2019-2035 (USD BILLIONS)   


TABLE 33. FRANCE MARKET SIZE ESTIMATES & FORECAST BY TYPE, 2019-2035 (USD BILLIONS)   


TABLE 34. FRANCE MARKET SIZE ESTIMATES & FORECAST BY END USE INDUSTRY, 2019-2035 (USD BILLIONS)   


TABLE 35. FRANCE MARKET SIZE ESTIMATES & FORECAST BY FORM, 2019-2035 (USD BILLIONS)   


TABLE 36. FRANCE MARKET SIZE ESTIMATES & FORECAST BY REGIONAL, 2019-2035 (USD BILLIONS)   


TABLE 37. RUSSIA GRAPHENE MARKET SIZE ESTIMATES & FORECAST BY APPLICATION, 2019-2035 (USD BILLIONS)   


TABLE 38. RUSSIA MARKET SIZE ESTIMATES & FORECAST BY TYPE, 2019-2035 (USD BILLIONS)   


TABLE 39. RUSSIA MARKET SIZE ESTIMATES & FORECAST BY END USE INDUSTRY, 2019-2035 (USD BILLIONS)   


TABLE 40. RUSSIA MARKET SIZE ESTIMATES & FORECAST BY FORM, 2019-2035 (USD BILLIONS)   


TABLE 41. RUSSIA MARKET SIZE ESTIMATES & FORECAST BY REGIONAL, 2019-2035 (USD BILLIONS)   


TABLE 42. ITALY GRAPHENE MARKET SIZE ESTIMATES & FORECAST BY APPLICATION, 2019-2035 (USD BILLIONS)   


TABLE 43. ITALY MARKET SIZE ESTIMATES & FORECAST BY TYPE, 2019-2035 (USD BILLIONS)   


TABLE 44. ITALY MARKET SIZE ESTIMATES & FORECAST BY END USE INDUSTRY, 2019-2035 (USD BILLIONS)   


TABLE 45. ITALY MARKET SIZE ESTIMATES & FORECAST BY FORM, 2019-2035 (USD BILLIONS)   


TABLE 46. ITALY MARKET SIZE ESTIMATES & FORECAST BY REGIONAL, 2019-2035 (USD BILLIONS)   


TABLE 47. SPAIN GRAPHENE MARKET SIZE ESTIMATES & FORECAST BY APPLICATION, 2019-2035 (USD BILLIONS)   


TABLE 48. SPAIN MARKET SIZE ESTIMATES & FORECAST BY TYPE, 2019-2035 (USD BILLIONS)   


TABLE 49. SPAIN MARKET SIZE ESTIMATES & FORECAST BY END USE INDUSTRY, 2019-2035 (USD BILLIONS)   


TABLE 50. SPAIN MARKET SIZE ESTIMATES & FORECAST BY FORM, 2019-2035 (USD BILLIONS)   


TABLE 51. SPAIN MARKET SIZE ESTIMATES & FORECAST BY REGIONAL, 2019-2035 (USD BILLIONS)   


TABLE 52. REST OF EUROPE GRAPHENE MARKET SIZE ESTIMATES & FORECAST BY APPLICATION, 2019-2035 (USD BILLIONS)   


TABLE 53. REST OF EUROPE MARKET SIZE ESTIMATES & FORECAST BY TYPE, 2019-2035 (USD BILLIONS)   


TABLE 54. REST OF EUROPE MARKET SIZE ESTIMATES & FORECAST BY END USE INDUSTRY, 2019-2035 (USD BILLIONS)   


TABLE 55. REST OF EUROPE MARKET SIZE ESTIMATES & FORECAST BY FORM, 2019-2035 (USD BILLIONS)   


TABLE 56. REST OF EUROPE MARKET SIZE ESTIMATES & FORECAST BY REGIONAL, 2019-2035 (USD BILLIONS)   


TABLE 57. APAC GRAPHENE MARKET SIZE ESTIMATES & FORECAST BY APPLICATION, 2019-2035 (USD BILLIONS)   


TABLE 58. APAC MARKET SIZE ESTIMATES & FORECAST BY TYPE, 2019-2035 (USD BILLIONS)   


TABLE 59. APAC MARKET SIZE ESTIMATES & FORECAST BY END USE INDUSTRY, 2019-2035 (USD BILLIONS)   


TABLE 60. APAC MARKET SIZE ESTIMATES & FORECAST BY FORM, 2019-2035 (USD BILLIONS)   


TABLE 61. APAC MARKET SIZE ESTIMATES & FORECAST BY REGIONAL, 2019-2035 (USD BILLIONS)   


TABLE 62. CHINA GRAPHENE MARKET SIZE ESTIMATES & FORECAST BY APPLICATION, 2019-2035 (USD BILLIONS)   


TABLE 63. CHINA MARKET SIZE ESTIMATES & FORECAST BY TYPE, 2019-2035 (USD BILLIONS)   


TABLE 64. CHINA MARKET SIZE ESTIMATES & FORECAST BY END USE INDUSTRY, 2019-2035 (USD BILLIONS)   


TABLE 65. CHINA MARKET SIZE ESTIMATES & FORECAST BY FORM, 2019-2035 (USD BILLIONS)   


TABLE 66. CHINA MARKET SIZE ESTIMATES & FORECAST BY REGIONAL, 2019-2035 (USD BILLIONS)   


TABLE 67. INDIA GRAPHENE MARKET SIZE ESTIMATES & FORECAST BY APPLICATION, 2019-2035 (USD BILLIONS)   


TABLE 68. INDIA MARKET SIZE ESTIMATES & FORECAST BY TYPE, 2019-2035 (USD BILLIONS)   


TABLE 69. INDIA MARKET SIZE ESTIMATES & FORECAST BY END USE INDUSTRY, 2019-2035 (USD BILLIONS)   


TABLE 70. INDIA MARKET SIZE ESTIMATES & FORECAST BY FORM, 2019-2035 (USD BILLIONS)   


TABLE 71. INDIA MARKET SIZE ESTIMATES & FORECAST BY REGIONAL, 2019-2035 (USD BILLIONS)   


TABLE 72. JAPAN MARKET SIZE ESTIMATES & FORECAST BY APPLICATION, 2019-2035 (USD BILLIONS)   


TABLE 73. JAPAN GRAPHENE MARKET SIZE ESTIMATES & FORECAST BY TYPE, 2019-2035 (USD BILLIONS)   


TABLE 74. JAPAN MARKET SIZE ESTIMATES & FORECAST BY END USE INDUSTRY, 2019-2035 (USD BILLIONS)   


TABLE 75. JAPAN MARKET SIZE ESTIMATES & FORECAST BY FORM, 2019-2035 (USD BILLIONS)   


TABLE 76. JAPAN MARKET SIZE ESTIMATES & FORECAST BY REGIONAL, 2019-2035 (USD BILLIONS)   


TABLE 77. SOUTH KOREA GRAPHENE MARKET SIZE ESTIMATES & FORECAST BY APPLICATION, 2019-2035 (USD BILLIONS)   


TABLE 78. SOUTH KOREA MARKET SIZE ESTIMATES & FORECAST BY TYPE, 2019-2035 (USD BILLIONS)   


TABLE 79. SOUTH KOREA MARKET SIZE ESTIMATES & FORECAST BY END USE INDUSTRY, 2019-2035 (USD BILLIONS)   


TABLE 80. SOUTH KOREA MARKET SIZE ESTIMATES & FORECAST BY FORM, 2019-2035 (USD BILLIONS)   


TABLE 81. SOUTH KOREA MARKET SIZE ESTIMATES & FORECAST BY REGIONAL, 2019-2035 (USD BILLIONS)   


TABLE 82. MALAYSIA GRAPHENE MARKET SIZE ESTIMATES & FORECAST BY APPLICATION, 2019-2035 (USD BILLIONS)   


TABLE 83. MALAYSIA MARKET SIZE ESTIMATES & FORECAST BY TYPE, 2019-2035 (USD BILLIONS)   


TABLE 84. MALAYSIA MARKET SIZE ESTIMATES & FORECAST BY END USE INDUSTRY, 2019-2035 (USD BILLIONS)   


TABLE 85. MALAYSIA MARKET SIZE ESTIMATES & FORECAST BY FORM, 2019-2035 (USD BILLIONS)   


TABLE 86. MALAYSIA MARKET SIZE ESTIMATES & FORECAST BY REGIONAL, 2019-2035 (USD BILLIONS)   


TABLE 87. THAILAND GRAPHENE MARKET SIZE ESTIMATES & FORECAST BY APPLICATION, 2019-2035 (USD BILLIONS)   


TABLE 88. THAILAND MARKET SIZE ESTIMATES & FORECAST BY TYPE, 2019-2035 (USD BILLIONS)   


TABLE 89. THAILAND MARKET SIZE ESTIMATES & FORECAST BY END USE INDUSTRY, 2019-2035 (USD BILLIONS)   


TABLE 90. THAILAND MARKET SIZE ESTIMATES & FORECAST BY FORM, 2019-2035 (USD BILLIONS)   


TABLE 91. THAILAND MARKET SIZE ESTIMATES & FORECAST BY REGIONAL, 2019-2035 (USD BILLIONS)   


TABLE 92. INDONESIA GRAPHENE MARKET SIZE ESTIMATES & FORECAST BY APPLICATION, 2019-2035 (USD BILLIONS)   


TABLE 93. INDONESIA MARKET SIZE ESTIMATES & FORECAST BY TYPE, 2019-2035 (USD BILLIONS)   


TABLE 94. INDONESIA MARKET SIZE ESTIMATES & FORECAST BY END USE INDUSTRY, 2019-2035 (USD BILLIONS)   


TABLE 95. INDONESIA MARKET SIZE ESTIMATES & FORECAST BY FORM, 2019-2035 (USD BILLIONS)   


TABLE 96. INDONESIA MARKET SIZE ESTIMATES & FORECAST BY REGIONAL, 2019-2035 (USD BILLIONS)   


TABLE 97. REST OF APAC GRAPHENE MARKET SIZE ESTIMATES & FORECAST BY APPLICATION, 2019-2035 (USD BILLIONS)   


TABLE 98. REST OF APAC MARKET SIZE ESTIMATES & FORECAST BY TYPE, 2019-2035 (USD BILLIONS)   


TABLE 99. REST OF APAC MARKET SIZE ESTIMATES & FORECAST BY END USE INDUSTRY, 2019-2035 (USD BILLIONS)   


TABLE 100. REST OF APAC MARKET SIZE ESTIMATES & FORECAST BY FORM, 2019-2035 (USD BILLIONS)   


TABLE 101. REST OF APAC MARKET SIZE ESTIMATES & FORECAST BY REGIONAL, 2019-2035 (USD BILLIONS)   


TABLE 102. SOUTH AMERICA GRAPHENE MARKET SIZE ESTIMATES & FORECAST BY APPLICATION, 2019-2035 (USD BILLIONS)   


TABLE 103. SOUTH AMERICA MARKET SIZE ESTIMATES & FORECAST BY TYPE, 2019-2035 (USD BILLIONS)   


TABLE 104. SOUTH AMERICA MARKET SIZE ESTIMATES & FORECAST BY END USE INDUSTRY, 2019-2035 (USD BILLIONS)   


TABLE 105. SOUTH AMERICA MARKET SIZE ESTIMATES & FORECAST BY FORM, 2019-2035 (USD BILLIONS)   


TABLE 106. SOUTH AMERICA MARKET SIZE ESTIMATES & FORECAST BY REGIONAL, 2019-2035 (USD BILLIONS)   


TABLE 107. BRAZIL GRAPHENE MARKET SIZE ESTIMATES & FORECAST BY APPLICATION, 2019-2035 (USD BILLIONS)   


TABLE 108. BRAZIL MARKET SIZE ESTIMATES & FORECAST BY TYPE, 2019-2035 (USD BILLIONS)   


TABLE 109. BRAZIL MARKET SIZE ESTIMATES & FORECAST BY END USE INDUSTRY, 2019-2035 (USD BILLIONS)   


TABLE 110. BRAZIL MARKET SIZE ESTIMATES & FORECAST BY FORM, 2019-2035 (USD BILLIONS)   


TABLE 111. BRAZIL MARKET SIZE ESTIMATES & FORECAST BY REGIONAL, 2019-2035 (USD BILLIONS)   


TABLE 112. MEXICO GRAPHENE MARKET SIZE ESTIMATES & FORECAST BY APPLICATION, 2019-2035 (USD BILLIONS)   


TABLE 113. MEXICO MARKET SIZE ESTIMATES & FORECAST BY TYPE, 2019-2035 (USD BILLIONS)   


TABLE 114. MEXICO MARKET SIZE ESTIMATES & FORECAST BY END USE INDUSTRY, 2019-2035 (USD BILLIONS)   


TABLE 115. MEXICO MARKET SIZE ESTIMATES & FORECAST BY FORM, 2019-2035 (USD BILLIONS)   


TABLE 116. MEXICO MARKET SIZE ESTIMATES & FORECAST BY REGIONAL, 2019-2035 (USD BILLIONS)   


TABLE 117. ARGENTINA GRAPHENE MARKET SIZE ESTIMATES & FORECAST BY APPLICATION, 2019-2035 (USD BILLIONS)   


TABLE 118. ARGENTINA MARKET SIZE ESTIMATES & FORECAST BY TYPE, 2019-2035 (USD BILLIONS)   


TABLE 119. ARGENTINA MARKET SIZE ESTIMATES & FORECAST BY END USE INDUSTRY, 2019-2035 (USD BILLIONS)   


TABLE 120. ARGENTINA MARKET SIZE ESTIMATES & FORECAST BY FORM, 2019-2035 (USD BILLIONS)   


TABLE 121. ARGENTINA MARKET SIZE ESTIMATES & FORECAST BY REGIONAL, 2019-2035 (USD BILLIONS)   


TABLE 122. REST OF SOUTH AMERICA MARKET SIZE ESTIMATES & FORECAST BY APPLICATION, 2019-2035 (USD BILLIONS)   


TABLE 123. REST OF SOUTH AMERICA GRAPHENE MARKET SIZE ESTIMATES & FORECAST BY TYPE, 2019-2035 (USD BILLIONS)   


TABLE 124. REST OF SOUTH AMERICA MARKET SIZE ESTIMATES & FORECAST BY END USE INDUSTRY, 2019-2035 (USD BILLIONS)   


TABLE 125. REST OF SOUTH AMERICA MARKET SIZE ESTIMATES & FORECAST BY FORM, 2019-2035 (USD BILLIONS)   


TABLE 126. REST OF SOUTH AMERICA MARKET SIZE ESTIMATES & FORECAST BY REGIONAL, 2019-2035 (USD BILLIONS)   


TABLE 127. MEA GRAPHENE MARKET SIZE ESTIMATES & FORECAST BY APPLICATION, 2019-2035 (USD BILLIONS)   


TABLE 128. MEA MARKET SIZE ESTIMATES & FORECAST BY TYPE, 2019-2035 (USD BILLIONS)   


TABLE 129. MEA MARKET SIZE ESTIMATES & FORECAST BY END USE INDUSTRY, 2019-2035 (USD BILLIONS)   


TABLE 130. MEA MARKET SIZE ESTIMATES & FORECAST BY FORM, 2019-2035 (USD BILLIONS)   


TABLE 131. MEA MARKET SIZE ESTIMATES & FORECAST BY REGIONAL, 2019-2035 (USD BILLIONS)   


TABLE 132. GCC COUNTRIES GRAPHENE MARKET SIZE ESTIMATES & FORECAST BY APPLICATION, 2019-2035 (USD BILLIONS)   


TABLE 133. GCC COUNTRIES MARKET SIZE ESTIMATES & FORECAST BY TYPE, 2019-2035 (USD BILLIONS)   


TABLE 134. GCC COUNTRIES MARKET SIZE ESTIMATES & FORECAST BY END USE INDUSTRY, 2019-2035 (USD BILLIONS)   


TABLE 135. GCC COUNTRIES MARKET SIZE ESTIMATES & FORECAST BY FORM, 2019-2035 (USD BILLIONS)   


TABLE 136. GCC COUNTRIES MARKET SIZE ESTIMATES & FORECAST BY REGIONAL, 2019-2035 (USD BILLIONS)   


TABLE 137. SOUTH AFRICA GRAPHENE MARKET SIZE ESTIMATES & FORECAST BY APPLICATION, 2019-2035 (USD BILLIONS)   


TABLE 138. SOUTH AFRICA MARKET SIZE ESTIMATES & FORECAST BY TYPE, 2019-2035 (USD BILLIONS)   


TABLE 139. SOUTH AFRICA MARKET SIZE ESTIMATES & FORECAST BY END USE INDUSTRY, 2019-2035 (USD BILLIONS)   


TABLE 140. SOUTH AFRICA MARKET SIZE ESTIMATES & FORECAST BY FORM, 2019-2035 (USD BILLIONS)   


TABLE 141. SOUTH AFRICA MARKET SIZE ESTIMATES & FORECAST BY REGIONAL, 2019-2035 (USD BILLIONS)   


TABLE 142. REST OF MEA GRAPHENE MARKET SIZE ESTIMATES & FORECAST BY APPLICATION, 2019-2035 (USD BILLIONS)   


TABLE 143. REST OF MEA MARKET SIZE ESTIMATES & FORECAST BY TYPE, 2019-2035 (USD BILLIONS)   


TABLE 144. REST OF MEA MARKET SIZE ESTIMATES & FORECAST BY END USE INDUSTRY, 2019-2035 (USD BILLIONS)   


TABLE 145. REST OF MEA MARKET SIZE ESTIMATES & FORECAST BY FORM, 2019-2035 (USD BILLIONS)   


TABLE 146. REST OF MEA MARKET SIZE ESTIMATES & FORECAST BY REGIONAL, 2019-2035 (USD BILLIONS)   


TABLE 147. PRODUCT LAUNCH/PRODUCT DEVELOPMENT/APPROVAL   


TABLE 148. ACQUISITION/PARTNERSHIP   


LIST OF FIGURES


FIGURE 1. MARKET SYNOPSIS 


FIGURE 2. NORTH GRAPHENE AMERICA MARKET ANALYSIS 


FIGURE 3. US GRAPHENE MARKET ANALYSIS BY APPLICATION 


FIGURE 4. US MARKET ANALYSIS BY TYPE 


FIGURE 5. US MARKET ANALYSIS BY END USE INDUSTRY 


FIGURE 6. US MARKET ANALYSIS BY FORM 


FIGURE 7. US MARKET ANALYSIS BY REGIONAL 


FIGURE 8. CANADA GRAPHENE MARKET ANALYSIS BY APPLICATION 


FIGURE 9. CANADA MARKET ANALYSIS BY TYPE 


FIGURE 10. CANADA MARKET ANALYSIS BY END USE INDUSTRY 


FIGURE 11. CANADA MARKET ANALYSIS BY FORM 


FIGURE 12. CANADA MARKET ANALYSIS BY REGIONAL 


FIGURE 13. EUROPE GRAPHENE MARKET ANALYSIS 


FIGURE 14. GERMANY MARKET ANALYSIS BY APPLICATION 


FIGURE 15. GERMANY MARKET ANALYSIS BY TYPE 


FIGURE 16. GERMANY MARKET ANALYSIS BY END USE INDUSTRY 


FIGURE 17. GERMANY MARKET ANALYSIS BY FORM 


FIGURE 18. GERMANY MARKET ANALYSIS BY REGIONAL 


FIGURE 19. UK GRAPHENE MARKET ANALYSIS BY APPLICATION 


FIGURE 20. UK MARKET ANALYSIS BY TYPE 


FIGURE 21. UK MARKET ANALYSIS BY END USE INDUSTRY 


FIGURE 22. UK MARKET ANALYSIS BY FORM 


FIGURE 23. UK MARKET ANALYSIS BY REGIONAL 


FIGURE 24. FRANCE GRAPHENE MARKET ANALYSIS BY APPLICATION 


FIGURE 25. FRANCE MARKET ANALYSIS BY TYPE 


FIGURE 26. FRANCE MARKET ANALYSIS BY END USE INDUSTRY 


FIGURE 27. FRANCE MARKET ANALYSIS BY FORM 


FIGURE 28. FRANCE MARKET ANALYSIS BY REGIONAL 


FIGURE 29. RUSSIA GRAPHENE MARKET ANALYSIS BY APPLICATION 


FIGURE 30. RUSSIA MARKET ANALYSIS BY TYPE 


FIGURE 31. RUSSIA MARKET ANALYSIS BY END USE INDUSTRY 


FIGURE 32. RUSSIA MARKET ANALYSIS BY FORM 


FIGURE 33. RUSSIA MARKET ANALYSIS BY REGIONAL 


FIGURE 34. ITALY GRAPHENE MARKET ANALYSIS BY APPLICATION 


FIGURE 35. ITALY MARKET ANALYSIS BY TYPE 


FIGURE 36. ITALY MARKET ANALYSIS BY END USE INDUSTRY 


FIGURE 37. ITALY MARKET ANALYSIS BY FORM 


FIGURE 38. ITALY MARKET ANALYSIS BY REGIONAL 


FIGURE 39. SPAIN GRAPHENE MARKET ANALYSIS BY APPLICATION 


FIGURE 40. SPAIN MARKET ANALYSIS BY TYPE 


FIGURE 41. SPAIN MARKET ANALYSIS BY END USE INDUSTRY 


FIGURE 42. SPAIN MARKET ANALYSIS BY FORM 


FIGURE 43. SPAIN MARKET ANALYSIS BY REGIONAL 


FIGURE 44. REST OF EUROPE GRAPHENE MARKET ANALYSIS BY APPLICATION 


FIGURE 45. REST OF EUROPE MARKET ANALYSIS BY TYPE 


FIGURE 46. REST OF EUROPE MARKET ANALYSIS BY END USE INDUSTRY 


FIGURE 47. REST OF EUROPE MARKET ANALYSIS BY FORM 


FIGURE 48. REST OF EUROPE MARKET ANALYSIS BY REGIONAL 


FIGURE 49. APAC GRAPHENE MARKET ANALYSIS 


FIGURE 50. CHINA GRAPHENE MARKET ANALYSIS BY APPLICATION 


FIGURE 51. CHINA MARKET ANALYSIS BY TYPE 


FIGURE 52. CHINA MARKET ANALYSIS BY END USE INDUSTRY 


FIGURE 53. CHINA MARKET ANALYSIS BY FORM 


FIGURE 54. CHINA MARKET ANALYSIS BY REGIONAL 


FIGURE 55. INDIA GRAPHENE MARKET ANALYSIS BY APPLICATION 


FIGURE 56. INDIA MARKET ANALYSIS BY TYPE 


FIGURE 57. INDIA MARKET ANALYSIS BY END USE INDUSTRY 


FIGURE 58. INDIA MARKET ANALYSIS BY FORM 


FIGURE 59. INDIA MARKET ANALYSIS BY REGIONAL 


FIGURE 60. JAPAN GRAPHENE MARKET ANALYSIS BY APPLICATION 


FIGURE 61. JAPAN MARKET ANALYSIS BY TYPE 


FIGURE 62. JAPAN MARKET ANALYSIS BY END USE INDUSTRY 


FIGURE 63. JAPAN MARKET ANALYSIS BY FORM 


FIGURE 64. JAPAN MARKET ANALYSIS BY REGIONAL 


FIGURE 65. SOUTH KOREA GRAPHENE MARKET ANALYSIS BY APPLICATION 


FIGURE 66. SOUTH KOREA MARKET ANALYSIS BY TYPE 


FIGURE 67. SOUTH KOREA MARKET ANALYSIS BY END USE INDUSTRY 


FIGURE 68. SOUTH KOREA MARKET ANALYSIS BY FORM 


FIGURE 69. SOUTH KOREA MARKET ANALYSIS BY REGIONAL 


FIGURE 70. MALAYSIA GRAPHENE MARKET ANALYSIS BY APPLICATION 


FIGURE 71. MALAYSIA MARKET ANALYSIS BY TYPE 


FIGURE 72. MALAYSIA MARKET ANALYSIS BY END USE INDUSTRY 


FIGURE 73. MALAYSIA MARKET ANALYSIS BY FORM 


FIGURE 74. MALAYSIA MARKET ANALYSIS BY REGIONAL 


FIGURE 75. THAILAND GRAPHENE MARKET ANALYSIS BY APPLICATION 


FIGURE 76. THAILAND MARKET ANALYSIS BY TYPE 


FIGURE 77. THAILAND MARKET ANALYSIS BY END USE INDUSTRY 


FIGURE 78. THAILAND MARKET ANALYSIS BY FORM 


FIGURE 79. THAILAND MARKET ANALYSIS BY REGIONAL 


FIGURE 80. INDONESIA GRAPHENE MARKET ANALYSIS BY APPLICATION 


FIGURE 81. INDONESIA MARKET ANALYSIS BY TYPE 


FIGURE 82. INDONESIA MARKET ANALYSIS BY END USE INDUSTRY 


FIGURE 83. INDONESIA MARKET ANALYSIS BY FORM 


FIGURE 84. INDONESIA MARKET ANALYSIS BY REGIONAL 


FIGURE 85. REST OF APAC GRAPHENE MARKET ANALYSIS BY APPLICATION 


FIGURE 86. REST OF APAC MARKET ANALYSIS BY TYPE 


FIGURE 87. REST OF APAC MARKET ANALYSIS BY END USE INDUSTRY 


FIGURE 88. REST OF APAC MARKET ANALYSIS BY FORM 


FIGURE 89. REST OF APAC MARKET ANALYSIS BY REGIONAL 


FIGURE 90. SOUTH AMERICA GRAPHENE MARKET ANALYSIS 


FIGURE 91. BRAZIL GRAPHENE MARKET ANALYSIS BY APPLICATION 


FIGURE 92. BRAZIL MARKET ANALYSIS BY TYPE 


FIGURE 93. BRAZIL MARKET ANALYSIS BY END USE INDUSTRY 


FIGURE 94. BRAZIL MARKET ANALYSIS BY FORM 


FIGURE 95. BRAZIL MARKET ANALYSIS BY REGIONAL 


FIGURE 96. MEXICO GRAPHENE MARKET ANALYSIS BY APPLICATION 


FIGURE 97. MEXICO MARKET ANALYSIS BY TYPE 


FIGURE 98. MEXICO MARKET ANALYSIS BY END USE INDUSTRY 


FIGURE 99. MEXICO MARKET ANALYSIS BY FORM 


FIGURE 100. MEXICO MARKET ANALYSIS BY REGIONAL 


FIGURE 101. ARGENTINA GRAPHENE MARKET ANALYSIS BY APPLICATION 


FIGURE 102. ARGENTINA MARKET ANALYSIS BY TYPE 


FIGURE 103. ARGENTINA MARKET ANALYSIS BY END USE INDUSTRY 


FIGURE 104. ARGENTINA MARKET ANALYSIS BY FORM 


FIGURE 105. ARGENTINA MARKET ANALYSIS BY REGIONAL 


FIGURE 106. REST OF SOUTH AMERICA GRAPHENE MARKET ANALYSIS BY APPLICATION 


FIGURE 107. REST OF SOUTH AMERICA MARKET ANALYSIS BY TYPE 


FIGURE 108. REST OF SOUTH AMERICA MARKET ANALYSIS BY END USE INDUSTRY 


FIGURE 109. REST OF SOUTH AMERICA MARKET ANALYSIS BY FORM 


FIGURE 110. REST OF SOUTH AMERICA MARKET ANALYSIS BY REGIONAL 


FIGURE 111. MEA GRAPHENE MARKET ANALYSIS 


FIGURE 112. GCC COUNTRIES GRAPHENE MARKET ANALYSIS BY APPLICATION 


FIGURE 113. GCC COUNTRIES MARKET ANALYSIS BY TYPE 


FIGURE 114. GCC COUNTRIES MARKET ANALYSIS BY END USE INDUSTRY 


FIGURE 115. GCC COUNTRIES MARKET ANALYSIS BY FORM 


FIGURE 116. GCC COUNTRIES MARKET ANALYSIS BY REGIONAL 


FIGURE 117. SOUTH AFRICA GRAPHENE MARKET ANALYSIS BY APPLICATION 


FIGURE 118. SOUTH AFRICA MARKET ANALYSIS BY TYPE 


FIGURE 119. SOUTH AFRICA MARKET ANALYSIS BY END USE INDUSTRY 


FIGURE 120. SOUTH AFRICA MARKET ANALYSIS BY FORM 


FIGURE 121. SOUTH AFRICA MARKET ANALYSIS BY REGIONAL 


FIGURE 122. REST OF MEA GRAPHENE MARKET ANALYSIS BY APPLICATION 


FIGURE 123. REST OF MEA MARKET ANALYSIS BY TYPE 


FIGURE 124. REST OF MEA MARKET ANALYSIS BY END USE INDUSTRY 


FIGURE 125. REST OF MEA MARKET ANALYSIS BY FORM 


FIGURE 126. REST OF MEA MARKET ANALYSIS BY REGIONAL 


FIGURE 127. KEY BUYING CRITERIA OF GRAPHENE MARKET 


FIGURE 128. RESEARCH PROCESS OF MRFR 


FIGURE 129. DRO ANALYSIS OF GRAPHENE MARKET 


FIGURE 130. DRIVERS IMPACT ANALYSIS: GRAPHENE MARKET 


FIGURE 131. RESTRAINTS IMPACT ANALYSIS: GRAPHENE MARKET 


FIGURE 132. SUPPLY / VALUE CHAIN: GRAPHENE MARKET 


FIGURE 133. MARKET BY APPLICATION, 2025 (% SHARE) 


FIGURE 134. MARKET BY APPLICATION, 2019 TO 2035 (USD Billions) 


FIGURE 135. MARKET BY TYPE, 2025 (% SHARE) 


FIGURE 136. MARKET BY TYPE, 2019 TO 2035 (USD Billions) 


FIGURE 137. MARKET BY END USE INDUSTRY, 2025 (% SHARE) 


FIGURE 138. MARKET BY END USE INDUSTRY, 2019 TO 2035 (USD Billions) 


FIGURE 139. MARKET BY FORM, 2025 (% SHARE) 


FIGURE 140. MARKET BY FORM, 2019 TO 2035 (USD Billions) 


FIGURE 141. MARKET BY REGIONAL, 2025 (% SHARE) 


FIGURE 142. MARKET BY REGIONAL, 2019 TO 2035 (USD Billions) 


FIGURE 143. BENCHMARKING OF MAJOR COMPETITORS 


Leading companies partner with us for data-driven Insights.

clients

Kindly complete the form below to receive a free sample of this Report

We do not share your information with anyone. However, we may send you emails based on your report interest from time to time. You may contact us at any time to opt-out.

Tailored for You
  • Dedicated Research on any specifics segment or region.
  • Focused Research on specific players in the market.
  • Custom Report based only on your requirements.
  • Flexibility to add or subtract any chapter in the study.
  • Historic data from 2014 and forecasts outlook till 2040.
  • Flexibility of providing data/insights in formats (PDF, PPT, Excel).
  • Provide cross segmentation in applicable scenario/markets.
report-img