• Cat-intel
  • MedIntelliX
  • Resources
  • About Us
  • Hero Background
    English
    Chinese
    French
    Japanese
    Korean
    German
    Spanish

    Asia Pacific Butyric Acid Market Size

    ID: MRFR/CnM/11166-HCR
    128 Pages
    Anshula Mandaokar
    October 2025

    Asia Pacific Butyric Acid Market Research Report Information By Type (Renewable Butyric Acid, Natural Butyric Acid, and Synthetic Butyric Acid), By Derivatives (Sodium Butyrate, Calcium Butyrate, and Others), By Application (Animal Feed, Chemical Intermediate, Food and Flavors, Pharmaceuticals, Perfumes, Inks, Paints and Coatings, Human Dietary Supplements, and Others) – and Asia Pacific Market...

    Share:
    Download PDF ×

    We do not share your information with anyone. However, we may send you emails based on your report interest from time to time. You may contact us at any time to opt-out.

    Asia Pacific Butyric Acid Market Infographic
    $ 4,950.0
    $ 5,950.0
    $ 7,250.0

    Asia Pacific Butyric Acid Size

    Asia Pacific Butyric Acid Market Growth Projections and Opportunities

    The Asia-Pacific Butyric Acid Market is a dynamic market with many factors that affect its dynamics. The main market driver for this market is the increasing demand for butyric acid across different industries in the region. Moreover, a steady increase in demand has been a result of the food sector using it as a flavoring agent and preservative, as well as as an animal feed additive, among others. In addition, increased population and rising per capita incomes in many Asia-Pacific countries have led to an increase in the consumption of processed foods that need butyric acid. Another driving force is that people are becoming increasingly health conscious while knowing that this compound has health benefits such as antimicrobial and anti-inflammatory abilities. The Asia-Pacific Butyric Acid Market is influenced by regulatory factors apart from being driven by forces of demand. Moreover, strict regulations concerning food safety standards push manufacturers to use butyric acid to preserve food safely. Consequently, firms strive towards meeting these regulations, resulting in their growth and propelling the entire market forward with high-quality products that can meet growing consumer demands. At the same time, competition on the Asian continent, along with key players' presence, shapes the landscape of this regional industry, otherwise known as the Asia Pacific Butyric Acid Market. There are numerous big makers and sellers of butyric acid within this area, making it quite competitive. Companies focus more on research; hence, they are able to introduce new products through innovation, thus improving their positions within the markets where they operate. This nature promotes technological advancements regarding cost efficiency and product quality during production processes. Economic factors also have an impact on how markets behave. The economic growth, together with industrialization in countries around Asia-Pacific region, significantly influences how butyric acid is consumed within them directly or indirectly. On a global scale, environmental concern has become another factor influencing purchasing decisions made by buyers within the Asian-Pacific Butyric Acid Marketspace. In relation to this development globally, there has been a growing demand for bio-based butyric acid as the world shifts to eco-friendly alternatives. Moreover, geopolitical factors and trade policies also affect the market dynamics of this product. Given that Asia-Pacific area has close economic connections with other world markets, the import-export of butyric acid is greatly affected by them, thereby affecting the entire supply chain and prices in the market. The market growth direction may change because of situations like recent changes in international trading agreements or geopolitical events.
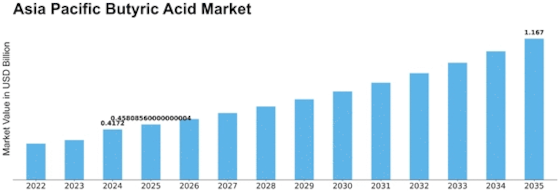
    Asia Pacific Butyric Acid Market Size Graph

    Market Summary

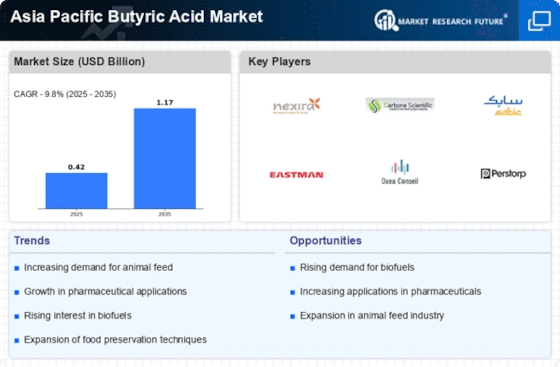
    The Asia Pacific Butyric Acid market is projected to grow from 0.42 USD Million in 2024 to 1.17 USD Million by 2035, reflecting a robust growth trajectory.

    Key Market Trends & Highlights

    Asia Pacific Butyric Acid Key Trends and Highlights

    • The market is expected to experience a compound annual growth rate (CAGR) of 7.43% from 2025 to 2035.
    • By 2035, the market valuation is anticipated to reach 550 USD Million, indicating strong demand for butyric acid.
    • in 2024, the market is valued at 0.42 USD Million, showcasing a solid foundation for future growth.
    • Growing adoption of butyric acid in the food and feed industry due to its health benefits is a major market driver.

    Market Size & Forecast

    2024 Market Size 0.42 (USD Million)
    2035 Market Size 1.17 (USD Million)
    CAGR (2025 - 2035) 9.80%
    Largest Regional Market Share in 2024 -)

    Major Players

    Apple Inc (US), Microsoft Corp (US), Amazon.com Inc (US), Alphabet Inc (US), Berkshire Hathaway Inc (US), Tesla Inc (US), Meta Platforms Inc (US), Johnson & Johnson (US), Visa Inc (US), Procter & Gamble Co (US)

    Market Trends

    Increasing demand from animal feed to accelerate market growth

    Animal feed ingredients containing butyric acid are becoming more and more popular. The main ingredient in many butyrate salts and glycerine esters, or "butyrins," is butyric acid. To direct the active component to the intended organs in the animal's intestine, salts are added to feed premixes in administrative forms that are either fat-coated or non-coated. Additionally, derivatives of butyric acid are employed as feed additives in the cattle, poultry, and aquaculture industries. Animals require butyric acid to help them satisfy their nutritional needs, and it is an essential component of animal nutrition.

    Butyric acid is an advantageous ingredient for the animal feed business because it is required to give animals the correct kind of meal that will offer them with nutrients. Products containing butyric acid contribute to the well-being, appropriate nutrition, and effective rearing of animals. However, butyric acid is being used more frequently in animal feed in a number of regional markets as a result of the rising rates of animal diseases. Comparatively speaking to industrialized regions like Europe and North America, Asia still has very low meat consumption per person.

    Still, the region's meat consumption is going to skyrocket as a result of urbanization and rising wages. Demand for animal products is high because of the growing income of the relatively new middle class in most of Asia.

    Pharmaceutical companies have the potential to employ butyric acid as a treatment for a variety of diseases, including inflammatory bowel disease, cancer, and genetic problems. However, as this field of research advances, butyric acid might find new uses in the development of medications and treatments. Butyric acid's anti-inflammatory qualities make it an effective treatment for inflammatory bowel disease (IBD) diseases such ulcerative colitis and Crohn's disease. Moreover, butyric acid has the potential to promote intestinal epithelial cell proliferation and repair, hence mitigating the symptoms of IBD.

    Furthermore, as this area of research advances, butyric acid might offer fresh chances for the development of novel drugs and cures for a range of illnesses. Thus, driving the butyric acid market revenue.

    The Asia Pacific Butyric Acid Market is poised for growth as increasing demand from the food and feed industries drives innovation and production efficiencies.

    Food and Agriculture Organization (FAO)

    Asia Pacific Butyric Acid Market Market Drivers

    Market Trends and Projections

    Increasing Awareness of Gut Health

    The Global Asia Pacific Butyric Acid Market Industry is significantly influenced by the increasing awareness of gut health among consumers. As research highlights the importance of gut microbiota in overall health, the demand for products containing butyric acid is expected to rise. This trend is particularly evident in dietary supplements and functional foods, where butyric acid is marketed for its health benefits. The growing consumer interest in preventive healthcare suggests a promising outlook for the market, as individuals seek to enhance their well-being through dietary choices.

    Rising Demand for Animal Feed Additives

    The Global Asia Pacific Butyric Acid Market Industry experiences a notable surge in demand for animal feed additives, driven by the increasing need for high-quality livestock products. Butyric acid is recognized for its beneficial effects on gut health and growth performance in animals. As livestock production intensifies, particularly in countries like China and India, the market is projected to reach 250 USD Million in 2024. This growth is indicative of the industry's response to the rising protein consumption in the region, suggesting a robust future for butyric acid as a key ingredient in animal nutrition.

    Expansion of Pharmaceutical Applications

    The Global Asia Pacific Butyric Acid Market Industry is witnessing an expansion in pharmaceutical applications, particularly in the development of therapeutic agents for gastrointestinal disorders. Butyric acid's anti-inflammatory properties and its role in promoting gut health are increasingly recognized in medical research. This trend is likely to contribute to the market's growth, as pharmaceutical companies invest in butyric acid-based formulations. The projected market value of 550 USD Million by 2035 reflects the potential of this segment, indicating a shift towards innovative healthcare solutions that leverage the benefits of butyric acid.

    Technological Advancements in Production

    Technological advancements in the production of butyric acid are playing a crucial role in shaping the Global Asia Pacific Butyric Acid Market Industry. Innovations in fermentation technology and bioprocessing are leading to more efficient and sustainable production methods. These advancements not only reduce production costs but also enhance the quality of the final product. As manufacturers adopt these technologies, the market is likely to experience increased competitiveness and growth. The anticipated CAGR of 7.43% from 2025 to 2035 underscores the potential for technological innovations to drive market expansion.

    Growth in Personal Care and Cosmetics Sector

    The Global Asia Pacific Butyric Acid Market Industry is also benefiting from the growth in the personal care and cosmetics sector. Butyric acid is utilized in various formulations for its moisturizing and skin-conditioning properties. As consumer preferences shift towards natural and organic ingredients, the demand for butyric acid in cosmetics is likely to rise. This trend aligns with the broader movement towards sustainability in the beauty industry, suggesting that the market could see substantial growth in the coming years. The increasing focus on clean beauty products may further enhance the market's appeal.

    Market Segment Insights

    Butyric Acid Type Insights

    The Asia Pacific Butyric Acid market segmentation, based on type includes Renewable Butyric Acid, Natural Butyric Acid, and Synthetic Butyric Acid. The renewable butyric acid category led the market in 2022 The factors can be attributed to the expansion in the use of synthetic butyric acid in APAC countries and its widespread appeal as a raw material because of its low cost and efficient fermentation process.

    Butyric Acid Derivatives Insights

    The Asia Pacific Butyric Acid market segmentation, based on derivatives, includes Sodium Butyrate, Calcium Butyrate, and Others. The calcium butyrate category generated the most income. In order to enhance animal performance and support gut health, the animal feed industry frequently uses calcium butyrate, a derivative of butyric acid. It is classified as a butyric acid derivative in the butyric acid market, particularly those that are utilized for the health and feeding of animals.

    Figure 1: Asia Pacific Butyric Acid Market, by Derivatives, 2022 & 2032 (USD Billion)

    Source: Secondary Research, Primary Research, Market Research Future Database and Analyst Review

    Butyric Acid Application Insights

    The Asia Pacific Butyric Acid market segmentation, based on application, includes Animal Feed, Chemical Intermediate, Food and Flavors, Pharmaceuticals, Perfumes, Inks, Paints and Coatings, Human Dietary Supplements, and Others. The animal feed category generated the most income due to the rise in infectious animal diseases. Broiler chickens are protected against salmonella enteritidis illness by a feed additive based on butyric acid. Furthermore, butyric acid helps to enhance intestinal health and function in chickens and pigs. Thus, there is a huge market for butyric acid in the animal feed sector.

    Get more detailed insights about Asia Pacific Butyric Acid Market Research Report—Forecast till 2034

    Regional Insights

    The highly developed healthcare system in China, together with ongoing investments made in the region over the years to improve the food processing and chemical sectors, are likely to drive the Asia-Pacific region's growth throughout the forecast period. Animal consumption of butyric acid has increased dramatically in recent years. It supports the growth and digestive health of animals, particularly young and delicate ones. The Chinese pharmaceutical industry has seen the fastest growth rates over the past few years, according to the IQVIA Institute for Human Data Science.

    China's pharmaceutical business brought in over CNY 3.3 trillion (USD 487.5 billion) in sales in 2021, an over 20 percent increase from the previous year.

    Figure 2: ASIA PACIFIC BUTYRIC ACID MARKET SHARE BY REGION 2022 (USD Billion)

    ASIA PACIFIC BUTYRIC ACID MARKET SHARE BY REGION 2022

    Source: Secondary Research, Primary Research, Market Research Future Database and Analyst Review

    Key Players and Competitive Insights

    Leading market players are investing heavily in research and development in order to expand their product lines, which will help the butyric acid market, grow even more. Market participants are also undertaking a variety of strategic activities to expand their  footprint, with important market developments including new product launches, contractual agreements, mergers and acquisitions, higher investments, and collaboration with other organizations. To expand and survive in a more competitive and rising market climate, butyric acid industry must offer cost-effective items.

    Key Companies in the Asia Pacific Butyric Acid Market market include

    Industry Developments

    Future Outlook

    Asia Pacific Butyric Acid Market Future Outlook

    The Asia Pacific Butyric Acid Market is projected to grow at a 9.80% CAGR from 2025 to 2035, driven by rising demand in food and pharmaceuticals.

    New opportunities lie in:

    • Develop innovative butyric acid derivatives for enhanced agricultural applications.
    • Expand production capabilities to meet increasing demand in nutraceuticals.
    • Leverage sustainable sourcing strategies to attract eco-conscious consumers.

    By 2035, the Asia Pacific Butyric Acid Market is expected to achieve substantial growth, solidifying its competitive landscape.

    Market Segmentation

    Butyric Acid Type Outlook

    • Renewable Butyric Acid
    • Natural Butyric Acid
    • Synthetic Butyric Acid

    Butyric Acid Regional Outlook

    Asia-Pacific
    • China
    • Japan
    • India
    • Australia
    • South Korea
    • Indonesia
    • Thailand
    • Vietnam
    • Malaysia
    • Singapore
    • Rest of Asia-Pacific

    Butyric Acid Application Outlook

    • Animal Feed
    • Chemical Intermediate
    • Food and Flavors
    • Pharmaceuticals
    • Perfumes
    • Inks
    • Paints and Coatings
    • Human Dietary Supplements
    • Others

    Butyric Acid Derivatives Outlook

    • Sodium Butyrate
    • Calcium Butyrate
    • Others

    Report Scope

    Report Attribute/Metric Details
    Market Size 2024 USD 0.42 Billion
    Market Size 2025 USD 0.46 Billion
    Market Size 2035 1.17 (Value (USD Billion))
    Compound Annual Growth Rate (CAGR) 9.80% (2025 - 2035)
    Base Year 2024
    Market Forecast Period 2025 - 2035
    Historical Data 2020- 2024
    Market Forecast Units Value (USD Billion)
    Report Coverage Revenue Forecast, Market Competitive Landscape, Growth Factors, and Trends
    Segments Covered Type, Derivatives, Application, and Region
    Region Covered Asia Pacific
    Countries Covered China, Japan, India, Australia, South Korea, Indonesia, Thailand, Vietnam, Malaysia, Singapore, and Rest of Asia-Pacific
    Key Companies Profiled Eastman Chemical Company (U.S.), Perstorp (Sweden), Oxea GmbH  (Germany), Zhonglan Industry Co., Ltd. (China), Tokyo Chemical Industry Co., Ltd. (Japan), Alfa Aesar (U.S.), Jinan Haohua Industry Co., Ltd.(China), Solvay (Belgium), Celanese Corporation (U.S.), Thermo Fisher Scientific Inc. (U.S.), Aldon Corporation (U.S.)
    Key Market Opportunities ·       Producing biofuels and bioplastics propels the industry
    Key Market Dynamics ·       Food and beverage sector leads to market expansion ·       Anti-inflammatory qualities lead to market expansion

    Market Highlights

    Author

    Anshula Mandaokar
    Team Lead - Research

    She holds an experience of about 6+ years in market research and business consulting, working under the spectrum of information communication technology, telecommunications and semiconductor domains. aarti conceptualizes and implements a scalable business strategy and provides strategic leadership to the clients. her expertise lies in market estimation, competitive intelligence, pipeline analysis, customer assessment, etc.

    Leave a Comment

    Latest Comments

    John Doe
    john@example.com

    This is a great article! Really helped me understand the topic better.

    Posted on July 23, 2025, 10:15 AM
    Jane Smith
    jane@domain.com

    Thanks for sharing this. I’ve bookmarked it for later reference.

    Posted on July 22, 2025, 7:45 PM

    FAQs

    How much is the butyric acid market?

    The Asia Pacific Butyric Acid market size was valued at USD 0.42 Billion in 2024.

    What is the growth rate of the butyric acid market?

    Asia Pacific Butyric Acid Market is projected to register a CAGR of 9.8% from 2025-2035

    Who are the key players in the butyric acid market?

    The key players in the market are Eastman Chemical Company (U.S.), Perstorp (Sweden), Oxea GmbH (Germany), Zhonglan Industry Co., Ltd. (China), Tokyo Chemical Industry Co., Ltd. (Japan), Alfa Aesar (U.S.), Jinan Haohua Industry Co., Ltd.(China), Solvay (Belgium), Celanese Corporation (U.S.), Thermo Fisher Scientific Inc. (U.S.), Aldon Corporation (U.S.).

    Which type led the butyric acid market?

    The renewable butyric acid category dominated the market in 2022.

    Which application had the largest market share in the butyric acid market?

    The animal feed category had the largest share in the market.

    1. Table of Contents
    2. Executive Summary
    3. Market Introduction
      1. Definition
      2. Scope of the Study
        1. Research Objective
        2. Assumptions
        3. Limitations
    4. Research Methodology
      1. Overview
      2. Data Mining
      3. Secondary Research
      4. Primary Research
        1. Primary Interviews and Information Gathering Process
        2. Breakdown of Primary Respondents
      5. Forecasting Modality
      6. Market Size Estimation
        1. Bottom-up Approach
        2. Top-Down Approach
      7. Data Triangulation
      8. Validation
    5. MARKET DYNAMICS
      1. Overview
      2. Drivers
      3. Restraints
      4. Opportunities
    6. MARKET FACTOR ANALYSIS
      1. Value Chain Analysis
      2. Porter’s Five Forces Analysis
        1. Bargaining Power of Suppliers
        2. Bargaining Power of Buyers
        3. Threat of New Entrants
        4. Threat of Substitutes
        5. Intensity of Rivalry
      3. COVID-19 Impact Analysis
        1. Market Impact Analysis
        2. Regional Impact
        3. Opportunity and Threat Analysis
    7. ASIA PACIFIC POLYLACTIC ACID [PLA] PACKAGING MARKET, BY TYPE
      1. Overview
      2. Racemic PLLA (Poly-l-lactic acid)
      3. PDLA (Poly-d-lactic acid)
      4. Regular PLLA (Poly-l-lactic acid)
      5. PDLLA (Poly-dl-lactic acid)
      6. PLA Blends
    8. ASIA PACIFIC POLYLACTIC ACID [PLA] PACKAGING MARKET, BY RAW MATERIAL
      1. Overview
      2. Sugarcane
      3. Corn
      4. Cassava
      5. Sugar Beet
      6. Others
    9. ASIA PACIFIC POLYLACTIC ACID [PLA] PACKAGING MARKET, BY FORM
      1. Overview
      2. Films and Sheets
      3. Coatings
      4. Fibre
      5. Others
    10. ASIA PACIFIC POLYLACTIC ACID [PLA] PACKAGING MARKET, BY APPLICATION
      1. Overview
      2. Packaging
      3. Transport
      4. Agriculture
      5. Medical
      6. Electronics
      7. Textile
      8. Hygiene
      9. Others
    11. ASIA PACIFIC POLYLACTIC ACID [PLA] PACKAGING MARKET, BY END USER
      1. Overview
      2. Plastic Films
      3. Bottles
      4. Biodegradable Medical Devices
    12. ASIA PACIFIC POLYLACTIC ACID [PLA] PACKAGING MARKET, BY REGION
      1. Overview
      2. Asia-Pacific
    13. - China
    14. - Japan
    15. - India
    16. - Australia
    17. - South Korea
    18. - Indonesia
    19. - Thailand
    20. - Vietnam
    21. - Malaysia
    22. - Singapore
    23. - Rest of Asia-Pacific
    24. Competitive Landscape
      1. Overview
      2. Competitive Analysis
      3. Market Share Analysis
      4. Major Growth Strategy in the Asia Pacific Polylactic Acid [PLA] Packaging Market,
      5. Competitive Benchmarking
      6. Leading Players in Terms of Number of Developments in the Asia Pacific Polylactic Acid [PLA] Packaging Market,
      7. Key developments and Growth Strategies
        1. New Product Launch/Service Deployment
        2. Merger & Acquisitions
        3. Joint Ventures
      8. Major Players Financial Matrix
        1. Sales & Operating Income, 2022
        2. Major Players R&D Expenditure. 2022
    25. COMPANY PROFILES
      1. BASF SE
        1. Company Overview
        2. Financial Overview
        3. Products Offered
        4. Key Developments
        5. SWOT Analysis
        6. Key Strategies
      2. FUTERRO
        1. Company Overview
        2. Financial Overview
        3. Products Offered
        4. Key Developments
        5. SWOT Analysis
        6. Key Strategies
      3. NATUREWORKS LLC
        1. Company Overview
        2. Financial Overview
        3. Products Offered
        4. Key Developments
        5. SWOT Analysis
        6. Key Strategies
      4. TOTALENERGIES CORBION
        1. Company Overview
        2. Financial Overview
        3. Products Offered
        4. Key Developments
        5. SWOT Analysis
        6. Key Strategies
      5. SULZER LTD
        1. Company Overview
        2. Financial Overview
        3. Products Offered
        4. Key Developments
        5. SWOT Analysis
        6. Key Strategies
      6. MITSUBISHI CHEMICAL CORPORATION
        1. Company Overview
        2. Financial Overview
        3. Products Offered
        4. Key Developments
        5. SWOT Analysis
        6. Key Strategies
      7. TORAY INDUSTRIES, INC..
        1. Company Overview
        2. Financial Overview
        3. Products Offered
        4. Key Developments
        5. SWOT Analysis
        6. Key Strategies
      8. MERCK KGAA
        1. Company Overview
        2. Financial Overview
        3. Products Offered
        4. Key Developments
        5. SWOT Analysis
        6. Key Strategies
      9. TIGERNIX PTE. LTD.
        1. Company Overview
        2. Financial Overview
        3. Products Offered
        4. Key Developments
        5. SWOT Analysis
        6. Key Strategies
      10. EVONIK INDUSTRIES AG
        1. Company Overview
        2. Financial Overview
        3. Products Offered
        4. Key Developments
        5. SWOT Analysis
        6. Key Strategies
      11. UNITIKA LTD
        1. Company Overview
        2. Financial Overview
        3. Products Offered
        4. Key Developments
        5. SWOT Analysis
        6. Key Strategies
      12. UNITIKA LTD
        1. Company Overview
        2. Financial Overview
        3. Products Offered
        4. Key Developments
        5. SWOT Analysis
        6. Key Strategies
      13. Jiangxi Academy of Sciences Biological New Materials Co., Ltd
        1. Company Overview
        2. Financial Overview
        3. Products Offered
        4. Key Developments
        5. SWOT Analysis
        6. Key Strategies
      14. Shanghai Tong-jie-liang Biomaterials Co., Ltd
        1. Company Overview
        2. Financial Overview
        3. Products Offered
        4. Key Developments
        5. SWOT Analysis
        6. Key Strategies
      15. Zhejiang Hisun Biomaterials Co., Ltd
        1. Company Overview
        2. Financial Overview
        3. Products Offered
        4. Key Developments
        5. SWOT Analysis
        6. Key Strategies
      16. Radici Partecipazioni SpA
        1. Company Overview
        2. Financial Overview
        3. Products Offered
        4. Key Developments
        5. SWOT Analysis
        6. Key Strategies
    26. APPENDIX
      1. References
      2. Related Reports
    27. List of Tables and Figures
      1. LIST OF TABLES
      2. TABLE 1 ASIA PACIFIC POLYLACTIC ACID [PLA] PACKAGING MARKET, SYNOPSIS, 2025-2034
      3. TABLE 2 ASIA PACIFIC POLYLACTIC ACID [PLA] PACKAGING MARKET, ESTIMATES & FORECAST, 2025-2034 (USD BILLION)
      4. TABLE 3 ASIA PACIFIC POLYLACTIC ACID [PLA] PACKAGING MARKET, BY TYPE, 2025-2034 (USD BILLION)
      5. TABLE 4 ASIA PACIFIC POLYLACTIC ACID [PLA] PACKAGING MARKET, BY RAW MATERIAL, 2025-2034 (USD BILLION)
      6. TABLE 5 ASIA PACIFIC POLYLACTIC ACID [PLA] PACKAGING MARKET, BY FORM, 2025-2034 (USD BILLION)
      7. TABLE 6 ASIA PACIFIC POLYLACTIC ACID [PLA] PACKAGING MARKET, BY APPLICATION, 2025-2034 (USD BILLION)
      8. TABLE 7 ASIA PACIFIC POLYLACTIC ACID [PLA] PACKAGING MARKET, BY END USER, 2025-2034 (USD BILLION)
      9. TABLE 8 CHINA POLYLACTIC ACID [PLA] PACKAGING MARKET, BY TYPE, 2025-2034 (USD BILLION)
      10. TABLE 9 CHINA POLYLACTIC ACID [PLA] PACKAGING MARKET, BY RAW MATERIAL, 2025-2034 (USD BILLION)
      11. TABLE 10 CHINA POLYLACTIC ACID [PLA] PACKAGING MARKET, BY FORM, 2025-2034 (USD BILLION)
      12. TABLE 11 CHINA POLYLACTIC ACID [PLA] PACKAGING MARKET, BY APPLICATION, 2025-2034 (USD BILLION)
      13. TABLE 12 CHINA POLYLACTIC ACID [PLA] PACKAGING MARKET, BY END USER, 2025-2034 (USD BILLION)
      14. TABLE 13 JAPAN POLYLACTIC ACID [PLA] PACKAGING MARKET, BY TYPE, 2025-2034 (USD BILLION)
      15. TABLE 14 JAPAN POLYLACTIC ACID [PLA] PACKAGING MARKET, BY RAW MATERIAL, 2025-2034 (USD BILLION)
      16. TABLE 15 JAPAN POLYLACTIC ACID [PLA] PACKAGING MARKET, BY FORM, 2025-2034 (USD BILLION)
      17. TABLE 16 JAPAN POLYLACTIC ACID [PLA] PACKAGING MARKET, BY APPLICATION, 2025-2034 (USD BILLION)
      18. TABLE 17 JAPAN POLYLACTIC ACID [PLA] PACKAGING MARKET, BY END USER, 2025-2034 (USD BILLION)
      19. TABLE 18 INDIA POLYLACTIC ACID [PLA] PACKAGING MARKET, BY TYPE, 2025-2034 (USD BILLION)
      20. TABLE 19 INDIA POLYLACTIC ACID [PLA] PACKAGING MARKET, BY RAW MATERIAL, 2025-2034 (USD BILLION)
      21. TABLE 20 INDIA POLYLACTIC ACID [PLA] PACKAGING MARKET, BY FORM, 2025-2034 (USD BILLION)
      22. TABLE 21 INDIA POLYLACTIC ACID [PLA] PACKAGING MARKET, BY APPLICATION, 2025-2034 (USD BILLION)
      23. TABLE 22 INDIA POLYLACTIC ACID [PLA] PACKAGING MARKET, BY END USER, 2025-2034 (USD BILLION)
      24. TABLE 23 AUSTRALIA POLYLACTIC ACID [PLA] PACKAGING MARKET, BY TYPE, 2025-2034 (USD BILLION)
      25. TABLE 24 AUSTRALIA POLYLACTIC ACID [PLA] PACKAGING MARKET, BY RAW MATERIAL, 2025-2034 (USD BILLION)
      26. TABLE 25 AUSTRALIA POLYLACTIC ACID [PLA] PACKAGING MARKET, BY FORM, 2025-2034 (USD BILLION)
      27. TABLE 26 AUSTRALIA POLYLACTIC ACID [PLA] PACKAGING MARKET, BY APPLICATION, 2025-2034 (USD BILLION)
      28. TABLE 27 AUSTRALIA POLYLACTIC ACID [PLA] PACKAGING MARKET, BY END USER, 2025-2034 (USD BILLION)
      29. TABLE 28 SOUTH KOREA POLYLACTIC ACID [PLA] PACKAGING MARKET, BY TYPE, 2025-2034 (USD BILLION)
      30. TABLE 29 SOUTH KOREA POLYLACTIC ACID [PLA] PACKAGING MARKET, BY RAW MATERIAL, 2025-2034 (USD BILLION)
      31. TABLE 30 SOUTH KOREA POLYLACTIC ACID [PLA] PACKAGING MARKET, BY FORM, 2025-2034 (USD BILLION)
      32. TABLE 31 SOUTH KOREA POLYLACTIC ACID [PLA] PACKAGING MARKET, BY APPLICATION, 2025-2034 (USD BILLION)
      33. TABLE 32 SOUTH KOREA POLYLACTIC ACID [PLA] PACKAGING MARKET, BY END USER, 2025-2034 (USD BILLION)
      34. TABLE 33 INDONESIA POLYLACTIC ACID [PLA] PACKAGING MARKET, BY TYPE, 2025-2034 (USD BILLION)
      35. TABLE 34 INDONESIA POLYLACTIC ACID [PLA] PACKAGING MARKET, BY RAW MATERIAL, 2025-2034 (USD BILLION)
      36. TABLE 35 INDONESIA POLYLACTIC ACID [PLA] PACKAGING MARKET, BY FORM, 2025-2034 (USD BILLION)
      37. TABLE 36 INDONESIA POLYLACTIC ACID [PLA] PACKAGING MARKET, BY APPLICATION, 2025-2034 (USD BILLION)
      38. TABLE 37 INDONESIA POLYLACTIC ACID [PLA] PACKAGING MARKET, BY END USER, 2025-2034 (USD BILLION)
      39. TABLE 38 THAILAND POLYLACTIC ACID [PLA] PACKAGING MARKET, BY TYPE, 2025-2034 (USD BILLION)
      40. TABLE 39 THAILAND POLYLACTIC ACID [PLA] PACKAGING MARKET, BY RAW MATERIAL, 2025-2034 (USD BILLION)
      41. TABLE 40 THAILAND POLYLACTIC ACID [PLA] PACKAGING MARKET, BY FORM, 2025-2034 (USD BILLION)
      42. TABLE 41 THAILAND POLYLACTIC ACID [PLA] PACKAGING MARKET, BY APPLICATION, 2025-2034 (USD BILLION)
      43. TABLE 42 THAILAND POLYLACTIC ACID [PLA] PACKAGING MARKET, BY END USER, 2025-2034 (USD BILLION)
      44. TABLE 43 VIETNAM POLYLACTIC ACID [PLA] PACKAGING MARKET, BY TYPE, 2025-2034 (USD BILLION)
      45. TABLE 44 VIETNAM POLYLACTIC ACID [PLA] PACKAGING MARKET, BY RAW MATERIAL, 2025-2034 (USD BILLION)
      46. TABLE 45 VIETNAM POLYLACTIC ACID [PLA] PACKAGING MARKET, BY FORM, 2025-2034 (USD BILLION)
      47. TABLE 46 VIETNAM POLYLACTIC ACID [PLA] PACKAGING MARKET, BY APPLICATION, 2025-2034 (USD BILLION)
      48. TABLE 47 VIETNAM POLYLACTIC ACID [PLA] PACKAGING MARKET, BY END USER, 2025-2034 (USD BILLION)
      49. TABLE 48 MALAYSIA POLYLACTIC ACID [PLA] PACKAGING MARKET, BY TYPE, 2025-2034 (USD BILLION)
      50. TABLE 49 MALAYSIA POLYLACTIC ACID [PLA] PACKAGING MARKET, BY RAW MATERIAL, 2025-2034 (USD BILLION)
      51. TABLE 50 MALAYSIA POLYLACTIC ACID [PLA] PACKAGING MARKET, BY FORM, 2025-2034 (USD BILLION)
      52. TABLE 51 MALAYSIA POLYLACTIC ACID [PLA] PACKAGING MARKET, BY APPLICATION, 2025-2034 (USD BILLION)
      53. TABLE 52 MALAYSIA POLYLACTIC ACID [PLA] PACKAGING MARKET, BY END USER, 2025-2034 (USD BILLION)
      54. TABLE 53 SINGAPORE POLYLACTIC ACID [PLA] PACKAGING MARKET, BY TYPE, 2025-2034 (USD BILLION)
      55. TABLE 54 SINGAPORE POLYLACTIC ACID [PLA] PACKAGING MARKET, BY RAW MATERIAL, 2025-2034 (USD BILLION)
      56. TABLE 55 SINGAPORE POLYLACTIC ACID [PLA] PACKAGING MARKET, BY FORM, 2025-2034 (USD BILLION)
      57. TABLE 56 SINGAPORE POLYLACTIC ACID [PLA] PACKAGING MARKET, BY APPLICATION, 2025-2034 (USD BILLION)
      58. TABLE 57 SINGAPORE POLYLACTIC ACID [PLA] PACKAGING MARKET, BY END USER, 2025-2034 (USD BILLION)
      59. TABLE 58 REST OF ASIA PACIFIC POLYLACTIC ACID [PLA] PACKAGING MARKET, BY TYPE, 2025-2034 (USD BILLION)
      60. TABLE 59 REST OF ASIA PACIFIC POLYLACTIC ACID [PLA] PACKAGING MARKET, BY RAW MATERIAL, 2025-2034 (USD BILLION)
      61. TABLE 60 REST OF ASIA PACIFIC POLYLACTIC ACID [PLA] PACKAGING MARKET, BY FORM, 2025-2034 (USD BILLION)
      62. TABLE 61 REST OF ASIA PACIFIC POLYLACTIC ACID [PLA] PACKAGING MARKET, BY APPLICATION, 2025-2034 (USD BILLION)
      63. TABLE 62 REST OF ASIA PACIFIC POLYLACTIC ACID [PLA] PACKAGING MARKET, BY END USER, 2025-2034 (USD BILLION) LIST OF FIGURES
      64. FIGURE 1 RESEARCH PROCESS
      65. FIGURE 2 MARKET STRUCTURE FOR THE ASIA PACIFIC POLYLACTIC ACID [PLA] PACKAGING MARKET
      66. FIGURE 3 MARKET DYNAMICS FOR THE ASIA PACIFIC POLYLACTIC ACID [PLA] PACKAGING MARKET
      67. FIGURE 4 ASIA PACIFIC POLYLACTIC ACID [PLA] PACKAGING MARKET, SHARE (%), BY TYPE, 2022
      68. FIGURE 5 ASIA PACIFIC POLYLACTIC ACID [PLA] PACKAGING MARKET, SHARE (%), BY RAW MATERIAL, 2022
      69. FIGURE 6 ASIA PACIFIC POLYLACTIC ACID [PLA] PACKAGING MARKET, SHARE (%), BY FORM, 2022
      70. FIGURE 7 ASIA PACIFIC POLYLACTIC ACID [PLA] PACKAGING MARKET, SHARE (%), BY APPLICATION, 2022
      71. FIGURE 8 ASIA PACIFIC POLYLACTIC ACID [PLA] PACKAGING MARKET, SHARE (%), BY END USER, 2022
      72. FIGURE 9 ASIA PACIFIC POLYLACTIC ACID [PLA] PACKAGING MARKET, SHARE (%), BY REGION, 2022
      73. FIGURE 10 ASIA PACIFIC POLYLACTIC ACID [PLA] PACKAGING MARKET: COMPANY SHARE ANALYSIS, 2022 (%)
      74. FIGURE 11 BASF SE: FINANCIAL OVERVIEW SNAPSHOT
      75. FIGURE 12 BASF SE: SWOT ANALYSIS
      76. FIGURE 13 FUTERRO: FINANCIAL OVERVIEW SNAPSHOT
      77. FIGURE 14 FUTERRO: SWOT ANALYSIS
      78. FIGURE 15 NATUREWORKS LLC: FINANCIAL OVERVIEW SNAPSHOT
      79. FIGURE 16 NATUREWORKS LLC: SWOT ANALYSIS
      80. FIGURE 17 TOTALENERGIES CORBION: FINANCIAL OVERVIEW SNAPSHOT
      81. FIGURE 18 TOTALENERGIES CORBION: SWOT ANALYSIS
      82. FIGURE 19 SULZER LTD: FINANCIAL OVERVIEW SNAPSHOT
      83. FIGURE 20 SULZER LTD: SWOT ANALYSIS
      84. FIGURE 21 MITSUBISHI CHEMICAL CORPORATION: FINANCIAL OVERVIEW SNAPSHOT
      85. FIGURE 22 MITSUBISHI CHEMICAL CORPORATION: SWOT ANALYSIS
      86. FIGURE 23 TORAY INDUSTRIES, INC..: FINANCIAL OVERVIEW SNAPSHOT
      87. FIGURE 24 TORAY INDUSTRIES, INC..: SWOT ANALYSIS
      88. FIGURE 25 MERCK KGAA: FINANCIAL OVERVIEW SNAPSHOT
      89. FIGURE 26 MERCK KGAA: SWOT ANALYSIS
      90. FIGURE 27 TIGERNIX PTE. LTD.: FINANCIAL OVERVIEW SNAPSHOT
      91. FIGURE 28 TIGERNIX PTE. LTD.: SWOT ANALYSIS
      92. FIGURE 29 EVONIK INDUSTRIES AG: FINANCIAL OVERVIEW SNAPSHOT
      93. FIGURE 30 EVONIK INDUSTRIES AG: SWOT ANALYSIS
      94. FIGURE 31 POLYVEL INC: FINANCIAL OVERVIEW SNAPSHOT
      95. FIGURE 32 POLYVEL INC: SWOT ANALYSIS
      96. FIGURE 33 UNITIKA LTD: FINANCIAL OVERVIEW SNAPSHOT
      97. FIGURE 34 UNITIKA LTD: SWOT ANALYSIS
      98. FIGURE 35 JIANGXI ACADEMY OF SCIENCES BIOLOGICAL NEW MATERIALS CO., LTD: FINANCIAL OVERVIEW SNAPSHOT
      99. FIGURE 36 JIANGXI ACADEMY OF SCIENCES BIOLOGICAL NEW MATERIALS CO., LTD: SWOT ANALYSIS
      100. FIGURE 37 SHANGHAI TONG-JIE-LIANG BIOMATERIALS CO., LTD: FINANCIAL OVERVIEW SNAPSHOT
      101. FIGURE 38 SHANGHAI TONG-JIE-LIANG BIOMATERIALS CO., LTD: SWOT ANALYSIS
      102. FIGURE 39 ZHEJIANG HISUN BIOMATERIALS CO., LTD: FINANCIAL OVERVIEW SNAPSHOT
      103. FIGURE 40 ZHEJIANG HISUN BIOMATERIALS CO., LTD: SWOT ANALYSIS
      104. FIGURE 41 RADICI PARTECIPAZIONI SPA: FINANCIAL OVERVIEW SNAPSHOT
      105. FIGURE 42 RADICI PARTECIPAZIONI SPA: SWOT ANALYSIS

    Asia Pacific Butyric Acid Market Segmentation

    Market Segmentation Overview

    • Detailed segmentation data will be available in the full report
    • Comprehensive analysis by multiple parameters
    • Regional and country-level breakdowns
    • Market size forecasts by segment
    Infographic

    Free Sample Request

    Kindly complete the form below to receive a free sample of this Report

    Get Free Sample

    Customer Strories

    “I am very pleased with how market segments have been defined in a relevant way for my purposes (such as "Portable Freezers & refrigerators" and "last-mile"). In general the report is well structured. Thanks very much for your efforts.”

    Victoria Milne

    Founder
    Case Study
    Chemicals and Materials