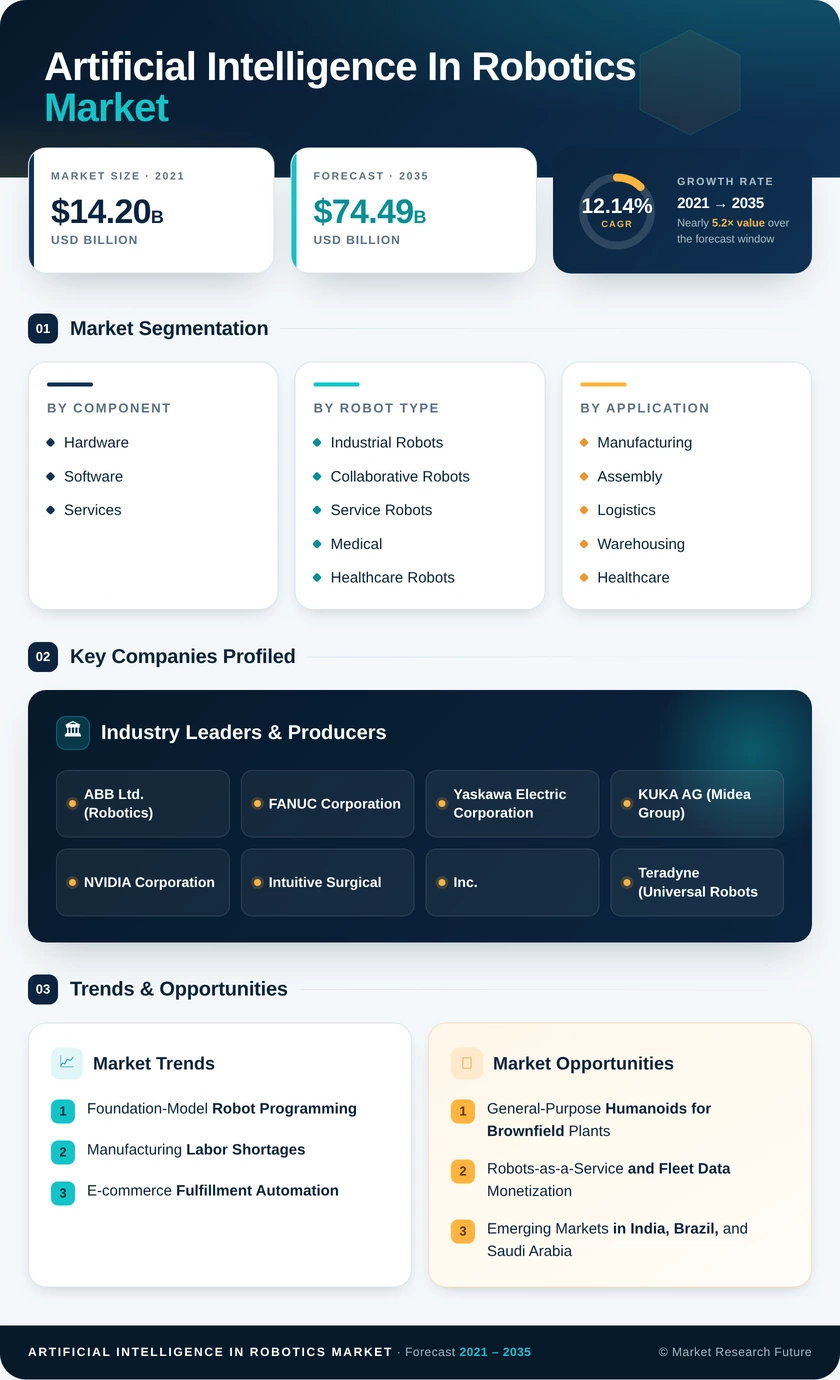
Artificial Intelligence in Robotics Market (2026 – 2035)

ID: MRFR/ICT/30049-HCR 100 Pages Nirmit Biswas Last Updated: October 17, 2026
Artificial Intelligence in Robotics Market Size, Share and Research Report By Component (Hardware, Software, and Services), By Robot Type (Industrial Robots, Collaborative Robots, Service Robots, and Medical and Healthcare Robots), By Application (Manufacturing and Assembly, Logistics and Warehousing, Healthcare and Surgery, Inspection and Maintenance, and Retail and Customer Service), By End-user Industry (Automotive, Electronics and Semiconductors, Healthcare, Logistics and E-commerce, Food and Beverage, and Others) And By Region (North America, Europe, Asia-Pacific, And Rest Of The World) – Industry Forecast Till 2035
Artificial Intelligence in Robotics Market
Market Size
Forecast Period2026-2035
CAGR (2026-2035)12.14%
2025 Market SizeUSD 23.65 Billion
2035 Market SizeUSD 74.49 Billion
Key Players
ABB Ltd.
FANUC Corporation
Yaskawa Electric Corporation
KUKA AG
NVIDIA Corporation
Intuitive Surgical, Inc.
Opportunities
  • General-Purpose Humanoids for Brownfield Plants
  • Robots-as-a-Service and Fleet Data Monetization
  • Emerging Markets in India, Brazil, and Saudi Arabia
  1. 1 Market Summary | |
  2. 2 Key Report Takeaways | |
    1. 2.1 By Component | |
    2. 2.2 By Robot Type | |
    3. 2.3 By Application | |
    4. 2.4 By End-user Industry | |
    5. 2.5 By Region | |
  3. 3 Market Size and Forecast (2021–2035) | |
    1. 3.1 Historical Market Size (2021–2025) | |
    2. 3.2 Forecast Market Size (2026–2035) | |
    3. 3.3 Year-over-Year Growth Analysis | |
  4. 4 Driver Impact Analysis | |
    1. 4.1 Foundation-Model Robot Programming | |
    2. 4.2 Manufacturing Labor Shortages | |
    3. 4.3 E-commerce Fulfillment Automation | |
    4. 4.4 National Robotics and Industrial Policy | |
    5. 4.5 Automotive and Electronics Production Investment | |
    6. 4.6 Aging Demographics and Healthcare Demand | |
  5. 5 Restraints Impact Analysis | |
    1. 5.1 High Upfront and Integration Costs | |
    2. 5.2 AI and Robotics Talent Scarcity | |
    3. 5.3 Regulatory and Safety Certification Complexity | |
    4. 5.4 Cybersecurity and Data Governance Risks | |
    5. 5.5 Semiconductor Export Controls and Trade Friction | |
  6. 6 Opportunities | |
    1. 6.1 General-Purpose Humanoids for Brownfield Plants | |
    2. 6.2 Robots-as-a-Service and Fleet Data Monetization | |
    3. 6.3 Emerging Markets in India, Brazil, and Saudi Arabia | |
    4. 6.4 Eldercare and Hospital Logistics | |
    5. 6.5 Simulation, Synthetic Data, and Digital Twins | |
  7. 7 Regional Market Share and Country-Level Analysis | |
    1. 7.1 North America | | |
      1. 7.1.1 United States | |
    2. 7.2 Europe | | |
      1. 7.2.1 Germany | | |
      2. 7.2.2 United Kingdom | | |
      3. 7.2.3 France | | |
      4. 7.2.4 Rest of Europe | |
    3. 7.3 Asia-Pacific | | |
      1. 7.3.1 China | | |
      2. 7.3.2 Japan | | |
      3. 7.3.3 South Korea | | |
      4. 7.3.4 India | | |
      5. 7.3.5 Rest of Asia-Pacific | |
    4. 7.4 South America | | |
      1. 7.4.1 Brazil | | |
      2. 7.4.2 Rest of South America | |
    5. 7.5 Middle East & Africa | | |
      1. 7.5.1 Saudi Arabia | | |
      2. 7.5.2 United Arab Emirates | | |
      3. 7.5.3 Rest of Middle East & Africa | |
  8. 8 Future Outlook (2026–2035) | |
    1. 8.1 Embodied Foundation Models Become the Control Layer | |
    2. 8.2 Humanoid Scale-Up and Unit Economics | |
    3. 8.3 Platform Economics and Fleet Interoperability | |
    4. 8.4 Energy, Compute, and Sustainability Reporting | |
  9. 9 Segmentation Analysis | |
    1. 9.1 By Component | | |
      1. 9.1.1 Hardware | | |
      2. 9.1.2 Software | | |
      3. 9.1.3 Services | |
    2. 9.2 By Robot Type | | |
      1. 9.2.1 Industrial Robots | | |
      2. 9.2.2 Collaborative Robots | | |
      3. 9.2.3 Service Robots | | |
      4. 9.2.4 Medical and Healthcare Robots | |
    3. 9.3 By Application | | |
      1. 9.3.1 Manufacturing and Assembly | | |
      2. 9.3.2 Logistics and Warehousing | | |
      3. 9.3.3 Healthcare and Surgery | | |
      4. 9.3.4 Inspection and Maintenance | | |
      5. 9.3.5 Retail and Customer Service | |
    4. 9.4 By End-user Industry | | |
      1. 9.4.1 Automotive | | |
      2. 9.4.2 Electronics and Semiconductors | | |
      3. 9.4.3 Healthcare | | |
      4. 9.4.4 Logistics and E-commerce | | |
      5. 9.4.5 Food and Beverage | | |
      6. 9.4.6 Others | |
  10. 10 Competitive Landscape | |
    1. 10.1 Market Concentration Analysis | |
    2. 10.2 Competitive Benchmarking Matrix | |
    3. 10.3 Company Profiles | | |
      1. 10.3.1 ABB Ltd. | | |
      2. 10.3.2 FANUC Corporation | | |
      3. 10.3.3 Yaskawa Electric Corporation | | |
      4. 10.3.4 KUKA AG | | |
      5. 10.3.5 NVIDIA Corporation | | |
      6. 10.3.6 Intuitive Surgical, Inc. | | |
      7. 10.3.7 Teradyne (Universal Robots, MiR) | | |
      8. 10.3.8 Amazon Robotics | | |
      9. 10.3.9 Boston Dynamics | | |
      10. 10.3.10 Alphabet (Google DeepMind) | |
  11. 11 Recent News & Developments | |
  12. 12 Report Scope and Methodology | |
  13. 13 Detailed Sources and Citations | |
  14. 14 Frequently Asked Questions (FAQs) | | LIST OF TABLES | |
  15. TABLE 1 Global AI in Robotics Market Size & Forecast, by Revenue (USD Billion), 2021–2035 | |
  16. TABLE 2 Global AI in Robotics Market – Year-over-Year Growth Analysis, 2021–2035 | |
  17. TABLE 3 Driver Impact Analysis, 2026–2035 | |
  18. TABLE 4 Restraints Impact Analysis, 2026–2035 | |
  19. TABLE 5 Global AI in Robotics Market, by Region, 2025–2035 | |
  20. TABLE 6 North America AI in Robotics Market, by Country, 2021–2035 (USD Billion) | |
  21. TABLE 7 Europe AI in Robotics Market, by Country, 2021–2035 (USD Billion) | |
  22. TABLE 8 Asia-Pacific AI in Robotics Market, by Country, 2021–2035 (USD Billion) | |
  23. TABLE 9 South America AI in Robotics Market, by Country, 2021–2035 (USD Billion) | |
  24. TABLE 10 Middle East & Africa AI in Robotics Market, by Country, 2021–2035 (USD Billion) | |
  25. TABLE 11 Global AI in Robotics Market, by Component, 2021–2035 (USD Billion) | |
  26. TABLE 12 Global AI in Robotics Market, by Robot Type, 2021–2035 (USD Billion) | |
  27. TABLE 13 Global AI in Robotics Market, by Application, 2021–2035 (USD Billion) | |
  28. TABLE 14 Global AI in Robotics Market, by End-user Industry, 2021–2035 (USD Billion) | |
  29. TABLE 15 Competitive Benchmarking Matrix, 2025 | |
  30. TABLE 16 Recent News & Developments, 2024–2025 | |
  31. TABLE 17 Report Scope and Methodology | |
  32. TABLE 18 Detailed Sources and Citations | | LIST OF FIGURES | |
  33. FIGURE 1 Market Dynamics Overview – Drivers, Restraints, and Opportunities | |
  34. FIGURE 2 Industry Value Chain Analysis | |
  35. FIGURE 3 Porter's Five Forces Analysis | |
  36. FIGURE 4 Global AI in Robotics Market Size Trend, 2021–2035 (USD Billion) | |
  37. FIGURE 5 Market Share by Component, 2025 (%) | |
  38. FIGURE 6 Market Share by Robot Type, 2025 (%) | |
  39. FIGURE 7 Market Share by Application, 2025 (%) | |
  40. FIGURE 8 Market Share by End-user Industry, 2025 (%) | |
  41. FIGURE 9 Regional Market Share, 2025 (%) | |
  42. FIGURE 10 Regional Growth Comparison, 2026–2035 (CAGR %) | |
  43. FIGURE 11 Competitive Landscape – Estimated Revenue Share Ranges, 2025 | |
  44. FIGURE 12 Competitive Positioning Matrix

Segmentation Quick Reference

DimensionSub-SegmentsDominant SegmentFastest Growing Segment
By ComponentHardware, Software, ServicesHardware — 57.4% share (2025)Software — 21.6% CAGR (2026–2035)
By Robot TypeIndustrial Robots, Collaborative Robots, Service Robots, Medical and Healthcare RobotsIndustrial Robots — 63.1% share (2025)Medical and Healthcare Robots — 23.2% CAGR (2026–2035)
By ApplicationManufacturing and Assembly, Logistics and Warehousing, Healthcare and Surgery, Inspection and Maintenance, Retail and Customer ServiceManufacturing and Assembly — 37.8% share (2025)Logistics and Warehousing — 22.4% CAGR (2026–2035)
By End-user IndustryAutomotive, Electronics and Semiconductors, Healthcare, Logistics and E-commerce, Food and Beverage, OthersAutomotive — 25.7% share (2025)Healthcare — 22.1% CAGR (2026–2035)
By RegionNorth America, Europe, Asia-Pacific, South America, Middle East & AfricaAsia-Pacific — 13.4% CAGR (2026–2035)Asia-Pacific — 13.4% CAGR (2026–2035)


Market Segmentation Overview

By Component

Sub-SegmentKey Trend
HardwareModular sensors, grippers, and edge AI boards replace monolithic robot builds
SoftwarePre-trained perception and motion-planning libraries ship with new robots
ServicesRetraining and remote monitoring contracts become recurring revenue


Hardware leads the component mix because sensors, actuators, and edge processors are required in every AI-enabled deployment, and modular designs let buyers upgrade cameras or compute without replacing the arm. Software grows fastest as machine learning & deep learning libraries deliver defect detection and adaptive grasping on existing fleets. Services track software adoption, since learned models need periodic retraining as parts and conditions change.

By Robot Type

Sub-SegmentKey Trend
Industrial RobotsAI lets Articulated Robots handle variable parts without re-teaching
Collaborative RobotsSafety-rated cobots spread into high-mix, low-volume cells
Service RobotsLogistics and cleaning robots move from pilots to fleet deployments
Medical and Healthcare RobotsSurgical platforms add force feedback and computer vision


Industrial Robots dominate because Articulated Robots already form an installed base above 4.28 million units, and AI retrofits extend their useful range to variable workpieces. Medical and Healthcare Robots grow fastest, propelled by surgical clearances such as da Vinci 5 and hospital logistics robots that address staff shortages. Collaborative Robots and Service Robots fill the gap between fixed automation and fully manual work.

By Application

Sub-SegmentKey Trend
Manufacturing and AssemblyInline vision inspection and predictive maintenance reduce scrap
Logistics and WarehousingAI-routed mobile robots adapt to shifting inventory in real time
Healthcare and SurgeryRobotic assistance expands into new minimally invasive procedures
Inspection and MaintenanceLegged and crawler robots survey energy and infrastructure assets
Retail and Customer ServiceShelf-scanning and assistance robots enter large-format stores


Manufacturing and Assembly remains the largest application because embedded vision catches defects invisible to human inspectors and edge analytics predicts equipment failures. Logistics and Warehousing grows fastest as e-commerce operators scale mobile robot fleets coordinated by fleet-level AI such as DeepFleet. Healthcare and Surgery and Inspection and Maintenance expand on the strength of specialized, high-value use cases.

By End-user Industry

Sub-SegmentKey Trend
AutomotiveGenerative AI shortens programming for new models and battery lines
Electronics and SemiconductorsNew fabs specify automated wafer and component handling
HealthcareAging populations and surgical volumes lift robot demand
Logistics and E-commerceParcel sortation and goods-to-person picking automate at scale
Food and BeverageVision-guided handling copes with irregular, hygiene-sensitive products
OthersAgriculture, construction, and energy trial field-ready robots


Automotive holds the largest end-user share, applying AI robots to welding, painting, and EV battery assembly, where generative tools cut programming time for new variants. Healthcare grows fastest as care-worker shortages and expanding surgical indications push hospitals toward robotic assistance. Electronics and Semiconductors gains from CHIPS-funded fab construction, while Food and Beverage adopts vision-guided robots for irregular products.




Download PDF ×

We do not share your information with anyone. However, we may send you emails based on your report interest from time to time. You may contact us at any time to opt-out.