ID: MRFR/MED/0711-HCR | February 2021 | Region: Global | 80 pages
Market Scenario
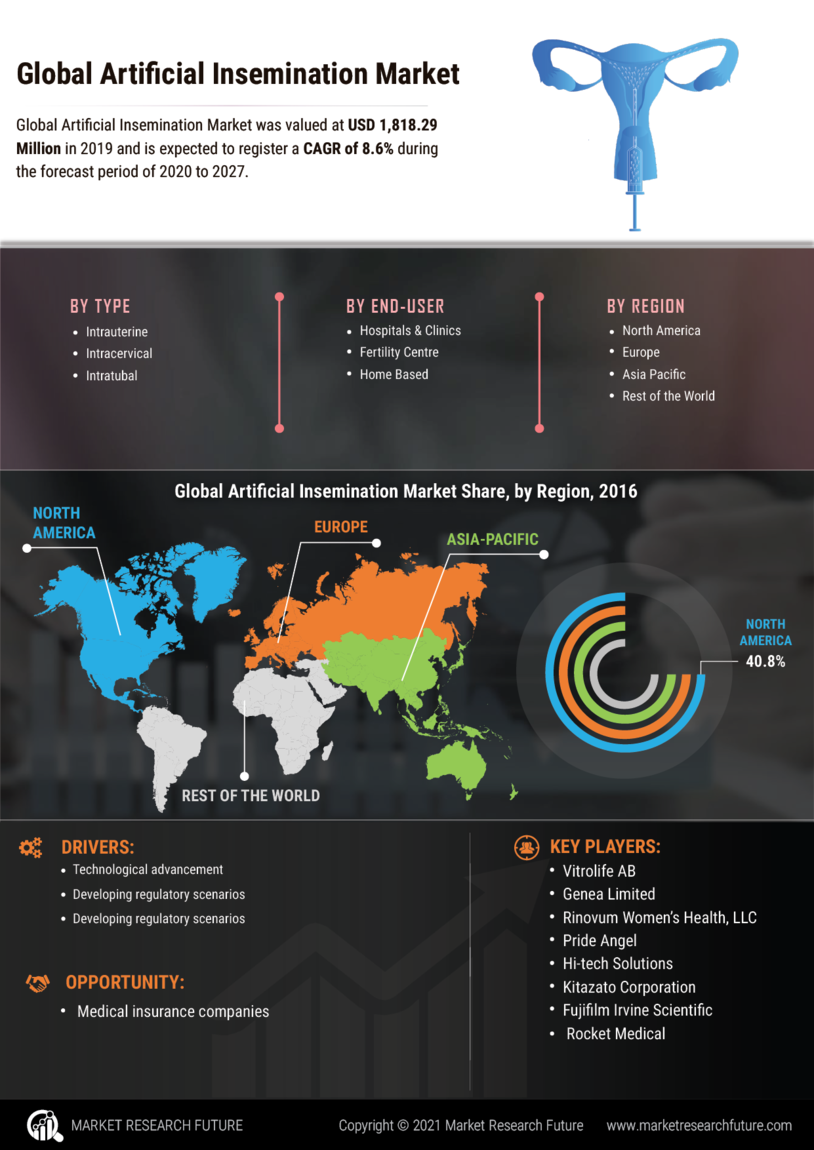
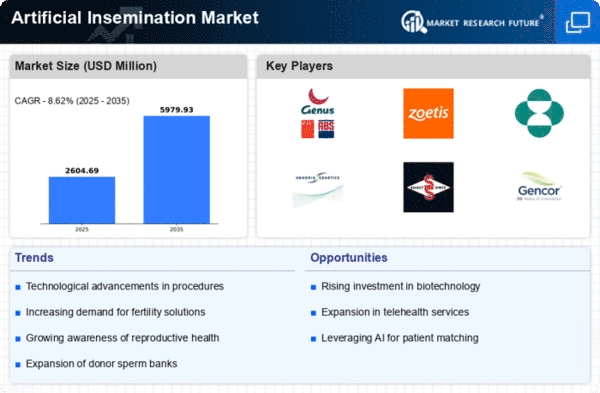
The artificial insemination is expected to register 11.8% CAGR during the forecast period of 2019 to 2025 and will achieve USD 1,943 million in 2025 with a market value of USD 1,726 million in 2018.
Artificial insemination is a treatment for infertility. It is a process involving the introduction of semen into the female reproductive tract. Artificial insemination has grown in popularity as infertility becomes more prevalent and more women opt to become single mothers.
Segmentation
The global artificial insemination has been segmented based on procedure, product type, and end-user. The global market, based on procedure, has been segmented into intrauterine insemination, intracervical insemination, and intratubal insemination. The intrauterine insemination sub-segment is expected to be the largest procedure type market as it increases the fertilization rate by inserting sperm inside the women’s uterus to facilitate fertilization. Intrauterine insemination is the most common and non-invasive procedure, which is expected to drive the growth of the global artificial insemination market.
The global market, by product type, has been classified into insemination kits, home conception devices, and accessories. Among this, the insemination kits segment is expected to be the fastest-growing segment in terms of value due to the growing geriatric population and is predicted to generate higher revenue during the forecast period.
The global market, based on end-user, has been segmented into hospitals and clinics, fertility centers, home care settings, and others. The fertility centers segment is expected to hold the largest share of the global market during the forecast period. Furthermore, major pharmaceutical companies are working on launching new insemination kits that have conventional benefits. This is expected to drive the growth of the global artificial insemination market.
The global market has been segmented, by region, into the Americas, Europe, Asia-Pacific, and the Middle East & Africa. The artificial insemination market in the Americas has further been branched into North America and Latin America. Within North American, the market is been divided into the US and Canada. The European artificial insemination has been sub-divided into Western Europe and Eastern Europe. Western Europe has further been classified as Germany, France, Italy, Spain, the UK, and the rest of Western Europe. The artificial insemination in Asia-Pacific has been segmented into Japan, China, India, South Korea, and Australia. The artificial insemination in the Middle East & Africa has been divided into the Middle East and Africa.
Key Players
The key players operating in the global artificial insemination market are INVO Bioscience, MEDGYN PRODUCTS, INC., FUJIFILM Irvine Scientific., Kitazato Corporation, Rocket Medical plc, Genea Limited, Vitrolife, Rinovum Women's Health, LLC., and HI-TECH Solutions.
Regional Market Summary
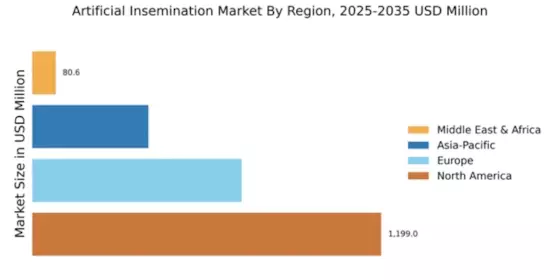
Global Artificial Insemination Market Share (%), by Region, 2018
Source: World Health Organization (WHO), Institute of Medicine (IOM)
The market in America is projected to register a steady growth rate during the forecast period owing to the rising technological advancements. Additionally, fertility problems are rising in the US, which ultimately fuels the demand for artificial insemination in the region. For instance, approximately 12% of women of age between 15 and 44 years in the US have difficulty getting pregnant.
The market in Europe is expected to register a significant growth rate during the forecast period. This can be attributed to the unhealthy lifestyle and rising prevalence of infertility. Moreover, delays in pregnancy and changing lifestyles are the major factors driving the growth of the artificial insemination market in Europe.
The market in Asia-Pacific is expected to dominate the artificial insemination market due to the rising prevalence of infertility. For instance, according to the Asian Pacific Journal of Reproduction, in 2019, in China, the rate of infertility is 15–20% in women and 10–12% in men. Moreover, there is a rise in awareness regarding the infertility treatment options, which is expected to drive the growth of the artificial insemination market in the region.
The market in the Middle East & Africa is expected to grow at a substantial rate due to the increase in the infertility rate in this region.
Global Artificial Insemination Market, by Procedure
Global Artificial Insemination Market by Product Type
Global Artificial Insemination Market, by End User
Global Artificial insemination Market, by Region
Europe
Asia-Pacific
Intended Audience
TABLE OF CONTENTS
1. REPORT PROLOGUE
2. MARKET INTRODUCTION
2.1. Definition
2.2. Scope of the Study
2.2.1. Research Objective
2.2.2. Assumptions
2.2.3. Limitations
3. RESEARCH METHODOLOGY
3.1. Overview
3.2. Primary Research
3.3. Secondary Research
3.4. Market Size Estimation
4. MARKET DYNAMICS
4.1. Overview
4.2. Drivers
4.3. Restraints
4.4. Opportunities
5. MARKET FACTOR ANALYSIS
5.1. Porter’s Five Forces Analysis
5.1.1. Bargaining Power of Suppliers
5.1.2. Bargaining Power of Buyers
5.1.3. Threat of New Entrants
5.1.4. Threat of Substitutes
5.1.5. Intensity of Rivalry
5.2. Value Chain Analysis
6. GLOBAL ARTIFICIAL INSEMINATION MARKET, BY PROCEDURE
6.1. Overview
6.2. Intrauterine Insemination
Market Estimates & Forecast, by Region, 2019–2025
Market Estimates & Forecast, by Country, 2019–2025
6.3. Intracervical Insemination
Market Estimates & Forecast, by Region, 2019–2025
Market Estimates & Forecast, by Country, 2019–2025
6.4. Intratubal Insemination
Market Estimates & Forecast, by Region, 2019–2025
Market Estimates & Forecast, by Country, 2019–2025
7. GLOBAL ARTIFICIAL INSEMINATION MARKET, BY PRODUCT TYPE
7.1. Overview
7.2. Insemination Kits
Market Estimates & Forecast, by Region, 2019–2025
Market Estimates & Forecast, by Country, 2019–2025
7.3. Home Conception Devices
Market Estimates & Forecast, by Region, 2019–2025
Market Estimates & Forecast, by Country, 2019–2025
7.4. Accessories
Market Estimates & Forecast, by Region, 2019–2025
Market Estimates & Forecast, by Country, 2019–2025
8. GLOBAL ARTIFICIAL INSEMINATION MARKET, BY END USER
8.1. Overview
8.2. Hospitals & Clinics
Market Estimates & Forecast, by Region, 2019–2025
Market Estimates & Forecast, by Country, 2019–2025
8.3. Fertility Centres
Market Estimates & Forecast, by Region, 2019–2025
Market Estimates & Forecast, by Country, 2019–2025
8.4. Home Care Settings
Market Estimates & Forecast, by Region, 2019–2025
Market Estimates & Forecast, by Country, 2019–2025
8.5. Others
Market Estimates & Forecast, by Region, 2019–2025
Market Estimates & Forecast, by Country, 2019–2025
9. GLOBAL ARTIFICIAL INSEMINATION MARKET, BY REGION
9.1. Overview
9.2. Americas
9.2.1. North America
9.2.1.1. US
9.2.1.2. Canada
9.2.2. Latin America
9.3. Europe
9.3.1. Western Europe
9.3.1.1. Germany
9.3.1.2. France
9.3.1.3. Italy
9.3.1.4. Spain
9.3.1.5. UK
9.3.1.6. Rest of Western Europe
9.3.2. Eastern Europe
9.4. Asia-Pacific
9.4.1. Japan
9.4.2. China
9.4.3. India
9.4.4. Australia
9.4.5. South Korea
9.4.6. Rest of Asia-Pacific
9.5. Middle East & Africa
9.5.1. Middle East
9.5.2. Africa
10. COMPANY LANDSCAPE
10.1. Overview
10.2. Competitive Analysis
10.3. Market Share Analysis
10.4. Major Growth Strategy in the Global Artificial Insemination Market
10.5. Competitive Benchmarking
10.6. Leading Players in Terms of Number of Developments in the Global Artificial Insemination Market
10.7. Key Developments and Growth Strategies
10.7.1. New Product Launch/Service Deployment
10.7.2. Mergers and Acquisitions
10.7.3. Joint Ventures
10.8. Major Players Financial Matrix & Market Ratio
10.8.1. Sales & Operating Income 2018
10.8.2. Major Players R&D Expenditure 2018
10.9. Major Players Capital Market Ratio
11. COMPANY PROFILES
11.1. INVO Bioscience
11.1.1. Company Overview
11.1.2. Product Overview
11.1.3. Financial Overview
11.1.4. Key Developments
11.1.5. SWOT Analysis
11.1.6. Key Strategies
11.2. MEDGYN PRODUCTS, INC
11.2.1. Company Overview
11.2.2. Product Overview
11.2.3. Financial Overview
11.2.4. Key Developments
11.2.5. SWOT Analysis
11.2.6. Key Strategies
11.3. FUJIFILM Irvine Scientific
11.3.1. Company Overview
11.3.2. Product Overview
11.3.3. Financial Overview
11.3.4. Key Developments
11.3.5. SWOT Analysis
11.3.6. Key Strategies
11.4. Kitazato Corporation
11.4.1. Company Overview
11.4.2. Product Overview
11.4.3. Financial Overview
11.4.4. Key Developments
11.4.5. SWOT Analysis
11.4.6. Key Strategies
11.5. Rocket Medical plc
11.5.1. Company Overview
11.5.2. Product Overview
11.5.3. Financial Overview
11.5.4. Key Developments
11.5.5. SWOT Analysis
11.5.6. Key Strategies
11.6. Genea Limited.
11.6.1. Company Overview
11.6.2. Product Overview
11.6.3. Financial Overview
11.6.4. Key Developments
11.6.5. SWOT Analysis
11.6.6. Key Strategies
11.7. Vitrolife
11.7.1. Company Overview
11.7.2. Product Overview
11.7.3. Financial Overview
11.7.4. Key Developments
11.7.5. SWOT Analysis
11.7.6. Key Strategies
11.8. Rinovum Women's Health, LLC.
11.8.1. Company Overview
11.8.2. Product Overview
11.8.3. Financial Overview
11.8.4. Key Developments
11.8.5. SWOT Analysis
11.8.6. Key Strategies
11.9. HI-TECH Solutions
11.9.1. Company Overview
11.9.2. Product Overview
11.9.3. Financial Overview
11.9.4. Key Developments
11.9.5. SWOT Analysis
11.9.6. Key Strategies
11.10. Others
12. APPENDIX
12.1. References
12.2. Related Reports
LIST OF TABLES
TABLE 1 GLOBAL ARTIFICIAL INSEMINATION MARKET SYNOPSIS, 2019–2025
TABLE 2 GLOBAL ARTIFICIAL INSEMINATION MARKET ESTIMATES & FORECAST, 2019–2025 (USD MILLION)
TABLE 3 GLOBAL ARTIFICIAL INSEMINATION MARKET, BY PROCEDURE, 2019–2025 (USD MILLION)
TABLE 4 GLOBAL ARTIFICIAL INSEMINATION MARKET, BY PRODUCT TYPE, 2019–2025 (USD MILLION)
TABLE 5 GLOBAL ARTIFICIAL INSEMINATION MARKET, BY END USER, 2019–2025 (USD MILLION)
TABLE 6 GLOBAL ARTIFICIAL INSEMINATION MARKET, BY REGION, 2019–2025 (USD MILLION)
TABLE 7 NORTH AMERICA: ARTIFICIAL INSEMINATION MARKET, BY PROCEDURE, 2019–2025 (USD MILLION)
TABLE 8 NORTH AMERICA: ARTIFICIAL INSEMINATION MARKET, BY PRODUCT TYPE, 2019–2025 (USD MILLION)
TABLE 9 NORTH AMERICA: ARTIFICIAL INSEMINATION MARKET, BY END USER, 2019–2025 (USD MILLION)
TABLE 10 US: ARTIFICIAL INSEMINATION MARKET, BY PROCEDURE, 2019–2025 (USD MILLION)
TABLE 11 US: ARTIFICIAL INSEMINATION MARKET, BY PRODUCT TYPE, 2019–2025 (USD MILLION)
TABLE 12 US: ARTIFICIAL INSEMINATION MARKET, BY END USER, 2019–2025 (USD MILLION)
TABLE 13 CANADA: ARTIFICIAL INSEMINATION MARKET, BY PROCEDURE, 2019–2025 (USD MILLION)
TABLE 14 CANADA: ARTIFICIAL INSEMINATION MARKET, BY PRODUCT TYPE, 2019–2025 (USD MILLION)
TABLE 15 CANADA: ARTIFICIAL INSEMINATION MARKET, BY END USER, 2019–2025 (USD MILLION)
TABLE 16 LATIN AMERICA: ARTIFICIAL INSEMINATION MARKET, BY PROCEDURE, 2019–2025 (USD MILLION)
TABLE 17 LATIN AMERICA: ARTIFICIAL INSEMINATION MARKET, BY PRODUCT TYPE, 2019–2025 (USD MILLION)
TABLE 18 LATIN AMERICA: ARTIFICIAL INSEMINATION MARKET, BY END USER, 2019–2025 (USD MILLION)
TABLE 19 EUROPE: ARTIFICIAL INSEMINATION MARKET, BY PROCEDURE, 2019–2025 (USD MILLION)
TABLE 20 EUROPE: ARTIFICIAL INSEMINATION MARKET, BY PRODUCT TYPE, 2019–2025 (USD MILLION)
TABLE 21 EUROPE: ARTIFICIAL INSEMINATION MARKET, BY END USER, 2019–2025 (USD MILLION)
TABLE 22 WESTERN EUROPE: ARTIFICIAL INSEMINATION MARKET, BY PROCEDURE, 2019–2025 (USD MILLION)
TABLE 23 WESTERN EUROPE: ARTIFICIAL INSEMINATION MARKET, BY PRODUCT TYPE, 2019–2025 (USD MILLION)
TABLE 24 WESTERN EUROPE: ARTIFICIAL INSEMINATION MARKET, BY END USER, 2019–2025 (USD MILLION)
TABLE 25 EASTERN EUROPE: ARTIFICIAL INSEMINATION MARKET, BY PROCEDURE, 2019–2025 (USD MILLION)
TABLE 26 EASTERN EUROPE: ARTIFICIAL INSEMINATION MARKET, BY PRODUCT TYPE, 2019–2025 (USD MILLION)
TABLE 27 EASTERN EUROPE: ARTIFICIAL INSEMINATION MARKET, BY END USER, 2019–2025 (USD MILLION)
TABLE 28 ASIA-PACIFIC: ARTIFICIAL INSEMINATION MARKET, BY PROCEDURE, 2019–2025 (USD MILLION)
TABLE 29 ASIA-PACIFIC: ARTIFICIAL INSEMINATION MARKET, BY PRODUCT TYPE, 2019–2025 (USD MILLION)
TABLE 30 ASIA-PACIFIC: ARTIFICIAL INSEMINATION MARKET, BY END USER, 2019–2025 (USD MILLION)
TABLE 31 MIDDLE EAST & AFRICA: ARTIFICIAL INSEMINATION MARKET, BY PROCEDURE, 2019–2025 (USD MILLION)
TABLE 32 MIDDLE EAST & AFRICA: ARTIFICIAL INSEMINATION MARKET, BY PRODUCT TYPE, 2019–2025 (USD MILLION)
TABLE 33 MIDDLE EAST & AFRICA: ARTIFICIAL INSEMINATION MARKET, BY END USER, 2019–2025 (USD MILLION)
LIST OF FIGURES
FIGURE 1 RESEARCH PROCESS
FIGURE 2 MARKET STRUCTURE OF THE GLOBAL ARTIFICIAL INSEMINATION MARKET
FIGURE 3 MARKET DYNAMICS OF THE GLOBAL ARTIFICIAL INSEMINATION MARKET
FIGURE 4 GLOBAL ARTIFICIAL INSEMINATION MARKET SHARE, BY PROCEDURE, 2018 (%)
FIGURE 5 GLOBAL ARTIFICIAL INSEMINATION MARKET SHARE, BY PRODUCT TYPE, 2018 (%)
FIGURE 6 GLOBAL ARTIFICIAL INSEMINATION MARKET SHARE, BY END USER, 2018 (%)
FIGURE 7 GLOBAL ARTIFICIAL INSEMINATION MARKET SHARE, BY REGION, 2018 (%)
FIGURE 8 AMERICAS: ARTIFICIAL INSEMINATION MARKET SHARE BY REGION, 2018 (%)
FIGURE 9 NORTH AMERICA: ARTIFICIAL INSEMINATION MARKET SHARE, BY COUNTRY, 2018 (%)
FIGURE 10 EUROPE: ARTIFICIAL INSEMINATION MARKET SHARE, BY REGION, 2018 (%)
FIGURE 11 WESTERN EUROPE: ARTIFICIAL INSEMINATION MARKET SHARE, BY COUNTRY, 2018 (%)
FIGURE 12 ASIA-PACIFIC: ARTIFICIAL INSEMINATION MARKET SHARE, BY COUNTRY, 2018 (%)
FIGURE 13 MIDDLE EAST & AFRICA: ARTIFICIAL INSEMINATION MARKET SHARE, BY COUNTRY, 2018 (%)
FIGURE 14 GLOBAL ARTIFICIAL INSEMINATION MARKET: COMPANY SHARE ANALYSIS, 2018 (%)
FIGURE 15 INVO BIOSCIENCE.: KEY FINANCIALS
FIGURE 16 INVO BIOSCIENCE: SEGMENTAL REVENUE
FIGURE 17 INVO BIOSCIENCE: REGIONAL REVENUE
FIGURE 18 MEDGYN PRODUCTS, INC: KEY FINANCIALS
FIGURE 19 MEDGYN PRODUCTS, INC: SEGMENTAL REVENUE
FIGURE 20 MEDGYN PRODUCTS, INC: REGIONAL REVENUE
FIGURE 21 FUJIFILM IRVINE SCIENTIFIC.: KEY FINANCIALS
FIGURE 22 FUJIFILM IRVINE SCIENTIFIC: SEGMENTAL REVENUE
FIGURE 23 FUJIFILM IRVINE SCIENTIFIC: REGIONAL REVENUE
FIGURE 24 KITAZATO CORPORATION: KEY FINANCIALS
FIGURE 25 KITAZATO CORPORATION: SEGMENTAL REVENUE
FIGURE 26 KITAZATO CORPORATION: REGIONAL REVENUE
FIGURE 27 ROCKET MEDICAL PLC: KEY FINANCIALS
FIGURE 28 ROCKET MEDICAL PLC: SEGMENTAL REVENUE
FIGURE 29 ROCKET MEDICAL PLC: REGIONAL REVENUE
FIGURE 30 GENEA LIMITED: KEY FINANCIALS
FIGURE 31 GENEA LIMITED: SEGMENTAL REVENUE
FIGURE 32 GENEA LIMITED: REGIONAL REVENUE
FIGURE 33 VITROLIFE: KEY FINANCIALS
FIGURE 34 VITROLIFE: SEGMENTAL REVENUE
FIGURE 35 VITROLIFE: REGIONAL REVENUE
FIGURE 36 RINOVUM WOMEN'S HEALTH, LLC: KEY FINANCIALS
FIGURE 37 RINOVUM WOMEN'S HEALTH, LLC: SEGMENTAL REVENUE
FIGURE 38 RINOVUM WOMEN'S HEALTH, LLC: REGIONAL REVENUE
FIGURE 39 HI-TECH SOLUTIONS: KEY FINANCIALS
FIGURE 40 HI-TECH SOLUTIONS: SEGMENTAL REVENUE
FIGURE 41 HI-TECH SOLUTIONS: REGIONAL REVENUE