Market Scenario
Armoured Personnel Carrier (APC) also termed as armoured combat vehicle, armoured car or infantry mobility vehicle is an armored vehicle designed to carry troops and equipment into the battlefield. APCs weighs less than the infantry fighting vehicles and main battle tanks, and hence are more mobile. Unlike the infantry fighting vehicles (IFV), APCs do not to take part in direct-fire battle and are primarily designed for transport. However, they are lightly armed for self-defence and are armored for protection against shrapnel, small arms and artillery fire. Furthermore, certain types of APCs are used by non-military organizations as well.
Factors such as focus on preventing riots in urban areas and rising incidences of asymmetric warfare are positively impacting the armoured personnel carrier market growth. In addition, the rise in defense expenditure, especially in emerging economies and subsequent investments in procuring armored vehicles to strengthen combat and tactical capabilities further boosts the market growth. However, factors such as delays in procurement processes hinders the market growth to a certain extent while enhancing protection, configuration, mobility and weaponry without significant increase in weight and cost of the APCs is a key challenge faced by the market players. Meanwhile, rising terrorist attacks and focus on counter operations, and aging combat vehicle upgradation programs being initiated by many countries throughout the world, create promising growth opportunities for the armoured personnel carrier market. Companies are also keen on developing an integrated solution covering multiple systems for maximum tactical and strategic mobility.
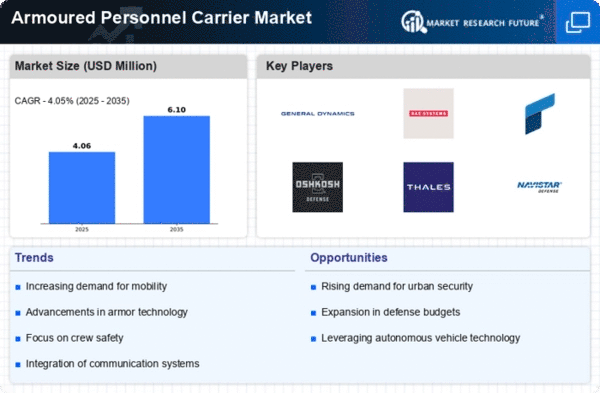
The global armoured personnel carrier market is estimated to register a CAGR of nearly 6% during the forecast period of 2018 to 2023.
Segmentation of the Global Armoured Personnel Carrier (APC) Market
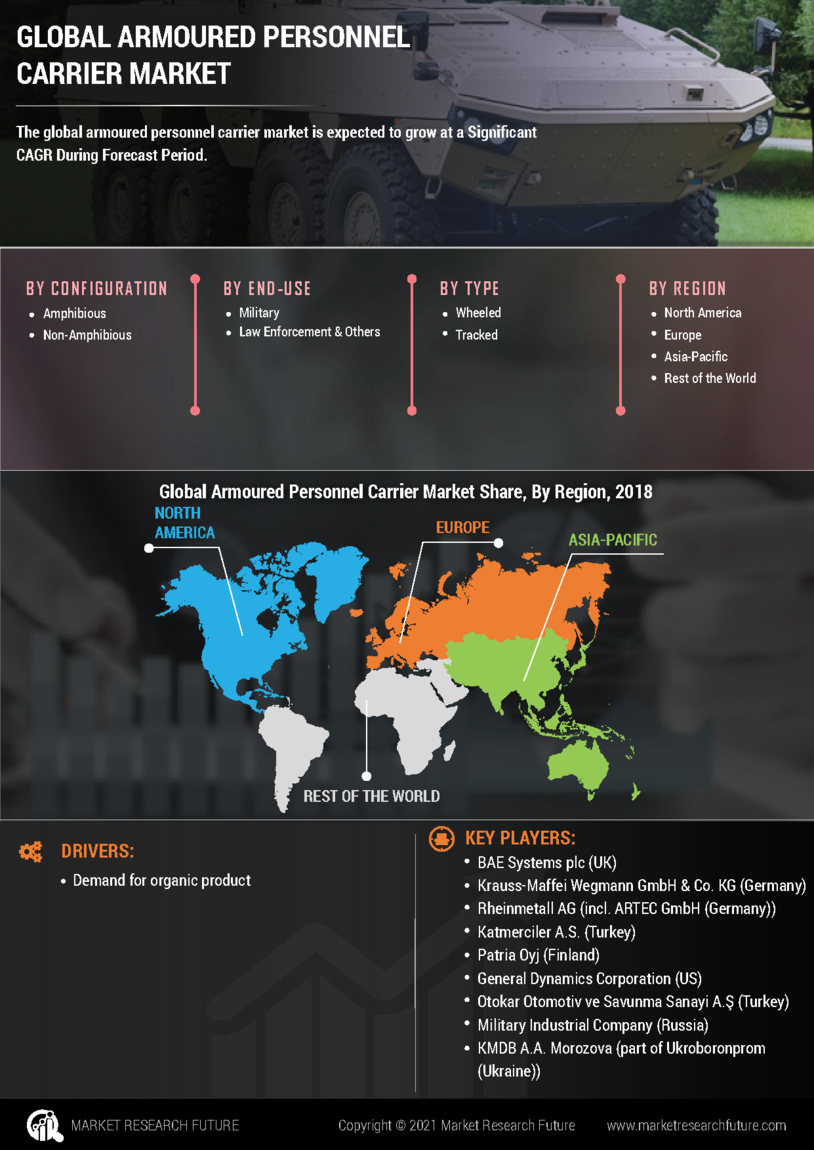
Based on type, the tracked armoured personnel carrier segment accounted for the largest market share as it offers better mine resistance and higher mobility in rough terrains which is common in most battlefields. Based on configuration, the amphibious armoured personnel carrier segment is projected to witness the highest CAGR as these are ideal for ship to shore maneuvers. Based on end-user the military segment accounted for the largest market share as various countries are deploying these vehicles mainly for combat activities and national defense.
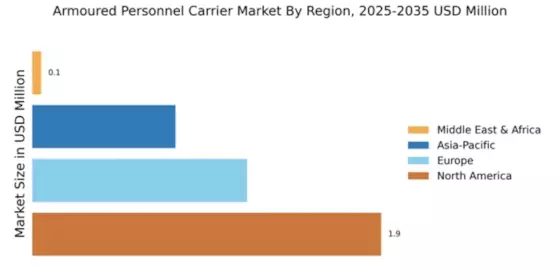
North America is estimated to account for the largest share during the review period. North America region in this report includes the US and Canada. Focus by the U.S. Department of Defense (DOD) on procuring armored vehicles, in the recent years, have resulted in the market witnessing a significant surge in demand, in this region. Moreover, the current military operations and exercises in the Middle East countries will also result in the US focusing on developing such vehicles, which will further deepen the scope of the market in the region.
Intended Audience
Key Players
The key players in the global armoured personnel carrier market are BAE Systems plc (UK), Krauss-Maffei Wegmann GmbH & Co. KG (Germany), Rheinmetall AG (incl. ARTEC GmbH (Germany)), Katmerciler A.S. (Turkey), Patria Oyj (Finland), General Dynamics Corporation (US), Otokar Otomotiv ve Savunma Sanayi A.Ş (Turkey), Military Industrial Company (Russia), KMDB A.A. Morozova (part of Ukroboronprom (Ukraine)), ST Kinetics Ltd. (Singapore), Terradyne Armored Vehicles Inc. (Canada), FNSS Savunma Sistemleri A.Ş. (Turkey), DRB-HICOM Defence Technologies Sdn. Bhd. (DefTech (Malaysia)), Paramount Group (South Africa), Iveco - Oto Melara Consortium (Italy) and Hanwha Defense Systems (South Korea).
Research Methodology
The market numbers and forecast derived were the outcome of our disciplined research methodology which includes secondary research, primary interviews, followed by data triangulation and validation from our in-house data repository and statistical modeling tools.
Secondary Research
In this process, the data collection was done through various secondary sources, which included annual reports, SEC filings, journals, government association, Aerospace & Defense magazines, white papers, corporate presentations, company websites, some paid databases and many others.
Primary Research
In this process, both demand side and supply side parties were involved to extract genuine facts and insights about market forecast, production, trend, and projected market growth. Industry stakeholders such as CEOs, VPs, directors, and marketing executives across the value chain have been approached to obtain key information.
Report Key Insights
Report Customization
MRFR offers report customization to our valued customers. Below are the options available for customization:
In-depth profiling of additional market players (3 to 4 companies)
Detailed analysis of a country and its related segment as per the report scope (subject to data availability)
Frequently Asked Questions (FAQ) :
The CAGR of leading to the growth of the Armoured Personnel Carrier (APC) Market is calculated to be 6%.
The focus on preventing riots in urban areas and rising incidences of asymmetric warfare are positively influencing the armoured personnel carrier market growth.
ARTEC GmbH, Patria Oyj, TomTom N.V., Rheinmetall AG, and Krauss-Maffei Wegmann GmbH & Co. KG are some of the top players contributing to the armoured personnel carrier market.
North America is estimated to account for the largest share during the review period in the market.
The segments such as type, configuration, and end-user are involved in the study of the personnel carrier market.
Table of Contents
1. Executive Summary
2. Market Introduction
2.1. Market Definition
2.2. Scope of the Study
2.3. Market Structure
2.4. Key Takeaways
2.5. Key Buying Criteria
3. Research Methodology
3.1. Research Process
3.2. Primary Research
3.3. Secondary Research
3.4. Market Size Estimation
3.5. Forecast Model
3.6. List of Assumptions
3.7. Limitations
4. Market Landscape
4.1. Porter’s Five Forces Analysis
4.1.1. Threat of New Entrants
4.1.2. Bargaining Power of Buyers
4.1.3. Threat of Substitutes
4.1.4. Segment Rivalry
4.1.5. Bargaining Power of Supplies
4.2. Value Chain/Supply Chain Analysis
5. Market Dynamics
5.1. Introduction
5.2. Market Drivers
5.3. Market Restraints
5.4. Market Opportunities
6. Industry Dynamics
6.1. Technology Trend
6.2. Regulatory Landscape
6.3. Patent Analysis Outlook
7. Global Armoured Personnel Carrier (APC) Market, by Configuration
7.1. Introduction
7.2. Amphibious
7.2.1. Market Estimates & Forecast, 2020–2027
7.2.2. Market Estimates & Forecast, by Region, 2020–2027
7.3. Non-Amphibious
7.3.1. Market Estimates & Forecast, 2020–2027
7.3.2. Market Estimates & Forecast, by Region, 2020–2027
8. Global Armoured Personnel Carrier (APC) Market, by End-User
8.1. Introduction
8.2. Military
8.2.1. Market Estimates & Forecast, 2020–2027
8.2.2. Market Estimates & Forecast, by Region, 2020–2027
8.3. Law Enforcement & Others
8.3.1. Market Estimates & Forecast, 2020–2027
8.3.2. Market Estimates & Forecast, by Region, 2020–2027
9. Global Armoured Personnel Carrier (APC) Market, by Type
9.1. Introduction
9.2. Wheeled
9.2.1. Market Estimates & Forecast, 2020–2027
9.2.2. Market Estimates & Forecast, by Region, 2020–2027
9.3. Tracked
9.3.1. Market Estimates & Forecast, 2020–2027
9.3.2. Market Estimates & Forecast, by Region, 2020–2027
10. Global Armoured Personnel Carrier (APC) Market, by Region
10.1. Introduction
10.2. North America
10.2.1. Market Estimates & Forecast, by Country, 2020–2027
10.2.2. Market Estimates & Forecast, by Configuration, 2020–2027
10.2.3. Market Estimates & Forecast, by End-User, 2020–2027
10.2.4. Market Estimates & Forecast, by Type, 2020–2027
10.2.5. US
10.2.5.1. Market Estimates & Forecast, by Configuration, 2020–2027
10.2.5.2. Market Estimates & Forecast, by End-User, 2020–2027
10.2.5.3. Market Estimates & Forecast, by Type, 2020–2027
10.2.6. Canada
10.2.6.1. Market Estimates & Forecast, by Configuration, 2020–2027
10.2.6.2. Market Estimates & Forecast, by End-User, 2020–2027
10.2.6.3. Market Estimates & Forecast, by Type, 2020–2027
10.3. Europe
10.3.1. Market Estimates & Forecast, by Country, 2020–2027
10.3.2. Market Estimates & Forecast, by Configuration, 2020–2027
10.3.3. Market Estimates & Forecast, by End-User, 2020–2027
10.3.4. Market Estimates & Forecast, by Type, 2020–2027
10.3.5. UK
10.3.5.1. Market Estimates & Forecast, by Configuration, 2020–2027
10.3.5.2. Market Estimates & Forecast, by End-User, 2020–2027
10.3.5.3. Market Estimates & Forecast, by Type, 2020–2027
10.3.6. Germany
10.3.6.1. Market Estimates & Forecast, by Configuration, 2020–2027
10.3.6.2. Market Estimates & Forecast, by End-User, 2020–2027
10.3.6.3. Market Estimates & Forecast, by Type, 2020–2027
10.3.7. France
10.3.7.1. Market Estimates & Forecast, by Configuration, 2020–2027
10.3.7.2. Market Estimates & Forecast, by End-User, 2020–2027
10.3.7.3. Market Estimates & Forecast, by Type, 2020–2027
10.3.8. Russia
10.3.8.1. Market Estimates & Forecast, by Configuration, 2020–2027
10.3.8.2. Market Estimates & Forecast, by End-User, 2020–2027
10.3.8.3. Market Estimates & Forecast, by Type, 2020–2027
10.3.9. Rest of Europe
10.3.9.1. Market Estimates & Forecast, by Configuration, 2020–2027
10.3.9.2. Market Estimates & Forecast, by End-User, 2020–2027
10.3.9.3. Market Estimates & Forecast, by Type, 2020–2027
10.4. Asia-Pacific
10.4.1. Market Estimates & Forecast, by Country, 2020–2027
10.4.2. Market Estimates & Forecast, by Configuration, 2020–2027
10.4.3. Market Estimates & Forecast, by End-User, 2020–2027
10.4.4. Market Estimates & Forecast, by Type, 2020–2027
10.4.5. China
10.4.5.1. Market Estimates & Forecast, by Configuration, 2020–2027
10.4.5.2. Market Estimates & Forecast, by End-User, 2020–2027
10.4.5.3. Market Estimates & Forecast, by Type, 2020–2027
10.4.6. Australia
10.4.6.1. Market Estimates & Forecast, by Configuration, 2020–2027
10.4.6.2. Market Estimates & Forecast, by End-User, 2020–2027
10.4.6.3. Market Estimates & Forecast, by Type, 2020–2027
10.4.7. India
10.4.7.1. Market Estimates & Forecast, by Configuration, 2020–2027
10.4.7.2. Market Estimates & Forecast, by End-User, 2020–2027
10.4.7.3. Market Estimates & Forecast, by Type, 2020–2027
10.4.8. Rest of Asia-Pacific
10.4.8.1. Market Estimates & Forecast, by Configuration, 2020–2027
10.4.8.2. Market Estimates & Forecast, by End-User, 2020–2027
10.4.8.3. Market Estimates & Forecast, by Type, 2020–2027
10.5. Rest of the World
10.5.1. Market Estimates & Forecast, by Region, 2020–2027
10.5.2. Market Estimates & Forecast, by Configuration, 2020–2027
10.5.3. Market Estimates & Forecast, by End-User, 2020–2027
10.5.4. Market Estimates & Forecast, by Type, 2020–2027
10.5.5. Middle East & Africa
10.5.5.1. Market Estimates & Forecast, by Configuration, 2020–2027
10.5.5.2. Market Estimates & Forecast, by End-User, 2020–2027
10.5.5.3. Market Estimates & Forecast, by Type, 2020–2027
10.5.6. Latin America
10.5.6.1. Market Estimates & Forecast, by Configuration, 2020–2027
10.5.6.2. Market Estimates & Forecast, by End-User, 2020–2027
10.5.6.3. Market Estimates & Forecast, by Type, 2020–2027
11. Competitive Landscape
11.1. Competitive Scenario
11.2. Competitive Overview
11.3. Competitive Benchmarking
11.4. Market Share Analysis
12. Company Profiles
12.1. BAE Systems plc
12.1.1. Company Overview
12.1.2. Product Offering
12.1.3. Financial Overview
12.1.4. Key Developments
12.1.5. Swot Analysis
12.1.6. Strategy
12.2. DRB-HICOM Defence Technologies Sdn. Bhd. (DefTech)
12.2.1. Company Overview
12.2.2. Product Offering
12.2.3. Financial Overview
12.2.4. Key Developments
12.2.5. Swot Analysis
12.2.6. Strategy
12.3. FNSS Savunma Sistemleri A.Ş.
12.3.1. Company Overview
12.3.2. Product Offering
12.3.3. Financial Overview
12.3.4. Key Developments
12.3.5. Swot Analysis
12.3.6. Strategy
12.4. General Dynamics Corporation
12.4.1. Company Overview
12.4.2. Product Offering
12.4.3. Financial Overview
12.4.4. Key Developments
12.4.5. Swot Analysis
12.4.6. Strategy
12.5. Hanwha Defense Systems
12.5.1. Company Overview
12.5.2. Product Offering
12.5.3. Financial Overview
12.5.4. Key Developments
12.5.5. Swot Analysis
12.5.6. Strategy
12.6. Iveco - Oto Melara Consortium
12.6.1. Company Overview
12.6.2. Product Offering
12.6.3. Financial Overview
12.6.4. Key Developments
12.6.5. Swot Analysis
12.6.6. Strategy
12.7. Katmerciler A.S.
12.7.1. Company Overview
12.7.2. Product Offering
12.7.3. Financial Overview
12.7.4. Key Developments
12.7.5. Swot Analysis
12.7.6. Strategy
12.8. KMDB A.A. Morozova (part of Ukroboronprom)
12.8.1. Company Overview
12.8.2. Product Offering
12.8.3. Financial Overview
12.8.4. Key Developments
12.8.5. Swot Analysis
12.8.6. Strategy
12.9. Krauss-Maffei Wegmann GmbH & Co. KG
12.9.1. Company Overview
12.9.2. Product Offering
12.9.3. Financial Overview
12.9.4. Key Developments
12.9.5. Swot Analysis
12.9.6. Strategy
12.10. Military Industrial Company
12.10.1. Company Overview
12.10.2. Product Offering
12.10.3. Financial Overview
12.10.4. Key Developments
12.10.5. Swot Analysis
12.10.6. Strategy
12.11. Otokar Otomotiv ve Savunma Sanayi A.Ş
12.11.1. Company Overview
12.11.2. Product Offering
12.11.3. Financial Overview
12.11.4. Key Developments
12.11.5. Swot Analysis
12.11.6. Strategy
12.12. Paramount Group
12.12.1. Company Overview
12.12.2. Product Offering
12.12.3. Financial Overview
12.12.4. Key Developments
12.12.5. Swot Analysis
12.12.6. Strategy
12.13. Patria Oyj
12.13.1. Company Overview
12.13.2. Product Offering
12.13.3. Financial Overview
12.13.4. Key Developments
12.13.5. Swot Analysis
12.13.6. Strategy
12.14. Rheinmetall AG (incl. ARTEC GmbH)
12.14.1. Company Overview
12.14.2. Product Offering
12.14.3. Financial Overview
12.14.4. Key Developments
12.14.5. Swot Analysis
12.14.6. Strategy
12.15. ST Kinetics Ltd.
12.15.1. Company Overview
12.15.2. Product Offering
12.15.3. Financial Overview
12.15.4. Key Developments
12.15.5. Swot Analysis
12.15.6. Strategy
12.16. Terradyne Armored Vehicles Inc.
12.16.1. Company Overview
12.16.2. Product Offering
12.16.3. Financial Overview
12.16.4. Key Developments
12.16.5. Swot Analysis
12.16.6. Strategy
13. Appendix
13.1. Abbreviations
13.2. References
13.3. Related Reports
List of Tables
Table 1 Global Armoured Personnel Carrier (APC) Market, by Region, 2020–2027
Table 2 North America: Armoured Personnel Carrier (APC) Market, by Country, 2020–2027
Table 3 Europe: Armoured Personnel Carrier (APC) Market, by Country, 2020–2027
Table 4 Asia-Pacific: Armoured Personnel Carrier (APC) Market, by Country, 2020–2027
Table 5 Rest of the World: Armoured Personnel Carrier (APC) Market, by Region, 2020–2027
Table 6 Global Armoured Personnel Carrier (APC), Configuration Market, by Region, 2020–2027
Table 7 North America: Armoured Personnel Carrier (APC), Configuration Market, by Country, 2020–2027
Table 8 Europe: Armoured Personnel Carrier (APC), Configuration Market, by Country, 2020–2027
Table 9 Asia-Pacific: Armoured Personnel Carrier (APC), Configuration Market, by Country, 2020–2027
Table 10 Rest of the World: Armoured Personnel Carrier (APC), Configuration Market, by Region, 2020–2027
Table 11 Global Armoured Personnel Carrier (APC) End-User Market, by Region, 2020–2027
Table 12 North America: Armoured Personnel Carrier (APC) End-User Market, by Country, 2020–2027
Table 13 Europe: Armoured Personnel Carrier (APC) End-User Market, by Country, 2020–2027
Table 14 Asia-Pacific: Armoured Personnel Carrier (APC) End-User Market, by Country, 2020–2027
Table 15 Rest of the World: Armoured Personnel Carrier (APC) End-User Market, by Region, 2020–2027
Table 16 Global Armoured Personnel Carrier (APC) Type Market, by Region, 2020–2027
Table 17 North America: Armoured Personnel Carrier (APC) Type Market, by Country, 2020–2027
Table 18 Europe: Armoured Personnel Carrier (APC) Type Market, by Country, 2020–2027
Table 19 Asia-Pacific: Armoured Personnel Carrier (APC) Type Market, by Country, 2020–2027
Table 20 Rest of the World: Armoured Personnel Carrier (APC) Type Market, by Region, 2020–2027
Table 21 Global Armoured Personnel Carrier (APC) Market, by Region, 2020–2027
Table 22 Global Armoured Personnel Carrier (APC) Market, by Configuration, 2020–2027
Table 23 Global Armoured Personnel Carrier (APC) Market, by End-User, 2020–2027
Table 24 Global Armoured Personnel Carrier (APC) Market, by Type, 2020–2027
Table 25 North America: Armoured Personnel Carrier (APC) Market, by Country, 2020–2027
Table 26 North America: Armoured Personnel Carrier (APC) Market, by Configuration, 2020–2027
Table 27 North America: Armoured Personnel Carrier (APC) Market, by End-User, 2020–2027
Table 28 North America: Armoured Personnel Carrier (APC) Market, by Type, 2020–2027
Table 29 Europe: Armoured Personnel Carrier (APC) Market, by Country, 2020–2027
Table 30 Europe: Armoured Personnel Carrier (APC) Market, by Configuration, 2020–2027
Table 31 Europe: Armoured Personnel Carrier (APC) Market, by End-User, 2020–2027
Table 32 Europe: Armoured Personnel Carrier (APC) Market, by Type, 2020–2027
Table 33 Asia-Pacific: Armoured Personnel Carrier (APC) Market, by Country, 2020–2027
Table 34 Asia-Pacific: Armoured Personnel Carrier (APC) Market, by Configuration, 2020–2027
Table 35 Asia-Pacific: Armoured Personnel Carrier (APC) Market, by End-User, 2020–2027
Table 36 Asia-Pacific: Armoured Personnel Carrier (APC) Market, by Type, 2020–2027
Table 37 Rest of the World: Armoured Personnel Carrier (APC) Market, by Region, 2020–2027
Table 38 Rest of the World: Armoured Personnel Carrier (APC) Market, by Configuration, 2020–2027
Table 39 Rest of the World: Armoured Personnel Carrier (APC) Market, by End-User, 2020–2027
Table 40 Rest of the World: Armoured Personnel Carrier (APC) Market, by Type, 2020–2027
List Of Figures
FIGURE 1 Research Process of MRFR
FIGURE 2 Top-Down & Bottom-Up Approaches
FIGURE 3 Market Dynamics
FIGURE 4 Impact Analysis: Market Drivers
FIGURE 5 Impact Analysis: Market Restraints
FIGURE 6 Porter's Five Forces Analysis
FIGURE 7 Value Chain Analysis
FIGURE 8 Global Armoured Personnel Carrier (APC) Market Share, by Configuration, 2020 (%)
FIGURE 9 Global Armoured Personnel Carrier (APC) Market, by Configuration, 2020–2027 (USD Million)
FIGURE 10 Global Armoured Personnel Carrier (APC) Market Share, by End-User, 2020 (%)
FIGURE 11 Global Armoured Personnel Carrier (APC) Market, by End-User, 2020–2027 (USD Million)
FIGURE 12 Global Armoured Personnel Carrier (APC) Market Share, by Type, 2020 (%)
FIGURE 13 Global Armoured Personnel Carrier (APC) Market, by Type, 2020–2027 (USD Million)
FIGURE 14 Global Armoured Personnel Carrier (APC) Market Share (%), By Region, 2020
FIGURE 15 Global Armoured Personnel Carrier (APC) Market, by Region, 2020–2027 (USD Million)
FIGURE 16 North America: Armoured Personnel Carrier (APC) Market Share (%), 2020
FIGURE 17 North America: Armoured Personnel Carrier (APC) Market by Country, 2020–2027 (USD Million)
FIGURE 18 Europe: Armoured Personnel Carrier (APC) Market Share (%), 2020
FIGURE 19 Europe: Armoured Personnel Carrier (APC) Market by Country, 2020–2027 (USD Million)
FIGURE 20 Asia-Pacific: Armoured Personnel Carrier (APC) Market Share (%), 2020
FIGURE 21 Asia-Pacific: Armoured Personnel Carrier (APC) Market by Country, 2020–2027 (USD Million)
FIGURE 22 Rest of the World Armoured Personnel Carrier (APC) Market Share (%), 2020
FIGURE 23 Rest of the World Armoured Personnel Carrier (APC) Market by Region, 2020–2027 (USD Million)