-
EXECUTIVE SUMMARY
-
1.1.
-
Market Attractiveness Analysis
-
Size
-
1.1.3.
-
Global Applied AI Market, By Component
-
Global Applied AI Market, By Organization
-
Global Applied AI Market, by Application Area
-
Global Applied AI Market, by Region
-
MARKET INTRODUCTION
-
Definition
-
Scope of the Study
-
Market Structure
-
Key Buying Criteria
-
Macro Factor Indicator
-
Analysis
-
3.
-
RESEARCH METHODOLOGY
-
3.1.
-
Research Process
-
3.2.
-
Primary Research
-
3.3.
-
Secondary Research
-
3.4.
-
Market Size Estimation
-
3.5.
-
Forecast Model
-
3.6.
-
List of Assumptions
-
4.
-
MARKET DYNAMICS
-
4.1.
-
Introduction
-
4.2.
-
Drivers
-
4.2.1.
-
Increasing Data Availability
-
impact analysis
-
4.4.
-
Opportunities
-
4.4.1.
-
Healthcare Transformation
-
(XAI)
-
4.5.2.
-
Federated Learning
-
4.5.3.
-
AI for Sustainability
-
4.5.4.
-
Trend impact analysis
-
4.6.
-
Challenges
-
4.6.1.
-
Bias and Fairness
-
4.6.2.
-
Regulatory Hurdles
-
4.6.3.
-
Ethical Dilemmas
-
4.6.4.
-
Challenge impact analysis
-
Sector
-
4.7.2.
-
Covid 19 analysis on RoI of Key Players
-
Advancements in Hardware
-
Cost Reduction and Efficiency
-
Driver impact analysis
-
Restraints
- Data Privacy Concerns
- Skill Shortage
- Integration Complexities
- Restraint
- Autonomous Systems
- Customer Experience Enhancement
- Opportunity impact analysis
-
Trends
- Explainable AI
-
Covid-19 Impact Analysis
- Covid 19 impact on IT & Telecommunication
- Covid 19 investment impact
-
MARKET FACTOR ANALYSIS
-
Value Chain Analysis/Supply Chain Analysis
-
Porter’s Five
- Bargaining Power of Buyers
- Threat of New Entrants
- Threat of Substitutes
- Intensity of Rivalry
-
Forces Model
-
5.2.1.
-
Bargaining Power of Suppliers
-
GLOBAL APPLIED AI MARKET, BY COMPONENT
-
Introduction
-
Software
- Machine Learning
- Natural Language Processing (NLP) Libraries
- Computer Vision Software
- Chatbot and Virtual
- AI-powered Content Generation Tools
- Emotion and Sentiment Analysis Software
- Image and Video
- Others
-
Libraries and Frameworks
-
Assistant Platforms
-
6.2.5.
-
Predictive Analytics Software
-
Analysis Software
-
6.2.9.
-
Automated Translation Software
-
Services
- AI Consulting and Strategy
- Data Science Services
- AI-driven Personalization Services
- Others
-
GLOBAL APPLIED AI
-
MARKET, BY ORGANIZATION SIZE
-
Introduction
-
Small & Medium Enterprise
-
Large Enterprise
-
GLOBAL APPLIED AI MARKET, BY APPLICATION AREA
-
Introduction
-
Healthcare
- Medical image
-
analysis
-
8.2.2.
-
Disease diagnosis
-
8.2.3.
-
Drug discovery
-
8.2.4.
-
Patient monitoring
-
8.2.5.
-
Personalized medicine
-
8.3.
-
Finance
-
8.3.1.
-
Algorithmic trading
-
8.3.2.
-
Fraud detection
-
8.3.3.
-
Credit scoring
-
8.3.4.
-
Risk assessment
-
8.3.5.
-
Financial forecasting
-
8.4.
-
Retail and E-commerce
-
8.4.1.
-
Recommendation systems
-
8.4.2.
-
Inventory management
-
8.4.3.
-
Demand forecasting
-
8.4.4.
-
Price optimization
-
8.4.5.
-
Customer segmentation
-
8.4.6.
-
Manufacturing and Industry
-
Predictive maintenance
- Quality control
- Process optimization
- Supply chain management
- Industrial robotics
-
Autonomous Vehicles
- Self-driving cars
- Traffic optimization
- Fleet management
- Object detection
- Navigation systems
-
Natural Language
- Sentiment analysis
- Language translation
- Text summarization
- Named entity recognition
-
Processing (NLP)
-
8.7.1.
-
Chatbots and virtual assistants
-
Energy and Utilities
- Energy consumption
- Fault detection
- Energy-efficient systems
-
optimization
-
8.8.2.
-
Smart grid management
-
8.8.3.
-
Renewable energy prediction
-
Agriculture
- Precision agriculture
- Crop disease detection
- Yield prediction
- Soil health monitoring
- Automated farming equipment
-
Cybersecurity
- Threat detection
- Anomaly detection
- Intrusion detection
- Malware analysis
- Identity verification
-
Education
- Personalized
- Assessment automation
- Learning analytics
- Plagiarism detection
-
learning
-
8.11.2.
-
Intelligent tutoring systems
-
Entertainment and Media
- Content recommendation
- Content generation
- Music and art
- Video analysis and tagging
-
creation
-
8.12.4.
-
Audience engagement analysis
-
Real Estate
- Property valuation
- Predicting housing market trends
- Property management
- Risk assessment
-
for loans
-
8.13.5.
-
Automated property tours
-
Transportation and Logistics
- Route optimization
- Load scheduling
- Predictive maintenance for vehicles
- Inventory management
- Last-mile delivery
- Air and water quality analysis
- Climate change modeling
- Wildlife conservation
- Deforestation monitoring
-
optimization
-
8.15.
-
Environmental Monitoring
-
tracking
-
8.15.4.
-
Disaster response planning
-
Human Resources
- Resume screening
- Employee performance analysis
- Diversity and inclusion
-
monitoring
-
8.16.4.
-
Talent acquisition
-
8.16.5.
-
Workforce planning
-
8.17.
-
Others
-
GLOBAL
-
APPLIED AI MARKET SIZE ESTIMATION & FORECAST, BY REGION
-
Introduction
-
North America
- Market Estimates & Forecast, by Country,
-
9.2.2.
-
Market Estimates & Forecast, By Component, 2019-2032
-
Size, 2019-2032
-
9.2.4.
-
Market Estimates & Forecast, By Organization
-
Market Estimates & Forecast, by Application Area, 2019-2032
-
9.2.5.2.
-
US
-
Market Estimates & Forecast, By Component,
-
Market Estimates & Forecast, By Organization Size, 2019-2032
-
Forecast, by Application Area, 2019-2032
-
9.2.6.2.
-
Market Estimates &
-
Canada
-
Market Estimates & Forecast, By Component,
-
Market Estimates & Forecast, By Organization Size, 2019-2032
-
Forecast, by Application Area, 2019-2032
-
9.2.7.2.
-
Market Estimates &
-
Mexico
-
Market Estimates & Forecast, By Component,
-
Market Estimates & Forecast, By Organization Size, 2019-2032
-
Forecast, by Application Area, 2019-2032
-
& Forecast, By Component, 2019-2032
-
Size, 2019-2032
-
9.3.4.
-
Market Estimates &
-
Europe
- Market Estimates & Forecast, by Country, 2019-2032
- Market Estimates
- Market Estimates & Forecast, By Organization
-
Market Estimates & Forecast, by Application Area, 2019-2032
-
9.3.5.2.
-
UK
-
Market Estimates & Forecast, By Component,
-
Market Estimates & Forecast, By Organization Size, 2019-2032
-
Forecast, by Application Area, 2019-2032
-
9.3.6.2.
-
Market Estimates &
-
Germany
-
Market Estimates & Forecast, By Component,
-
Market Estimates & Forecast, By Organization Size, 2019-2032
-
Forecast, by Application Area, 2019-2032
-
9.3.7.2.
-
Market Estimates &
-
France
-
Market Estimates & Forecast, By Component,
-
Market Estimates & Forecast, By Organization Size, 2019-2032
-
Forecast, by Application Area, 2019-2032
-
9.3.8.2.
-
Market Estimates &
-
Italy
-
Market Estimates & Forecast, By Component,
-
Market Estimates & Forecast, By Organization Size, 2019-2032
-
Forecast, by Application Area, 2019-2032
-
9.3.9.2.
-
Market Estimates &
-
Spain
-
Market Estimates & Forecast, By Component,
-
Market Estimates & Forecast, By Organization Size, 2019-2032
-
Forecast, by Application Area, 2019-2032
-
9.3.10.2.
-
Market Estimates &
-
Rest of Europe
-
Market Estimates & Forecast, By Component,
-
Market Estimates & Forecast, By Organization Size, 2019-2032
-
Forecast, by Application Area, 2019-2032
-
9.4.2.
-
Market Estimates &
-
Asia-Pacific
- Market Estimates & Forecast, by Country,
-
Market Estimates & Forecast, By Component, 2019-2032
-
Size, 2019-2032
-
9.4.4.
-
Market Estimates & Forecast, By Organization
-
Market Estimates & Forecast, by Application Area, 2019-2032
-
Forecast, By Component, 2019-2032
-
& Forecast, by Application Area, 2019-2032
-
9.4.6.2.
-
China
-
Market Estimates &
-
Market Estimates & Forecast, By Organization Size, 2019-2032
-
Market Estimates
-
Japan
-
Market Estimates & Forecast, By Component,
-
Market Estimates & Forecast, By Organization Size, 2019-2032
-
Forecast, by Application Area, 2019-2032
-
9.4.7.2.
-
Market Estimates &
-
India
-
Market Estimates & Forecast, By Component,
-
Market Estimates & Forecast, By Organization Size, 2019-2032
-
Forecast, by Application Area, 2019-2032
-
9.4.8.2.
-
Market Estimates &
-
Australia
-
Market Estimates & Forecast, By Component,
-
Market Estimates & Forecast, By Organization Size, 2019-2032
-
Forecast, by Application Area, 2019-2032
-
9.4.9.2.
-
Market Estimates &
-
Rest of Asia-Pacific
-
Market Estimates & Forecast, By Component,
-
Market Estimates & Forecast, By Organization Size, 2019-2032
-
Forecast, by Application Area, 2019-2032
-
9.5.2.
-
Market Estimates &
-
Rest of the World
- Market Estimates & Forecast, by Country,
-
Market Estimates & Forecast, By Component, 2019-2032
-
Size, 2019-2032
-
9.5.4.
-
Market Estimates & Forecast, By Organization
-
Market Estimates & Forecast, by Application Area, 2019-2032
-
& Forecast, By Component, 2019-2032
-
Size, 2019-2032
-
9.5.5.3.
-
Middle East
-
Market Estimates
-
Market Estimates & Forecast, By Organization
-
Market Estimates & Forecast, by Application Area, 2019-2032
-
Forecast, By Component, 2019-2032
-
& Forecast, by Application Area, 2019-2032
-
9.5.7.2.
-
Africa
-
Market Estimates &
-
Market Estimates & Forecast, By Organization Size, 2019-2032
-
Market Estimates
-
Latin America
-
Market Estimates & Forecast, By Component,
-
Market Estimates & Forecast, By Organization Size, 2019-2032
-
Forecast, by Application Area, 2019-2032
-
Market Estimates &
-
COMPETITIVE LANDSCAPE
-
Introduction
-
Key Developments & Growth Strategies
-
Competitor Benchmarking
-
Vendor Share Analysis,
- Key Developments
- SWOT Analysis
- Key Strategies
-
11.
-
COMPANY PROFILES
-
11.1.
-
Google (Alphabet Inc.)
-
11.1.1.
-
Company Overview
-
11.1.2.
-
Financial Overview
-
11.1.3.
-
Solution/Services Offered
-
Microsoft
- Company Overview
- Financial Overview
- Solution/Services Offered
- Key Developments
- SWOT Analysis
- Key Strategies
-
IBM
- Company Overview
- Financial Overview
- Solution/Services
- Company Overview
- Financial Overview
- Solution/Services Offered
- Key Developments
- SWOT Analysis
- Key Strategies
-
Offered
-
11.3.4.
-
Key Developments
-
11.3.5.
-
SWOT Analysis
-
11.3.6.
-
Key Strategies
-
11.4.
-
Amazon Web Services (AWS)
-
Meta
- Company Overview
- Financial Overview
- Solution/Services
- Key Developments
- SWOT Analysis
- Key Strategies
-
Offered
-
11.5.4.
-
Key Developments
-
11.5.5.
-
SWOT Analysis
-
11.5.6.
-
Key Strategies
-
11.6.
-
Apple
-
11.6.1.
-
Company Overview
-
11.6.2.
-
Financial Overview
-
11.6.3.
-
Solution/Services Offered
-
NVIDIA
- Company Overview
- Financial Overview
- Solution/Services Offered
- Key Developments
- SWOT Analysis
- Key Strategies
-
Intel
- Company Overview
- Financial Overview
- Solution/Services
- Key Developments
- SWOT Analysis
- Key Strategies
-
Offered
-
11.8.4.
-
Key Developments
-
11.8.5.
-
SWOT Analysis
-
11.8.6.
-
Key Strategies
-
11.9.
-
OpenAI
-
11.9.1.
-
Company Overview
-
11.9.2.
-
Financial Overview
-
11.9.3.
-
Solution/Services Offered
-
Baidu
- Company Overview
- Financial Overview
- Solution/Services Offered
- Key Developments
- SWOT Analysis
- Key Strategies
-
Company 11
- Company Overview
- Financial Overview
- Solution/Services
- Key Developments
- SWOT Analysis
- Key Strategies
-
Offered
-
11.11.4.
-
Key Developments
-
11.11.5.
-
SWOT Analysis
-
11.11.6.
-
Key Strategies
-
11.12.
-
Company 12
-
11.12.1.
-
Company Overview
-
11.12.2.
-
Financial Overview
-
11.12.3.
-
Solution/Services Offered
-
Company 13
- Company Overview
- Financial Overview
- Solution/Services Offered
- Key Developments
- SWOT Analysis
- Key Strategies
-
Company 14
- Company Overview
- Financial Overview
- Solution/Services
- Key Developments
- SWOT Analysis
- Key Strategies
-
Offered
-
11.14.4.
-
Key Developments
-
11.14.5.
-
SWOT Analysis
-
11.14.6.
-
Key Strategies
-
11.15.
-
Company 15
-
11.15.1.
-
Company Overview
-
11.15.2.
-
Financial Overview
-
11.15.3.
-
Solution/Services Offered
-
LIST OF TABLES
-
GLOBAL APPLIED AI MARKET, BY COMPONENT, 2019–2032
-
(USD MILLION)
-
TABLE
-
GLOBAL APPLIED AI MARKET, BY ORGANIZATION SIZE, 2019–2032 (USD MILLION)
-
GLOBAL
-
APPLIED AI MARKET, BY ORGANIZATION SIZE, 2019–2032 (USD MILLION)
-
GLOBAL APPLIED
-
AI MARKET, BY APPLICATION AREA, 2019–2032 (USD MILLION)
-
GLOBAL APPLIED AI MARKET,
-
BY APPLICATION AREA, 2019–2032 (USD MILLION)
-
GLOBAL APPLIED AI MARKET, BY REGION, 2019–2032
-
(USD MILLION)
-
TABLE
-
NORTH AMERICA APPLIED AI MARKET, BY COUNTRY, 2019–2032 (USD MILLION)
-
NORTH AMERICA
-
APPLIED AI MARKET, BY COMPONENT, 2019–2032 (USD MILLION)
-
NORTH AMERICA APPLIED
-
AI MARKET, BY ORGANIZATION SIZE, 2019–2032 (USD MILLION)
-
NORTH AMERICA APPLIED
-
AI MARKET, BY ORGANIZATION SIZE, 2019–2032 (USD MILLION)
-
NORTH AMERICA APPLIED
-
AI MARKET, BY APPLICATION AREA, 2019–2032 (USD MILLION)
-
NORTH AMERICA APPLIED
-
AI MARKET, BY APPLICATION AREA, 2019–2032 (USD MILLION)
-
US APPLIED AI MARKET,
-
BY COMPONENT, 2019–2032 (USD MILLION)
-
US APPLIED AI MARKET, BY ORGANIZATION SIZE,
-
US APPLIED AI MARKET, BY ORGANIZATION SIZE, 2019–2032
-
(USD MILLION)
-
TABLE
-
US APPLIED AI MARKET, BY APPLICATION AREA, 2019–2032 (USD MILLION)
-
US APPLIED AI
-
MARKET, BY APPLICATION AREA, 2019–2032 (USD MILLION)
-
CANADA APPLIED AI MARKET, BY COMPONENT,
-
CANADA APPLIED AI MARKET, BY ORGANIZATION SIZE, 2019–2032
-
(USD MILLION)
-
TABLE
-
CANADA APPLIED AI MARKET, BY ORGANIZATION SIZE, 2019–2032 (USD MILLION)
-
CANADA
-
APPLIED AI MARKET, BY APPLICATION AREA, 2019–2032 (USD MILLION)
-
CANADA APPLIED
-
AI MARKET, BY APPLICATION AREA, 2019–2032 (USD MILLION)
-
MEXICO APPLIED AI MARKET,
-
BY COMPONENT, 2019–2032 (USD MILLION)
-
MEXICO APPLIED AI MARKET, BY ORGANIZATION
-
SIZE, 2019–2032 (USD MILLION)
-
MEXICO APPLIED AI MARKET, BY ORGANIZATION SIZE,
-
MEXICO APPLIED AI MARKET, BY APPLICATION AREA, 2019–2032
-
(USD MILLION)
-
TABLE
-
MEXICO APPLIED AI MARKET, BY APPLICATION AREA, 2019–2032 (USD MILLION)
-
EUROPE
-
APPLIED AI MARKET, BY COUNTRY, 2019–2032 (USD MILLION)
-
EUROPE APPLIED AI MARKET,
-
BY COMPONENT, 2019–2032 (USD MILLION)
-
EUROPE APPLIED AI MARKET, BY ORGANIZATION
-
SIZE, 2019–2032 (USD MILLION)
-
EUROPE APPLIED AI MARKET, BY ORGANIZATION SIZE,
-
EUROPE APPLIED AI MARKET, BY APPLICATION AREA, 2019–2032
-
(USD MILLION)
-
TABLE
-
EUROPE APPLIED AI MARKET, BY APPLICATION AREA, 2019–2032 (USD MILLION)
-
GERMANY
-
APPLIED AI MARKET, BY COMPONENT, 2019–2032 (USD MILLION)
-
GERMANY APPLIED AI MARKET,
-
BY ORGANIZATION SIZE, 2019–2032 (USD MILLION)
-
GERMANY APPLIED AI MARKET, BY ORGANIZATION
-
SIZE, 2019–2032 (USD MILLION)
-
GERMANY APPLIED AI MARKET, BY APPLICATION AREA,
-
GERMANY APPLIED AI MARKET, BY APPLICATION AREA, 2019–2032
-
(USD MILLION)
-
TABLE
-
UK APPLIED AI MARKET, BY COMPONENT, 2019–2032 (USD MILLION)
-
UK APPLIED AI
-
MARKET, BY ORGANIZATION SIZE, 2019–2032 (USD MILLION)
-
UK APPLIED AI MARKET, BY ORGANIZATION SIZE,
-
UK APPLIED AI MARKET, BY APPLICATION AREA, 2019–2032
-
(USD MILLION)
-
TABLE
-
UK APPLIED AI MARKET, BY APPLICATION AREA, 2019–2032 (USD MILLION)
-
FRANCE APPLIED
-
AI MARKET, BY COMPONENT, 2019–2032 (USD MILLION)
-
FRANCE APPLIED AI MARKET, BY ORGANIZATION
-
SIZE, 2019–2032 (USD MILLION)
-
FRANCE APPLIED AI MARKET, BY ORGANIZATION SIZE,
-
FRANCE APPLIED AI MARKET, BY APPLICATION AREA, 2019–2032
-
(USD MILLION)
-
TABLE
-
FRANCE APPLIED AI MARKET, BY APPLICATION AREA, 2019–2032 (USD MILLION)
-
ITALY
-
APPLIED AI MARKET, BY COMPONENT, 2019–2032 (USD MILLION)
-
ITALY APPLIED AI MARKET,
-
BY ORGANIZATION SIZE, 2019–2032 (USD MILLION)
-
ITALY APPLIED AI MARKET, BY ORGANIZATION
-
SIZE, 2019–2032 (USD MILLION)
-
ITALY APPLIED AI MARKET, BY APPLICATION AREA, 2019–2032
-
(USD MILLION)
-
TABLE
-
ITALY APPLIED AI MARKET, BY APPLICATION AREA, 2019–2032 (USD MILLION)
-
SPAIN APPLIED
-
AI MARKET, BY COMPONENT, 2019–2032 (USD MILLION)
-
SPAIN APPLIED AI MARKET, BY ORGANIZATION
-
SIZE, 2019–2032 (USD MILLION)
-
SPAIN APPLIED AI MARKET, BY ORGANIZATION SIZE,
-
SPAIN APPLIED AI MARKET, BY APPLICATION AREA, 2019–2032
-
(USD MILLION)
-
TABLE
-
SPAIN APPLIED AI MARKET, BY APPLICATION AREA, 2019–2032 (USD MILLION)
-
REST OF EUROPE
-
APPLIED AI MARKET, BY COMPONENT, 2019–2032 (USD MILLION)
-
REST OF EUROPE APPLIED
-
AI MARKET, BY ORGANIZATION SIZE, 2019–2032 (USD MILLION)
-
REST OF EUROPE APPLIED
-
AI MARKET, BY ORGANIZATION SIZE, 2019–2032 (USD MILLION)
-
REST OF EUROPE APPLIED
-
AI MARKET, BY APPLICATION AREA, 2019–2032 (USD MILLION)
-
REST OF EUROPE APPLIED
-
AI MARKET, BY APPLICATION AREA, 2019–2032 (USD MILLION)
-
ASIA PACIFIC APPLIED
-
AI MARKET, BY COUNTRY, 2019–2032 (USD MILLION)
-
ASIA PACIFIC APPLIED AI MARKET, BY COMPONENT,
-
ASIA PACIFIC APPLIED AI MARKET, BY ORGANIZATION SIZE, 2019–2032
-
(USD MILLION)
-
TABLE
-
ASIA PACIFIC APPLIED AI MARKET, BY ORGANIZATION SIZE, 2019–2032 (USD MILLION)
-
ASIA
-
PACIFIC APPLIED AI MARKET, BY APPLICATION AREA, 2019–2032 (USD MILLION)
-
ASIA PACIFIC
-
APPLIED AI MARKET, BY APPLICATION AREA, 2019–2032 (USD MILLION)
-
CHINA APPLIED
-
AI MARKET, BY COMPONENT, 2019–2032 (USD MILLION)
-
CHINA APPLIED AI MARKET, BY ORGANIZATION
-
SIZE, 2019–2032 (USD MILLION)
-
CHINA APPLIED AI MARKET, BY ORGANIZATION SIZE,
-
CHINA APPLIED AI MARKET, BY APPLICATION AREA, 2019–2032
-
(USD MILLION)
-
TABLE
-
CHINA APPLIED AI MARKET, BY APPLICATION AREA, 2019–2032 (USD MILLION)
-
INDIA APPLIED
-
AI MARKET, BY COMPONENT, 2019–2032 (USD MILLION)
-
INDIA APPLIED AI MARKET, BY ORGANIZATION
-
SIZE, 2019–2032 (USD MILLION)
-
INDIA APPLIED AI MARKET, BY ORGANIZATION SIZE,
-
INDIA APPLIED AI MARKET, BY APPLICATION AREA, 2019–2032
-
(USD MILLION)
-
TABLE
-
INDIA APPLIED AI MARKET, BY APPLICATION AREA, 2019–2032 (USD MILLION)
-
JAPAN APPLIED
-
AI MARKET, BY COMPONENT, 2019–2032 (USD MILLION)
-
JAPAN APPLIED AI MARKET, BY ORGANIZATION
-
SIZE, 2019–2032 (USD MILLION)
-
JAPAN APPLIED AI MARKET, BY ORGANIZATION SIZE,
-
JAPAN APPLIED AI MARKET, BY APPLICATION AREA, 2019–2032
-
(USD MILLION)
-
TABLE
-
JAPAN APPLIED AI MARKET, BY APPLICATION AREA, 2019–2032 (USD MILLION)
-
AUSTRALIA APPLIED
-
AI MARKET, BY COMPONENT, 2019–2032 (USD MILLION)
-
AUSTRALIA APPLIED AI MARKET, BY ORGANIZATION
-
SIZE, 2019–2032 (USD MILLION)
-
AUSTRALIA APPLIED AI MARKET, BY ORGANIZATION SIZE,
-
AUSTRALIA APPLIED AI MARKET, BY APPLICATION AREA, 2019–2032
-
(USD MILLION)
-
TABLE
-
AUSTRALIA APPLIED AI MARKET, BY APPLICATION AREA, 2019–2032 (USD MILLION)
-
REST
-
FO ASIA PACIFIC APPLIED AI MARKET, BY COMPONENT, 2019–2032 (USD MILLION)
-
REST FO ASIA
-
PACIFIC APPLIED AI MARKET, BY ORGANIZATION SIZE, 2019–2032 (USD MILLION)
-
REST FO ASIA
-
PACIFIC APPLIED AI MARKET, BY ORGANIZATION SIZE, 2019–2032 (USD MILLION)
-
REST FO ASIA
-
PACIFIC APPLIED AI MARKET, BY APPLICATION AREA, 2019–2032 (USD MILLION)
-
REST FO ASIA
-
PACIFIC APPLIED AI MARKET, BY APPLICATION AREA, 2019–2032 (USD MILLION)
-
REST FO THE
-
WORLD APPLIED AI MARKET, BY COMPONENT, 2019–2032 (USD MILLION)
-
REST FO THE
-
WORLD APPLIED AI MARKET, BY ORGANIZATION SIZE, 2019–2032 (USD MILLION)
-
REST FO THE
-
WORLD APPLIED AI MARKET, BY ORGANIZATION SIZE, 2019–2032 (USD MILLION)
-
REST FO THE
-
WORLD APPLIED AI MARKET, BY APPLICATION AREA, 2019–2032 (USD MILLION)
-
REST FO THE
-
WORLD APPLIED AI MARKET, BY APPLICATION AREA, 2019–2032 (USD MILLION)
-
MIDDLE EAST
-
APPLIED AI MARKET, BY COMPONENT, 2019–2032 (USD MILLION)
-
MIDDLE EAST APPLIED
-
AI MARKET, BY ORGANIZATION SIZE, 2019–2032 (USD MILLION)
-
MIDDLE EAST APPLIED
-
AI MARKET, BY ORGANIZATION SIZE, 2019–2032 (USD MILLION)
-
MIDDLE EAST APPLIED
-
AI MARKET, BY APPLICATION AREA, 2019–2032 (USD MILLION)
-
MIDDLE EAST APPLIED
-
AI MARKET, BY APPLICATION AREA, 2019–2032 (USD MILLION)
-
AFRICA APPLIED AI MARKET,
-
BY COMPONENT, 2019–2032 (USD MILLION)
-
AFRICA APPLIED AI MARKET, BY ORGANIZATION
-
SIZE, 2019–2032 (USD MILLION)
-
AFRICA APPLIED AI MARKET, BY ORGANIZATION SIZE,
-
AFRICA APPLIED AI MARKET, BY APPLICATION AREA, 2019–2032
-
(USD MILLION)
-
TABLE
-
AFRICA APPLIED AI MARKET, BY APPLICATION AREA, 2019–2032 (USD MILLION)
-
TABLE 109
-
SOUTH AMERICA APPLIED AI MARKET, BY COMPONENT, 2019–2032 (USD MILLION)
-
SOUTH AMERICA
-
APPLIED AI MARKET, BY ORGANIZATION SIZE, 2019–2032 (USD MILLION)
-
SOUTH AMERICA
-
APPLIED AI MARKET, BY ORGANIZATION SIZE, 2019–2032 (USD MILLION)
-
SOUTH AMERICA
-
APPLIED AI MARKET, BY APPLICATION AREA, 2019–2032 (USD MILLION)
-
SOUTH AMERICA
-
APPLIED AI MARKET, BY APPLICATION AREA, 2019–2032 (USD MILLION)
-
PARTNERSHIPS/AGREEMENTS/CONTRACTS/COLLABORATIONS
-
TABLE 115
-
BUSINESS EXPANSIONS/ACQUISITIONS
-
PRODUCT LAUNCHES/DEVELOPMENTS
-
GOOGLE (ALPHABET INC.): PRODUCTS OFFERED
-
TABLE 118
-
GOOGLE (ALPHABET INC.): KEY DEVELOPMENT
-
MICROSOFT: PRODUCTS OFFERED
-
MICROSOFT: KEY DEVELOPMENT
-
IBM: PRODUCTS
-
OFFERED
-
TABLE
-
IBM: KEY DEVELOPMENT
-
AMAZON WEB SERVICES (AWS): PRODUCTS OFFERED
-
AMAZON WEB SERVICES
-
(AWS): KEY DEVELOPMENT
-
TABLE
-
META: PRODUCTS OFFERED
-
META: KEY DEVELOPMENT
-
APPLE: PRODUCTS OFFERED
-
APPLE: KEY DEVELOPMENT
-
NVIDIA: PRODUCTS
-
OFFERED
-
TABLE
-
NVIDIA: KEY DEVELOPMENT
-
INTEL: PRODUCTS OFFERED
-
INTEL: KEY DEVELOPMENT
-
OPENAI: PRODUCTS OFFERED
-
TABLE 134
-
OPENAI: KEY DEVELOPMENT
-
BAIDU: PRODUCTS OFFERED
-
BAIDU: KEY DEVELOPMENT
-
COMPANY 11: PRODUCTS
-
OFFERED
-
TABLE
-
COMPANY 11: KEY DEVELOPMENT
-
COMPANY 12: PRODUCTS OFFERED
-
COMPANY 12: KEY DEVELOPMENT
-
COMPANY 13: PRODUCTS
-
OFFERED
-
TABLE
-
COMPANY 13: KEY DEVELOPMENT
-
COMPANY 14: PRODUCTS OFFERED
-
COMPANY 14: KEY DEVELOPMENT
-
COMPANY 15: PRODUCTS
-
OFFERED
-
TABLE
-
COMPANY 15: KEY DEVELOPMENT
-
LIST
-
OF FIGURES
-
FIGURE
-
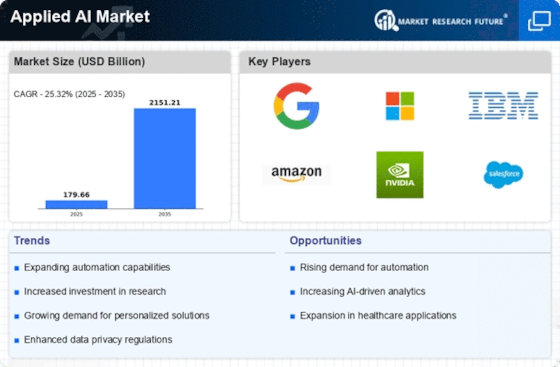
MARKET SYNOPSIS
-
FIGURE
-
MARKET STRUCTURE: GLOBAL APPLIED AI MARKET
-
BOTTOM-UP AND TOP-DOWN APPROACHES
-
MARKET DYNAMIC
-
ANALYSIS OF THE GLOBAL APPLIED AI MARKET
-
DRIVER IMPACT ANALYSIS
-
RESTRAINTS IMPACT ANALYSIS
-
GLOBAL
-
APPLIED AI MARKET: VALUE CHAIN
-
GLOBAL APPLIED AI MARKET, BY COMPONENT, 2022 (% SHARE)
-
GLOBAL APPLIED
-
AI MARKET, BY COMPONENT, 2022 VS 2032 (USD MILLION)
-
GLOBAL APPLIED AI MARKET, BY ORGANIZATION
-
SIZE, 2022 (% SHARE)
-
FIGURE
-
GLOBAL APPLIED AI MARKET, BY ORGANIZATION SIZE, 2022 VS 2032 (USD MILLION)
-
GLOBAL APPLIED
-
AI MARKET, BY ORGANIZATION SIZE, 2022 (% SHARE)
-
GLOBAL APPLIED AI MARKET, BY ORGANIZATION
-
SIZE, 2022 VS 2032 (USD MILLION)
-
GLOBAL APPLIED AI MARKET, BY APPLICATION AREA, 2022 (% SHARE)
-
FIGURE 13
-
GLOBAL APPLIED AI MARKET, BY APPLICATION AREA, 2022 VS 2032 (USD MILLION)
-
GLOBAL APPLIED
-
AI MARKET, BY APPLICATION AREA, 2022 (% SHARE)
-
GLOBAL APPLIED AI MARKET, BY APPLICATION
-
AREA, 2022 VS 2032 (USD MILLION)
-
GLOBAL APPLIED AI MARKET, BY REGION, 2022 (% SHARE)
-
GLOBAL APPLIED
-
AI MARKET, BY REGION, 2022 VS 2032 (USD MILLION)
-
NORTH AMERICA APPLIED AI MARKET, BY COUNTRY,
-
FIGURE
-
NORTH AMERICA APPLIED AI MARKET, BY COUNTRY, 2022 VS 2032 (USD MILLION)
-
NORTH AMERICA
-
APPLIED AI MARKET, BY COMPONENT, 2019-2032 (USD MILLION)
-
NORTH AMERICA APPLIED AI MARKET, BY ORGANIZATION
-
SIZE, 2019-2032 (USD MILLION)
-
NORTH AMERICA APPLIED AI MARKET, BY ORGANIZATION SIZE, 2019-2032
-
(USD MILLION)
-
FIGURE
-
NORTH AMERICA APPLIED AI MARKET, BY APPLICATION AREA, 2019-2032 (USD MILLION)
-
FIGURE 24
-
NORTH AMERICA APPLIED AI MARKET, BY APPLICATION AREA, 2019-2032 (USD MILLION)
-
EUROPE APPLIED
-
AI MARKET, BY COUNTRY, 2022 (% SHARE)
-
EUROPE APPLIED AI MARKET, BY COUNTRY, 2022 VS
-
FIGURE
-
EUROPE APPLIED AI MARKET, BY COMPONENT, 2019-2032 (USD MILLION)
-
EUROPE APPLIED AI MARKET,
-
BY ORGANIZATION SIZE, 2019-2032 (USD MILLION)
-
EUROPE APPLIED AI MARKET, BY ORGANIZATION
-
SIZE, 2019-2032 (USD MILLION)
-
EUROPE APPLIED AI MARKET, BY APPLICATION AREA, 2019-2032
-
(USD MILLION)
-
FIGURE
-
EUROPE APPLIED AI MARKET, BY APPLICATION AREA, 2019-2032 (USD MILLION)
-
ASIA PACIFIC
-
APPLIED AI MARKET, BY COUNTRY, 2022 (% SHARE)
-
ASIA PACIFIC APPLIED AI MARKET, BY COUNTRY,
-
ASIA PACIFIC APPLIED AI MARKET, BY COMPONENT, 2019-2032 (USD
-
MILLION)
-
FIGURE
-
ASIA PACIFIC APPLIED AI MARKET, BY ORGANIZATION SIZE, 2019-2032 (USD MILLION)
-
FIGURE 36
-
ASIA PACIFIC APPLIED AI MARKET, BY ORGANIZATION SIZE, 2019-2032 (USD MILLION)
-
ASIA PACIFIC
-
APPLIED AI MARKET, BY APPLICATION AREA, 2019-2032 (USD MILLION)
-
ASIA PACIFIC APPLIED
-
AI MARKET, BY APPLICATION AREA, 2019-2032 (USD MILLION)
-
REST OF THE WORLD APPLIED AI MARKET, BY
-
COMPONENT, 2019-2032 (USD MILLION)
-
REST OF THE WORLD APPLIED AI MARKET, BY ORGANIZATION
-
SIZE, 2019-2032 (USD MILLION)
-
REST OF THE WORLD APPLIED AI MARKET, BY ORGANIZATION SIZE,
-
REST OF THE WORLD APPLIED AI MARKET, BY APPLICATION AREA,
-
REST OF THE WORLD APPLIED AI MARKET, BY APPLICATION AREA,
-
MIDDLE EAST APPLIED AI MARKET, BY COMPONENT, 2019-2032 (USD
-
MILLION)
-
FIGURE
-
MIDDLE EAST APPLIED AI MARKET, BY ORGANIZATION SIZE, 2019-2032 (USD MILLION)
-
FIGURE 46
-
MIDDLE EAST APPLIED AI MARKET, BY ORGANIZATION SIZE, 2019-2032 (USD MILLION)
-
MIDDLE EAST
-
APPLIED AI MARKET, BY APPLICATION AREA, 2019-2032 (USD MILLION)
-
MIDDLE EAST APPLIED
-
AI MARKET, BY APPLICATION AREA, 2019-2032 (USD MILLION)
-
AFRICA APPLIED AI MARKET, BY COMPONENT,
-
AFRICA APPLIED AI MARKET, BY ORGANIZATION SIZE, 2019-2032
-
(USD MILLION)
-
FIGURE
-
AFRICA APPLIED AI MARKET, BY ORGANIZATION SIZE, 2019-2032 (USD MILLION)
-
AFRICA APPLIED
-
AI MARKET, BY APPLICATION AREA, 2019-2032 (USD MILLION)
-
AFRICA APPLIED AI MARKET, BY APPLICATION
-
AREA, 2019-2032 (USD MILLION)
-
SOUTH AMERICA APPLIED AI MARKET, BY COMPONENT, 2019-2032
-
(USD MILLION)
-
FIGURE
-
SOUTH AMERICA APPLIED AI MARKET, BY ORGANIZATION SIZE, 2019-2032 (USD MILLION)
-
FIGURE 56
-
SOUTH AMERICA APPLIED AI MARKET, BY ORGANIZATION SIZE, 2019-2032 (USD MILLION)
-
SOUTH AMERICA
-
APPLIED AI MARKET, BY APPLICATION AREA, 2019-2032 (USD MILLION)
-
SOUTH AMERICA APPLIED
-
AI MARKET, BY APPLICATION AREA, 2019-2032 (USD MILLION)
-
GLOBAL APPLIED AI MARKET: COMPETITIVE BENCHMARKING
-
FIGURE 60
-
VENDOR SHARE ANALYSIS, 2022 (%)
-
GOOGLE (ALPHABET INC.): FINANCIAL OVERVIEW SNAPSHOT
-
GOOGLE (ALPHABET
-
INC.): SWOT ANALYSIS
-
FIGURE
-
MICROSOFT: FINANCIAL OVERVIEW SNAPSHOT
-
MICROSOFT: SWOT ANALYSIS
-
IBM: FINANCIAL OVERVIEW
-
SNAPSHOT
-
FIGURE
-
IBM: SWOT ANALYSIS
-
FIGURE
-
AMAZON WEB SERVICES (AWS): FINANCIAL OVERVIEW SNAPSHOT
-
AMAZON WEB SERVICES (AWS): SWOT ANALYSIS
-
META: FINANCIAL
-
OVERVIEW SNAPSHOT
-
FIGURE
-
META: SWOT ANALYSIS
-
FIGURE
-
APPLE: FINANCIAL OVERVIEW SNAPSHOT
-
APPLE: SWOT ANALYSIS
-
NVIDIA: FINANCIAL OVERVIEW SNAPSHOT
-
NVIDIA: SWOT
-
ANALYSIS
-
FIGURE
-
INTEL: FINANCIAL OVERVIEW SNAPSHOT
-
INTEL: SWOT ANALYSIS
-
OPENAI: FINANCIAL OVERVIEW SNAPSHOT
-
OPENAI: SWOT
-
ANALYSIS
-
FIGURE
-
BAIDU: FINANCIAL OVERVIEW SNAPSHOT
-
BAIDU: SWOT ANALYSIS
-
COMPANY 11 : FINANCIAL OVERVIEW SNAPSHOT
-
COMPANY 11:
-
SWOT ANALYSIS
-
FIGURE
-
COMPANY 12: FINANCIAL OVERVIEW SNAPSHOT
-
COMPANY 12: SWOT ANALYSIS
-
COMPANY 13: FINANCIAL
-
OVERVIEW SNAPSHOT
-
FIGURE
-
COMPANY 13: SWOT ANALYSIS
-
COMPANY 14: FINANCIAL OVERVIEW SNAPSHOT
-
COMPANY 14: SWOT ANALYSIS
-
COMPANY 15:
-
FINANCIAL OVERVIEW SNAPSHOT
-
COMPANY 15: SWOT ANALYSIS
-
NOTE:
-
This table of content is tentative and subject to change
-
as the research progresses.
-
In section 15, only the top 15 companies will be profiled. Each company
-
will be profiled based on the Market Overview, Financials, Service Portfolio, Business
-
Strategies, and Recent Developments parameters.
-
The companies are selected based on two broad criteria¬–
-
strength of product portfolio and excellence in business strategies.
-
Key parameters considered for
-
evaluating strength of the vendor’s product portfolio are industry experience,
-
product capabilities/features, innovations/R&D investment, flexibility to customize
-
the product, ability to integrate with other systems, pre- and post-sale services,
-
and customer ratings/feedback.
-
Key parameters considered for evaluating a vendor’s excellence
-
in business strategy are its market share, global presence, customer base, partner
-
ecosystem (technology alliances/resellers/distributors), acquisitions, and marketing
-
strategies/investments.
-
The financial details of the company cannot be provided if the information
-
is not available in the public domain and or from reliable sources.
Leave a Comment