×
  • Cat-intel
  • MedIntelliX
  • Resources
  • About Us
  • Hero Background
    English
    Chinese
    French
    Japanese
    Korean
    German
    Spanish

    Applied AI in Agriculture Market Trends

    ID: MRFR/ICT/10647-HCR
    128 Pages
    Shubham Munde
    October 2025

    Applied AI in Agriculture Market Research Report: By Technology (Machine Learning, Computer Vision, and Predictive Analytics), By Offering (Software and AI-as-a-Service), By Application (Drone Analytics and Precision Farming) By Region (North America, Europe, Asia-Pacific, Middle East & Africa, and South America), Market Forecast Till 2035.

    Share:
    Download PDF ×

    We do not share your information with anyone. However, we may send you emails based on your report interest from time to time. You may contact us at any time to opt-out.

    Applied AI in Agriculture Market Infographic
    Purchase Options

    Market Trends

    Key Emerging Trends in the Applied AI in Agriculture Market

    There are multiple ways via which different firms seek to establish and improve on their market share in the constantly changing landscape of applied artificial intelligence (AI) in agriculture market share. Specifically, technological innovations become central as corporations aim at developing and offering artificial intelligence products with advanced features and capabilities aligned towards specific needs within this sector. This involves exploiting breakthroughs made using machine learning algorithms including image recognition techniques which have enhanced resource utilization efficiency for sustainable cropping systems based upon minimal input rates; yield optimization programs designed around modern analytic tools such as big data analytics used together alongside traditional crop modelling approaches which combine simulation modeling outputs from software packages like CERES maize or APSIM soybean over subsequent seasons until convergence occurs; etc.

    Market share positioning depends on pricing strategies on a large scale within Artificial Intelligence (AI) applied to Agriculture trade. While some firms focus on leadership through cost reduction by providing less costly options than rivals do targeting discerning customers who want cheap but quality stuffs others sell highly priced premium offerings featuring attributes such as predictive analysis, site-specific agriculture or comprehensive datasets. By targeting specific agribusinesses in preference of top quality AI solutions, these businesses develop niche markets willing to pay a premium for sophisticated personalized artificial intelligence solutions.

    Collaborations and strategic partnerships are key determinants of market share positioning in the Applied AI in Agriculture Market. Companies often form alliances with agricultural technology providers, equipment manufacturers, or research institutions to better integrate and use their AI solutions within the farm ecosystem. When these all come into place, there will be a broader base of services that can work together rather than work against one another and it can increase market reach by farmers and address specific needs of different types of farming systems. Additionally, large scale farming operations or agricultural cooperatives act as stable income streams besides enhancing further the market presence.

    In order to gain more shares on the market dominated by applied artificial Intelligence (AI) in agriculture; several organizations have adopted different approaches aimed at ensuring customer satisfaction among end-users. Building long lasting relationships through user-friendly interfaces that provide actionable information along with responsive assistance is considered as one way towards maintaining farmer priorities and delivering value to them through appropriate strategies developed over time. Businesses that focus more on user experience gain customer loyalty while those who emphasize on great experiences benefit from greater word-of-mouth outreaches that lead to positive feedbacks expanding their territories. Therefore they target their products specifically at certain agricultural tasks or uses thus giving them a competitive advantage.

    The cornerstone of market share positioning strategies is innovation. Investing in research and development enables companies to stay ahead of agricultural trends and bring new features into their products such as AI-powered pest detection, automated irrigation systems, or crop health monitoring. Pioneering new solutions in the market allows companies that are industry leaders to attract early adopters from the agriculture sector thus giving them an upper hand over others. That is why continuous improvement and adaptation to emerging technologies are crucial for sustained success in the ever-evolving Applied AI in Agriculture Market.

    Author
    Shubham Munde
    Research Analyst Level II

    With a technical background in information technology & semiconductors, Shubham has 4.5+ years of experience in market research and analytics with the tasks of data mining, analysis, and project execution. He is the POC for our clients, for their consulting projects running under the ICT/Semiconductor domain. Shubham holds a Bachelor’s in Information and Technology and a Master of Business Administration (MBA). Shubham has executed over 150 research projects for our clients under the brand name Market Research Future in the last 2 years. His core skill is building the research respondent relation for gathering the primary information from industry and market estimation for niche markets. He is having expertise in conducting secondary & primary research, market estimations, market projections, competitive analysis, analysing current market trends and market dynamics, deep-dive analysis on market scenarios, consumer behaviour, technological impact analysis, consulting, analytics, etc. He has worked on fortune 500 companies' syndicate and consulting projects along with several government projects. He has worked on the projects of top tech brands such as IBM, Google, Microsoft, AWS, Meta, Oracle, Cisco Systems, Samsung, Accenture, VMware, Schneider Electric, Dell, HP, Ericsson, and so many others. He has worked on Metaverse, Web 3.0, Zero-Trust security, cyber-security, blockchain, quantum computing, robotics, 5G technology, High-Performance computing, data centers, AI, automation, IT equipment, sensors, semiconductors, consumer electronics and so many tech domain projects.

    Leave a Comment

    FAQs

    What is the projected market valuation for the Applied AI in Agriculture Market by 2035?

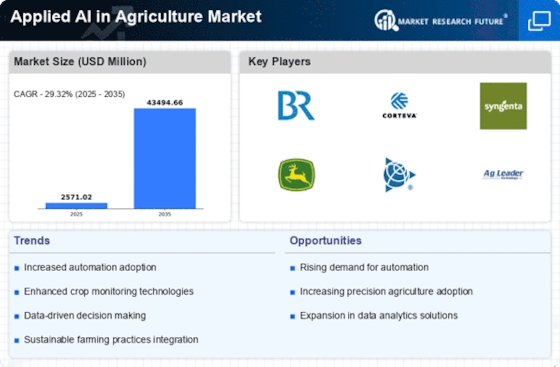
    The projected market valuation for the Applied AI in Agriculture Market by 2035 is 43494.66 USD Million.

    What was the market valuation of the Applied AI in Agriculture Market in 2024?

    The market valuation of the Applied AI in Agriculture Market in 2024 was 2571.02 USD Million.

    What is the expected CAGR for the Applied AI in Agriculture Market from 2025 to 2035?

    The expected CAGR for the Applied AI in Agriculture Market during the forecast period 2025 - 2035 is 29.32%.

    Which technology segment holds the highest valuation in the Applied AI in Agriculture Market?

    The Machine Learning segment holds the highest valuation at 17600.0 USD Million.

    Market Summary

    As per MRFR analysis, the Applied AI in Agriculture Market Size was estimated at 2571.02 USD Million in 2024. The Applied AI in Agriculture industry is projected to grow from 3324.84 in 2025 to 43494.66 by 2035, exhibiting a compound annual growth rate (CAGR) of 29.32 during the forecast period 2025 - 2035.

    Key Market Trends & Highlights

    The Applied AI in Agriculture Market is experiencing robust growth driven by technological advancements and sustainability initiatives.

    • Precision agriculture adoption is transforming farming practices, particularly in North America, where the market is largest.
    • AI-driven decision support systems are gaining traction, especially in the Asia-Pacific region, which is the fastest-growing market.
    • Machine learning remains the largest segment, while AI-as-a-Service is emerging rapidly as a preferred solution.
    • Increased crop yield and cost reduction through efficiency are key drivers propelling market expansion.

    Market Size & Forecast

    2024 Market Size 2571.02 (USD Million)
    2035 Market Size 43494.66 (USD Million)
    CAGR (2025 - 2035) 29.32%
    Largest Regional Market Share in 2024 North America

    Major Players

    <p>Bayer (DE), Corteva (US), Syngenta (CH), John Deere (US), Trimble (US), AG Leader Technology (US), Taranis (IL), Farmers Edge (CA), Sentera (US)</p>

    Market Trends

    The Applied AI in Agriculture Market is currently experiencing a transformative phase, driven by advancements in technology and the increasing need for sustainable farming practices. As agricultural stakeholders seek to enhance productivity and efficiency, the integration of artificial intelligence into various farming processes appears to be gaining traction. This trend is characterized by the adoption of precision agriculture techniques, which leverage data analytics and machine learning to optimize crop yields and resource management. Furthermore, the growing emphasis on environmental sustainability is prompting farmers to utilize AI-driven solutions that minimize waste and reduce the ecological footprint of agricultural activities. In addition to improving operational efficiency, the Applied AI in Agriculture Market is also witnessing a surge in the development of innovative tools and platforms designed to support decision-making. These tools often incorporate predictive analytics, enabling farmers to anticipate challenges such as pest infestations or adverse weather conditions. Moreover, the collaboration between technology providers and agricultural experts seems to be fostering a more integrated approach to farming, where data-driven insights are seamlessly incorporated into everyday practices. As the market evolves, it is likely that the focus will shift towards enhancing user accessibility and affordability of AI solutions, ensuring that a broader range of agricultural producers can benefit from these advancements.

    Precision Agriculture Adoption

    The trend towards precision agriculture is becoming increasingly prominent within the Applied AI in Agriculture Market. This approach utilizes AI technologies to analyze data from various sources, allowing farmers to make informed decisions regarding crop management and resource allocation. By optimizing inputs such as water, fertilizers, and pesticides, precision agriculture aims to enhance productivity while minimizing environmental impact.

    AI-Driven Decision Support Systems

    The emergence of AI-driven decision support systems is reshaping how farmers approach their operations. These systems leverage machine learning algorithms to provide actionable insights based on real-time data, helping farmers to anticipate issues and make proactive decisions. This trend indicates a shift towards more data-centric farming practices, where technology plays a crucial role in enhancing agricultural resilience.

    Sustainability and Environmental Focus

    There is a growing emphasis on sustainability within the Applied AI in Agriculture Market, as stakeholders increasingly recognize the importance of environmentally friendly practices. AI technologies are being utilized to develop solutions that reduce waste, optimize resource use, and promote biodiversity. This trend reflects a broader societal shift towards sustainable agriculture, where the long-term health of ecosystems is prioritized alongside productivity.

    Applied AI in Agriculture Market Market Drivers

    Sustainability Initiatives

    Sustainability is becoming a cornerstone of the Applied AI in Agriculture Market. With increasing awareness of environmental issues, farmers are turning to AI technologies to promote sustainable practices. AI can optimize resource usage, reduce waste, and enhance biodiversity through precision agriculture techniques. For example, AI-driven irrigation systems can minimize water usage while maximizing crop health. This focus on sustainability aligns with global initiatives aimed at reducing the carbon footprint of agriculture. As such, the integration of AI in sustainable farming practices is likely to gain momentum, appealing to environmentally conscious consumers and stakeholders.

    Data-Driven Decision Making

    The shift towards data-driven decision making is a prominent trend in the Applied AI in Agriculture Market. Farmers are increasingly relying on AI analytics to interpret vast amounts of agricultural data, which aids in making informed decisions. This trend is underscored by the fact that the agricultural data market is projected to reach USD 5 billion by 2026. AI tools provide insights into crop health, market trends, and resource allocation, thereby enhancing overall farm management. As data becomes more accessible, the reliance on AI for strategic decision-making is likely to grow, further embedding AI into agricultural practices.

    Cost Reduction and Efficiency

    Cost efficiency remains a pivotal driver in the Applied AI in Agriculture Market. AI technologies facilitate precision farming, which allows farmers to reduce input costs significantly. For instance, AI systems can analyze soil health and weather patterns, enabling targeted application of fertilizers and pesticides. This targeted approach not only conserves resources but also reduces operational costs. Studies suggest that farmers employing AI solutions can save up to 20 percent on input costs, making agriculture more economically viable. Consequently, the drive for cost reduction is propelling the adoption of AI technologies in farming practices.

    Increased Crop Yield through AI

    The Applied AI in Agriculture Market is witnessing a surge in the adoption of AI technologies aimed at enhancing crop yields. By utilizing machine learning algorithms and data analytics, farmers can optimize planting schedules, irrigation, and fertilization processes. Reports indicate that AI-driven solutions can potentially increase crop yields by up to 30 percent, thereby addressing food security challenges. This trend is further supported by the growing demand for food due to rising populations. As a result, the integration of AI in agricultural practices is becoming a critical factor for farmers seeking to maximize productivity while minimizing resource usage.

    Enhanced Supply Chain Management

    The Applied AI in Agriculture Market is also influenced by advancements in supply chain management facilitated by AI technologies. AI can streamline logistics, predict demand, and optimize inventory management, thereby reducing waste and improving efficiency. For instance, AI algorithms can analyze market trends to forecast crop prices, enabling farmers to make timely decisions about when to sell their produce. This capability is particularly crucial in a market where fluctuations can significantly impact profitability. As supply chain complexities increase, the role of AI in enhancing operational efficiency and market responsiveness is expected to expand.

    Market Segment Insights

    By Technology: Machine Learning (Largest) vs. Computer Vision (Fastest-Growing)

    <p>In the Applied AI in Agriculture Market, Machine Learning holds the largest share among the technologies employed, reflecting its widespread adoption across various applications in farming and precision agriculture. Computer Vision, on the other hand, is emerging as a significant player, capturing the interest of agritech companies and farmers alike, in the process addressing critical needs such as crop monitoring and pest detection. Both technologies contribute significantly to enhancing productivity and efficiency within the agriculture sector. The growth trends within this segment are driven by the increasing necessity for automation and data-driven decision-making in agriculture. Farmers and agribusinesses are increasingly leveraging these technologies to optimize yield, reduce waste, and enhance the quality of produce. The rapid advancements in machine learning algorithms and computer vision techniques, combined with the increasing focus on sustainable agriculture practices, are propelling this segment's growth. Additionally, investments in research and development are expected to further enhance the capabilities and applicability of these technologies in the agricultural landscape.</p>

    <p>Technology: Machine Learning (Dominant) vs. Predictive Analytics (Emerging)</p>

    <p>Machine Learning is the dominant technology in the Applied AI in Agriculture Market, excelling in its ability to process vast amounts of data for predictive modeling, crop health analysis, and yield optimization. Its capability to adapt and enhance algorithms through experience provides significant advantages in precision agriculture. Meanwhile, Predictive Analytics is seen as an emerging technology that enables farmers to forecast outcomes based on historical data, weather patterns, and market trends. While not as established as Machine Learning, Predictive Analytics is gaining traction due to its potential for risk management and data-driven decision-making. Together, these technologies showcase a blend of established capabilities and emerging potentials, driving innovations in agricultural practices.</p>

    By Offering: Software (Largest) vs. AI-as-a-Service (Fastest-Growing)

    <p>In the Applied AI in Agriculture Market, Software solutions account for the largest share, driven by their widespread adoption among farmers and agribusinesses. These offerings provide comprehensive tools for data analysis, crop monitoring, and predictive analytics, becoming integral to modern agricultural practices. AI-as-a-Service, while smaller in share, is the fastest-growing segment, appealing to organizations seeking flexible and scalable AI solutions without the need for extensive infrastructure investments. This trend highlights a shift towards cloud-based services, enabling more farmers to access advanced AI technologies easily. The growth trends in this segment are propelled by increasing digitalization in agriculture, rising demand for precision farming, and advancements in machine learning algorithms. Software tools are continually evolving, integrating real-time data analytics and IoT capabilities, enhancing decision-making for farmers. AI-as-a-Service is rapidly gaining traction, particularly among small to mid-sized farming enterprises that prefer subscription models to lower their upfront costs. This dynamic reflects a broader trend towards accessibility and efficiency, as technology becomes more embedded in agricultural practices.</p>

    <p>Software (Dominant) vs. AI-as-a-Service (Emerging)</p>

    <p>Software offerings in the Applied AI in Agriculture Market are characterized by their robust capabilities in crop management, yield prediction, and regulatory compliance. These solutions have established a dominant market presence due to their proven effectiveness and the ability to integrate with existing agricultural practices. Conversely, AI-as-a-Service is emerging as a highly attractive option for agricultural stakeholders, as it allows for the adoption of AI innovations without significant investment in hardware or infrastructure. It provides on-demand access to cutting-edge AI algorithms and features, enabling farmers to harness the power of AI tailored to their specific needs. Both segments play crucial roles in transforming agricultural practices, yet they cater to different market needs and operational scales.</p>

    By Application: Drone Analytics (Largest) vs. Precision Farming (Fastest-Growing)

    <p>In the Applied AI in Agriculture Market, drone analytics holds the largest market share, leveraging advanced imaging and data collection techniques to provide farmers with invaluable insights. This segment enables enhanced crop management, precision irrigation, and monitoring of field conditions, positioning it as a pivotal tool for sustainable farming practices. Conversely, precision farming is rapidly gaining traction as the fastest-growing segment. This method encompasses the integration of various technologies to optimize field-level management regarding crop farming. Through precise data collection and analysis, farmers can tailor their approaches and maximize yields, resulting in a significant shift towards more data-driven agricultural practices.</p>

    <p>Drone Analytics (Dominant) vs. Precision Farming (Emerging)</p>

    <p>Drone analytics is characterized by its ability to capture high-resolution aerial imagery and data, thus revolutionizing how agricultural insights are derived. This technology provides farmers with real-time information on crop health, growth patterns, and field variability, leading to more informed decision-making. Its dominant position in the market is supported by increased investment in UAV technology and regulatory advancements facilitating drone use. On the other hand, precision farming, as an emerging concept, couples AI-driven solutions with traditional agricultural practices to enhance efficiency and sustainability. It promotes the use of sensors, IoT devices, and predictive analytics, allowing farmers to manage resources effectively, minimize waste, and achieve significant productivity gains in their farming operations.</p>

    Get more detailed insights about Applied AI in Agriculture Market Research Report – Forecast till 2035

    Regional Insights

    North America : Innovation and Investment Hub

    North America is the largest market for applied AI in agriculture, holding approximately 45% of the global share. The region benefits from advanced technological infrastructure, significant investment in R&D, and a strong focus on sustainable farming practices. Regulatory support, such as the USDA's initiatives for precision agriculture, further drives demand for AI solutions in farming. The United States and Canada are the leading countries in this sector, with major players like John Deere, Corteva, and Bayer dominating the landscape. The competitive environment is characterized by continuous innovation and partnerships between tech firms and agricultural companies, enhancing the adoption of AI technologies across various farming practices.

    Europe : Sustainable Agriculture Focus

    Europe is the second-largest market for applied AI in agriculture, accounting for about 30% of the global market share. The region's growth is driven by stringent regulations aimed at sustainability and environmental protection, such as the EU's Green Deal, which encourages the adoption of innovative agricultural technologies. Increasing consumer demand for organic and sustainably produced food also propels the market forward. Leading countries include Germany, France, and the Netherlands, where companies like Bayer and Syngenta are prominent. The competitive landscape is marked by a mix of established agricultural firms and emerging tech startups, fostering a dynamic environment for AI integration in farming practices. Collaboration between public and private sectors is crucial for advancing AI applications in agriculture.

    Asia-Pacific : Emerging Market Potential

    Asia-Pacific is witnessing rapid growth in the applied AI in agriculture market, holding around 20% of the global share. The region's agricultural sector is increasingly adopting AI technologies to enhance productivity and address challenges such as food security and climate change. Government initiatives in countries like China and India are pivotal in promoting AI adoption, supported by investments in digital agriculture. China and India are the leading countries in this region, with a growing number of startups and established firms like Trimble and AG Leader Technology making significant inroads. The competitive landscape is evolving, with a focus on localized solutions that cater to diverse agricultural practices. The increasing collaboration between tech companies and farmers is essential for driving AI integration in agriculture.

    Middle East and Africa : Resource-Rich Opportunities

    The Middle East and Africa region is emerging as a significant player in the applied AI in agriculture market, holding approximately 5% of the global share. The growth is driven by the need for efficient water management and food production in arid climates. Governments are increasingly recognizing the importance of technology in agriculture, leading to supportive policies and investments in AI solutions. Countries like South Africa and Kenya are at the forefront, with local startups and international companies exploring AI applications in agriculture. The competitive landscape is characterized by a mix of traditional farming practices and innovative technologies, creating opportunities for growth. Partnerships between governments and private sectors are crucial for enhancing agricultural productivity through AI.

    Key Players and Competitive Insights

    The Applied AI in Agriculture Market is currently characterized by a dynamic competitive landscape, driven by technological advancements and an increasing demand for sustainable agricultural practices. Key players such as Bayer (DE), Corteva (US), and John Deere (US) are at the forefront, each adopting distinct strategies to enhance their market positioning. Bayer (DE) focuses on innovation through its digital farming solutions, aiming to integrate AI with crop protection and seed technologies. Meanwhile, Corteva (US) emphasizes partnerships with tech firms to bolster its AI capabilities, thereby enhancing precision agriculture. John Deere (US) is heavily investing in digital transformation, leveraging AI to optimize equipment performance and improve yield predictions, which collectively shapes a competitive environment that is increasingly reliant on technological integration and strategic collaborations.

    The business tactics employed by these companies reflect a concerted effort to localize manufacturing and optimize supply chains, which are crucial in a moderately fragmented market. This competitive structure allows for a diverse range of solutions tailored to regional agricultural needs, while the influence of major players ensures a level of standardization in technology adoption. The collective actions of these key players not only enhance their individual market shares but also contribute to a more cohesive industry standard that drives innovation.

    In August 2025, Bayer (DE) announced a partnership with a leading AI startup to develop advanced predictive analytics tools for crop management. This strategic move is significant as it positions Bayer to leverage cutting-edge technology, potentially enhancing its product offerings and providing farmers with actionable insights to improve crop yields. Such collaborations are indicative of a broader trend where established companies seek to integrate innovative solutions from agile tech firms, thereby accelerating their digital transformation efforts.

    In September 2025, Corteva (US) launched a new AI-driven platform aimed at optimizing resource allocation in farming operations. This initiative is particularly noteworthy as it reflects Corteva's commitment to sustainability and efficiency, allowing farmers to make data-driven decisions that minimize waste and maximize productivity. The introduction of such platforms not only strengthens Corteva's market position but also aligns with the growing consumer demand for environmentally responsible agricultural practices.

    In October 2025, John Deere (US) unveiled an upgraded version of its AI-powered equipment management system, which includes enhanced machine learning capabilities for predictive maintenance. This development is crucial as it underscores John Deere's focus on improving operational efficiency for farmers, thereby reducing downtime and increasing profitability. The continuous evolution of their technology portfolio indicates a strong commitment to maintaining a competitive edge in the rapidly advancing agricultural sector.

    As of October 2025, the prevailing trends in the Applied AI in Agriculture Market include a pronounced shift towards digitalization, sustainability, and the integration of AI technologies. Strategic alliances are increasingly shaping the competitive landscape, fostering innovation and collaboration among industry players. Looking ahead, it appears that competitive differentiation will evolve from traditional price-based strategies to a focus on technological innovation, enhanced supply chain reliability, and sustainable practices, thereby redefining the parameters of success in this vital sector.

    Key Companies in the Applied AI in Agriculture Market market include

    Industry Developments

    May 2022, The Alliance for a Green Revolution in Africa (AGRA) and Microsoft have expanded their partnership to advance digital agricultural transformation in Africa. The partnership, which was formalized through a Memorandum of Understanding (MoU) signed on the sidelines of the World Economic Forum in Davos in 2022, builds on previous work between AGRA and Microsoft that focused on supporting AGRA's digital transformation efforts to improve food security in Africa.

    December 2022 Amazon Web Services (AWS), a subsidiary of Amazon.com, Inc., announced eight new capabilities for Amazon SageMaker, its fully managed machine learning (ML) service. Amazon SageMaker allows developers, data scientists, and business analysts to build, train, and deploy ML models quickly and easily.

    September 2022 DroneDeploy and Corteva Agriscience announced a partnership to help farmers make better management decisions year-round. Corteva operates one of the world's largest agricultural drone fleets, and DroneDeploy is a leading provider of drone software. Together, the two companies will offer farmers a suite of tools that can be used to monitor crops, identify problems, and optimize yields.

    .webp

    Future Outlook

    Applied AI in Agriculture Market Future Outlook

    <p>The Applied AI in Agriculture Market is projected to grow at a 29.32% CAGR from 2024 to 2035, driven by advancements in precision farming, data analytics, and automation technologies.</p>

    New opportunities lie in:

    • <p>Development of AI-driven pest management systems</p>
    • <p>Integration of autonomous drones for crop monitoring</p>
    • <p>Creation of predictive analytics platforms for yield forecasting</p>

    <p>By 2035, the market is expected to be robust, driven by innovative AI applications and increased adoption across the agricultural sector.</p>

    Market Segmentation

    Applied AI in Agriculture Market Offering Outlook

    • Software
    • AI-as-a-Service

    Applied AI in Agriculture Market Technology Outlook

    • Machine Learning
    • Computer Vision
    • Predictive Analytics

    Applied AI in Agriculture Market Application Outlook

    • Drone Analytics
    • Precision Farming

    Report Scope

    MARKET SIZE 20242571.02(USD Million)
    MARKET SIZE 20253324.84(USD Million)
    MARKET SIZE 203543494.66(USD Million)
    COMPOUND ANNUAL GROWTH RATE (CAGR)29.32% (2024 - 2035)
    REPORT COVERAGERevenue Forecast, Competitive Landscape, Growth Factors, and Trends
    BASE YEAR2024
    Market Forecast Period2025 - 2035
    Historical Data2019 - 2024
    Market Forecast UnitsUSD Million
    Key Companies ProfiledMarket analysis in progress
    Segments CoveredMarket segmentation analysis in progress
    Key Market OpportunitiesIntegration of precision agriculture technologies enhances efficiency and sustainability in the Applied AI in Agriculture Market.
    Key Market DynamicsRising adoption of precision agriculture technologies drives demand for Applied Artificial Intelligence solutions in farming practices.
    Countries CoveredNorth America, Europe, APAC, South America, MEA

    FAQs

    What is the projected market valuation for the Applied AI in Agriculture Market by 2035?

    The projected market valuation for the Applied AI in Agriculture Market by 2035 is 43494.66 USD Million.

    What was the market valuation of the Applied AI in Agriculture Market in 2024?

    The market valuation of the Applied AI in Agriculture Market in 2024 was 2571.02 USD Million.

    What is the expected CAGR for the Applied AI in Agriculture Market from 2025 to 2035?

    The expected CAGR for the Applied AI in Agriculture Market during the forecast period 2025 - 2035 is 29.32%.

    Which technology segment holds the highest valuation in the Applied AI in Agriculture Market?

    The Machine Learning segment holds the highest valuation at 17600.0 USD Million.

    1. SECTION I: EXECUTIVE SUMMARY AND KEY HIGHLIGHTS
      1. | 1.1 EXECUTIVE SUMMARY
      2. | | 1.1.1 Market Overview
      3. | | 1.1.2 Key Findings
      4. | | 1.1.3 Market Segmentation
      5. | | 1.1.4 Competitive Landscape
      6. | | 1.1.5 Challenges and Opportunities
      7. | | 1.1.6 Future Outlook
    2. SECTION II: SCOPING, METHODOLOGY AND MARKET STRUCTURE
      1. | 2.1 MARKET INTRODUCTION
      2. | | 2.1.1 Definition
      3. | | 2.1.2 Scope of the study
      4. | | | 2.1.2.1 Research Objective
      5. | | | 2.1.2.2 Assumption
      6. | | | 2.1.2.3 Limitations
      7. | 2.2 RESEARCH METHODOLOGY
      8. | | 2.2.1 Overview
      9. | | 2.2.2 Data Mining
      10. | | 2.2.3 Secondary Research
      11. | | 2.2.4 Primary Research
      12. | | | 2.2.4.1 Primary Interviews and Information Gathering Process
      13. | | | 2.2.4.2 Breakdown of Primary Respondents
      14. | | 2.2.5 Forecasting Model
      15. | | 2.2.6 Market Size Estimation
      16. | | | 2.2.6.1 Bottom-Up Approach
      17. | | | 2.2.6.2 Top-Down Approach
      18. | | 2.2.7 Data Triangulation
      19. | | 2.2.8 Validation
    3. SECTION III: QUALITATIVE ANALYSIS
      1. | 3.1 MARKET DYNAMICS
      2. | | 3.1.1 Overview
      3. | | 3.1.2 Drivers
      4. | | 3.1.3 Restraints
      5. | | 3.1.4 Opportunities
      6. | 3.2 MARKET FACTOR ANALYSIS
      7. | | 3.2.1 Value chain Analysis
      8. | | 3.2.2 Porter's Five Forces Analysis
      9. | | | 3.2.2.1 Bargaining Power of Suppliers
      10. | | | 3.2.2.2 Bargaining Power of Buyers
      11. | | | 3.2.2.3 Threat of New Entrants
      12. | | | 3.2.2.4 Threat of Substitutes
      13. | | | 3.2.2.5 Intensity of Rivalry
      14. | | 3.2.3 COVID-19 Impact Analysis
      15. | | | 3.2.3.1 Market Impact Analysis
      16. | | | 3.2.3.2 Regional Impact
      17. | | | 3.2.3.3 Opportunity and Threat Analysis
    4. SECTION IV: QUANTITATIVE ANALYSIS
      1. | 4.1 Information and Communications Technology, BY Technology (USD Million)
      2. | | 4.1.1 Machine Learning
      3. | | 4.1.2 Computer Vision
      4. | | 4.1.3 Predictive Analytics
      5. | 4.2 Information and Communications Technology, BY Offering (USD Million)
      6. | | 4.2.1 Software
      7. | | 4.2.2 AI-as-a-Service
      8. | 4.3 Information and Communications Technology, BY Application (USD Million)
      9. | | 4.3.1 Drone Analytics
      10. | | 4.3.2 Precision Farming
      11. | 4.4 Information and Communications Technology, BY Region (USD Million)
      12. | | 4.4.1 North America
      13. | | | 4.4.1.1 US
      14. | | | 4.4.1.2 Canada
      15. | | 4.4.2 Europe
      16. | | | 4.4.2.1 Germany
      17. | | | 4.4.2.2 UK
      18. | | | 4.4.2.3 France
      19. | | | 4.4.2.4 Russia
      20. | | | 4.4.2.5 Italy
      21. | | | 4.4.2.6 Spain
      22. | | | 4.4.2.7 Rest of Europe
      23. | | 4.4.3 APAC
      24. | | | 4.4.3.1 China
      25. | | | 4.4.3.2 India
      26. | | | 4.4.3.3 Japan
      27. | | | 4.4.3.4 South Korea
      28. | | | 4.4.3.5 Malaysia
      29. | | | 4.4.3.6 Thailand
      30. | | | 4.4.3.7 Indonesia
      31. | | | 4.4.3.8 Rest of APAC
      32. | | 4.4.4 South America
      33. | | | 4.4.4.1 Brazil
      34. | | | 4.4.4.2 Mexico
      35. | | | 4.4.4.3 Argentina
      36. | | | 4.4.4.4 Rest of South America
      37. | | 4.4.5 MEA
      38. | | | 4.4.5.1 GCC Countries
      39. | | | 4.4.5.2 South Africa
      40. | | | 4.4.5.3 Rest of MEA
    5. SECTION V: COMPETITIVE ANALYSIS
      1. | 5.1 Competitive Landscape
      2. | | 5.1.1 Overview
      3. | | 5.1.2 Competitive Analysis
      4. | | 5.1.3 Market share Analysis
      5. | | 5.1.4 Major Growth Strategy in the Information and Communications Technology
      6. | | 5.1.5 Competitive Benchmarking
      7. | | 5.1.6 Leading Players in Terms of Number of Developments in the Information and Communications Technology
      8. | | 5.1.7 Key developments and growth strategies
      9. | | | 5.1.7.1 New Product Launch/Service Deployment
      10. | | | 5.1.7.2 Merger & Acquisitions
      11. | | | 5.1.7.3 Joint Ventures
      12. | | 5.1.8 Major Players Financial Matrix
      13. | | | 5.1.8.1 Sales and Operating Income
      14. | | | 5.1.8.2 Major Players R&D Expenditure. 2023
      15. | 5.2 Company Profiles
      16. | | 5.2.1 Bayer (DE)
      17. | | | 5.2.1.1 Financial Overview
      18. | | | 5.2.1.2 Products Offered
      19. | | | 5.2.1.3 Key Developments
      20. | | | 5.2.1.4 SWOT Analysis
      21. | | | 5.2.1.5 Key Strategies
      22. | | 5.2.2 Corteva (US)
      23. | | | 5.2.2.1 Financial Overview
      24. | | | 5.2.2.2 Products Offered
      25. | | | 5.2.2.3 Key Developments
      26. | | | 5.2.2.4 SWOT Analysis
      27. | | | 5.2.2.5 Key Strategies
      28. | | 5.2.3 Syngenta (CH)
      29. | | | 5.2.3.1 Financial Overview
      30. | | | 5.2.3.2 Products Offered
      31. | | | 5.2.3.3 Key Developments
      32. | | | 5.2.3.4 SWOT Analysis
      33. | | | 5.2.3.5 Key Strategies
      34. | | 5.2.4 John Deere (US)
      35. | | | 5.2.4.1 Financial Overview
      36. | | | 5.2.4.2 Products Offered
      37. | | | 5.2.4.3 Key Developments
      38. | | | 5.2.4.4 SWOT Analysis
      39. | | | 5.2.4.5 Key Strategies
      40. | | 5.2.5 Trimble (US)
      41. | | | 5.2.5.1 Financial Overview
      42. | | | 5.2.5.2 Products Offered
      43. | | | 5.2.5.3 Key Developments
      44. | | | 5.2.5.4 SWOT Analysis
      45. | | | 5.2.5.5 Key Strategies
      46. | | 5.2.6 AG Leader Technology (US)
      47. | | | 5.2.6.1 Financial Overview
      48. | | | 5.2.6.2 Products Offered
      49. | | | 5.2.6.3 Key Developments
      50. | | | 5.2.6.4 SWOT Analysis
      51. | | | 5.2.6.5 Key Strategies
      52. | | 5.2.7 Taranis (IL)
      53. | | | 5.2.7.1 Financial Overview
      54. | | | 5.2.7.2 Products Offered
      55. | | | 5.2.7.3 Key Developments
      56. | | | 5.2.7.4 SWOT Analysis
      57. | | | 5.2.7.5 Key Strategies
      58. | | 5.2.8 Farmers Edge (CA)
      59. | | | 5.2.8.1 Financial Overview
      60. | | | 5.2.8.2 Products Offered
      61. | | | 5.2.8.3 Key Developments
      62. | | | 5.2.8.4 SWOT Analysis
      63. | | | 5.2.8.5 Key Strategies
      64. | | 5.2.9 Sentera (US)
      65. | | | 5.2.9.1 Financial Overview
      66. | | | 5.2.9.2 Products Offered
      67. | | | 5.2.9.3 Key Developments
      68. | | | 5.2.9.4 SWOT Analysis
      69. | | | 5.2.9.5 Key Strategies
      70. | 5.3 Appendix
      71. | | 5.3.1 References
      72. | | 5.3.2 Related Reports
    6. LIST OF FIGURES
      1. | 6.1 MARKET SYNOPSIS
      2. | 6.2 NORTH AMERICA MARKET ANALYSIS
      3. | 6.3 US MARKET ANALYSIS BY TECHNOLOGY
      4. | 6.4 US MARKET ANALYSIS BY OFFERING
      5. | 6.5 US MARKET ANALYSIS BY APPLICATION
      6. | 6.6 CANADA MARKET ANALYSIS BY TECHNOLOGY
      7. | 6.7 CANADA MARKET ANALYSIS BY OFFERING
      8. | 6.8 CANADA MARKET ANALYSIS BY APPLICATION
      9. | 6.9 EUROPE MARKET ANALYSIS
      10. | 6.10 GERMANY MARKET ANALYSIS BY TECHNOLOGY
      11. | 6.11 GERMANY MARKET ANALYSIS BY OFFERING
      12. | 6.12 GERMANY MARKET ANALYSIS BY APPLICATION
      13. | 6.13 UK MARKET ANALYSIS BY TECHNOLOGY
      14. | 6.14 UK MARKET ANALYSIS BY OFFERING
      15. | 6.15 UK MARKET ANALYSIS BY APPLICATION
      16. | 6.16 FRANCE MARKET ANALYSIS BY TECHNOLOGY
      17. | 6.17 FRANCE MARKET ANALYSIS BY OFFERING
      18. | 6.18 FRANCE MARKET ANALYSIS BY APPLICATION
      19. | 6.19 RUSSIA MARKET ANALYSIS BY TECHNOLOGY
      20. | 6.20 RUSSIA MARKET ANALYSIS BY OFFERING
      21. | 6.21 RUSSIA MARKET ANALYSIS BY APPLICATION
      22. | 6.22 ITALY MARKET ANALYSIS BY TECHNOLOGY
      23. | 6.23 ITALY MARKET ANALYSIS BY OFFERING
      24. | 6.24 ITALY MARKET ANALYSIS BY APPLICATION
      25. | 6.25 SPAIN MARKET ANALYSIS BY TECHNOLOGY
      26. | 6.26 SPAIN MARKET ANALYSIS BY OFFERING
      27. | 6.27 SPAIN MARKET ANALYSIS BY APPLICATION
      28. | 6.28 REST OF EUROPE MARKET ANALYSIS BY TECHNOLOGY
      29. | 6.29 REST OF EUROPE MARKET ANALYSIS BY OFFERING
      30. | 6.30 REST OF EUROPE MARKET ANALYSIS BY APPLICATION
      31. | 6.31 APAC MARKET ANALYSIS
      32. | 6.32 CHINA MARKET ANALYSIS BY TECHNOLOGY
      33. | 6.33 CHINA MARKET ANALYSIS BY OFFERING
      34. | 6.34 CHINA MARKET ANALYSIS BY APPLICATION
      35. | 6.35 INDIA MARKET ANALYSIS BY TECHNOLOGY
      36. | 6.36 INDIA MARKET ANALYSIS BY OFFERING
      37. | 6.37 INDIA MARKET ANALYSIS BY APPLICATION
      38. | 6.38 JAPAN MARKET ANALYSIS BY TECHNOLOGY
      39. | 6.39 JAPAN MARKET ANALYSIS BY OFFERING
      40. | 6.40 JAPAN MARKET ANALYSIS BY APPLICATION
      41. | 6.41 SOUTH KOREA MARKET ANALYSIS BY TECHNOLOGY
      42. | 6.42 SOUTH KOREA MARKET ANALYSIS BY OFFERING
      43. | 6.43 SOUTH KOREA MARKET ANALYSIS BY APPLICATION
      44. | 6.44 MALAYSIA MARKET ANALYSIS BY TECHNOLOGY
      45. | 6.45 MALAYSIA MARKET ANALYSIS BY OFFERING
      46. | 6.46 MALAYSIA MARKET ANALYSIS BY APPLICATION
      47. | 6.47 THAILAND MARKET ANALYSIS BY TECHNOLOGY
      48. | 6.48 THAILAND MARKET ANALYSIS BY OFFERING
      49. | 6.49 THAILAND MARKET ANALYSIS BY APPLICATION
      50. | 6.50 INDONESIA MARKET ANALYSIS BY TECHNOLOGY
      51. | 6.51 INDONESIA MARKET ANALYSIS BY OFFERING
      52. | 6.52 INDONESIA MARKET ANALYSIS BY APPLICATION
      53. | 6.53 REST OF APAC MARKET ANALYSIS BY TECHNOLOGY
      54. | 6.54 REST OF APAC MARKET ANALYSIS BY OFFERING
      55. | 6.55 REST OF APAC MARKET ANALYSIS BY APPLICATION
      56. | 6.56 SOUTH AMERICA MARKET ANALYSIS
      57. | 6.57 BRAZIL MARKET ANALYSIS BY TECHNOLOGY
      58. | 6.58 BRAZIL MARKET ANALYSIS BY OFFERING
      59. | 6.59 BRAZIL MARKET ANALYSIS BY APPLICATION
      60. | 6.60 MEXICO MARKET ANALYSIS BY TECHNOLOGY
      61. | 6.61 MEXICO MARKET ANALYSIS BY OFFERING
      62. | 6.62 MEXICO MARKET ANALYSIS BY APPLICATION
      63. | 6.63 ARGENTINA MARKET ANALYSIS BY TECHNOLOGY
      64. | 6.64 ARGENTINA MARKET ANALYSIS BY OFFERING
      65. | 6.65 ARGENTINA MARKET ANALYSIS BY APPLICATION
      66. | 6.66 REST OF SOUTH AMERICA MARKET ANALYSIS BY TECHNOLOGY
      67. | 6.67 REST OF SOUTH AMERICA MARKET ANALYSIS BY OFFERING
      68. | 6.68 REST OF SOUTH AMERICA MARKET ANALYSIS BY APPLICATION
      69. | 6.69 MEA MARKET ANALYSIS
      70. | 6.70 GCC COUNTRIES MARKET ANALYSIS BY TECHNOLOGY
      71. | 6.71 GCC COUNTRIES MARKET ANALYSIS BY OFFERING
      72. | 6.72 GCC COUNTRIES MARKET ANALYSIS BY APPLICATION
      73. | 6.73 SOUTH AFRICA MARKET ANALYSIS BY TECHNOLOGY
      74. | 6.74 SOUTH AFRICA MARKET ANALYSIS BY OFFERING
      75. | 6.75 SOUTH AFRICA MARKET ANALYSIS BY APPLICATION
      76. | 6.76 REST OF MEA MARKET ANALYSIS BY TECHNOLOGY
      77. | 6.77 REST OF MEA MARKET ANALYSIS BY OFFERING
      78. | 6.78 REST OF MEA MARKET ANALYSIS BY APPLICATION
      79. | 6.79 KEY BUYING CRITERIA OF INFORMATION AND COMMUNICATIONS TECHNOLOGY
      80. | 6.80 RESEARCH PROCESS OF MRFR
      81. | 6.81 DRO ANALYSIS OF INFORMATION AND COMMUNICATIONS TECHNOLOGY
      82. | 6.82 DRIVERS IMPACT ANALYSIS: INFORMATION AND COMMUNICATIONS TECHNOLOGY
      83. | 6.83 RESTRAINTS IMPACT ANALYSIS: INFORMATION AND COMMUNICATIONS TECHNOLOGY
      84. | 6.84 SUPPLY / VALUE CHAIN: INFORMATION AND COMMUNICATIONS TECHNOLOGY
      85. | 6.85 INFORMATION AND COMMUNICATIONS TECHNOLOGY, BY TECHNOLOGY, 2024 (% SHARE)
      86. | 6.86 INFORMATION AND COMMUNICATIONS TECHNOLOGY, BY TECHNOLOGY, 2024 TO 2035 (USD Million)
      87. | 6.87 INFORMATION AND COMMUNICATIONS TECHNOLOGY, BY OFFERING, 2024 (% SHARE)
      88. | 6.88 INFORMATION AND COMMUNICATIONS TECHNOLOGY, BY OFFERING, 2024 TO 2035 (USD Million)
      89. | 6.89 INFORMATION AND COMMUNICATIONS TECHNOLOGY, BY APPLICATION, 2024 (% SHARE)
      90. | 6.90 INFORMATION AND COMMUNICATIONS TECHNOLOGY, BY APPLICATION, 2024 TO 2035 (USD Million)
      91. | 6.91 BENCHMARKING OF MAJOR COMPETITORS
    7. LIST OF TABLES
      1. | 7.1 LIST OF ASSUMPTIONS
      2. | | 7.1.1
      3. | 7.2 North America MARKET SIZE ESTIMATES; FORECAST
      4. | | 7.2.1 BY TECHNOLOGY, 2025-2035 (USD Million)
      5. | | 7.2.2 BY OFFERING, 2025-2035 (USD Million)
      6. | | 7.2.3 BY APPLICATION, 2025-2035 (USD Million)
      7. | 7.3 US MARKET SIZE ESTIMATES; FORECAST
      8. | | 7.3.1 BY TECHNOLOGY, 2025-2035 (USD Million)
      9. | | 7.3.2 BY OFFERING, 2025-2035 (USD Million)
      10. | | 7.3.3 BY APPLICATION, 2025-2035 (USD Million)
      11. | 7.4 Canada MARKET SIZE ESTIMATES; FORECAST
      12. | | 7.4.1 BY TECHNOLOGY, 2025-2035 (USD Million)
      13. | | 7.4.2 BY OFFERING, 2025-2035 (USD Million)
      14. | | 7.4.3 BY APPLICATION, 2025-2035 (USD Million)
      15. | 7.5 Europe MARKET SIZE ESTIMATES; FORECAST
      16. | | 7.5.1 BY TECHNOLOGY, 2025-2035 (USD Million)
      17. | | 7.5.2 BY OFFERING, 2025-2035 (USD Million)
      18. | | 7.5.3 BY APPLICATION, 2025-2035 (USD Million)
      19. | 7.6 Germany MARKET SIZE ESTIMATES; FORECAST
      20. | | 7.6.1 BY TECHNOLOGY, 2025-2035 (USD Million)
      21. | | 7.6.2 BY OFFERING, 2025-2035 (USD Million)
      22. | | 7.6.3 BY APPLICATION, 2025-2035 (USD Million)
      23. | 7.7 UK MARKET SIZE ESTIMATES; FORECAST
      24. | | 7.7.1 BY TECHNOLOGY, 2025-2035 (USD Million)
      25. | | 7.7.2 BY OFFERING, 2025-2035 (USD Million)
      26. | | 7.7.3 BY APPLICATION, 2025-2035 (USD Million)
      27. | 7.8 France MARKET SIZE ESTIMATES; FORECAST
      28. | | 7.8.1 BY TECHNOLOGY, 2025-2035 (USD Million)
      29. | | 7.8.2 BY OFFERING, 2025-2035 (USD Million)
      30. | | 7.8.3 BY APPLICATION, 2025-2035 (USD Million)
      31. | 7.9 Russia MARKET SIZE ESTIMATES; FORECAST
      32. | | 7.9.1 BY TECHNOLOGY, 2025-2035 (USD Million)
      33. | | 7.9.2 BY OFFERING, 2025-2035 (USD Million)
      34. | | 7.9.3 BY APPLICATION, 2025-2035 (USD Million)
      35. | 7.10 Italy MARKET SIZE ESTIMATES; FORECAST
      36. | | 7.10.1 BY TECHNOLOGY, 2025-2035 (USD Million)
      37. | | 7.10.2 BY OFFERING, 2025-2035 (USD Million)
      38. | | 7.10.3 BY APPLICATION, 2025-2035 (USD Million)
      39. | 7.11 Spain MARKET SIZE ESTIMATES; FORECAST
      40. | | 7.11.1 BY TECHNOLOGY, 2025-2035 (USD Million)
      41. | | 7.11.2 BY OFFERING, 2025-2035 (USD Million)
      42. | | 7.11.3 BY APPLICATION, 2025-2035 (USD Million)
      43. | 7.12 Rest of Europe MARKET SIZE ESTIMATES; FORECAST
      44. | | 7.12.1 BY TECHNOLOGY, 2025-2035 (USD Million)
      45. | | 7.12.2 BY OFFERING, 2025-2035 (USD Million)
      46. | | 7.12.3 BY APPLICATION, 2025-2035 (USD Million)
      47. | 7.13 APAC MARKET SIZE ESTIMATES; FORECAST
      48. | | 7.13.1 BY TECHNOLOGY, 2025-2035 (USD Million)
      49. | | 7.13.2 BY OFFERING, 2025-2035 (USD Million)
      50. | | 7.13.3 BY APPLICATION, 2025-2035 (USD Million)
      51. | 7.14 China MARKET SIZE ESTIMATES; FORECAST
      52. | | 7.14.1 BY TECHNOLOGY, 2025-2035 (USD Million)
      53. | | 7.14.2 BY OFFERING, 2025-2035 (USD Million)
      54. | | 7.14.3 BY APPLICATION, 2025-2035 (USD Million)
      55. | 7.15 India MARKET SIZE ESTIMATES; FORECAST
      56. | | 7.15.1 BY TECHNOLOGY, 2025-2035 (USD Million)
      57. | | 7.15.2 BY OFFERING, 2025-2035 (USD Million)
      58. | | 7.15.3 BY APPLICATION, 2025-2035 (USD Million)
      59. | 7.16 Japan MARKET SIZE ESTIMATES; FORECAST
      60. | | 7.16.1 BY TECHNOLOGY, 2025-2035 (USD Million)
      61. | | 7.16.2 BY OFFERING, 2025-2035 (USD Million)
      62. | | 7.16.3 BY APPLICATION, 2025-2035 (USD Million)
      63. | 7.17 South Korea MARKET SIZE ESTIMATES; FORECAST
      64. | | 7.17.1 BY TECHNOLOGY, 2025-2035 (USD Million)
      65. | | 7.17.2 BY OFFERING, 2025-2035 (USD Million)
      66. | | 7.17.3 BY APPLICATION, 2025-2035 (USD Million)
      67. | 7.18 Malaysia MARKET SIZE ESTIMATES; FORECAST
      68. | | 7.18.1 BY TECHNOLOGY, 2025-2035 (USD Million)
      69. | | 7.18.2 BY OFFERING, 2025-2035 (USD Million)
      70. | | 7.18.3 BY APPLICATION, 2025-2035 (USD Million)
      71. | 7.19 Thailand MARKET SIZE ESTIMATES; FORECAST
      72. | | 7.19.1 BY TECHNOLOGY, 2025-2035 (USD Million)
      73. | | 7.19.2 BY OFFERING, 2025-2035 (USD Million)
      74. | | 7.19.3 BY APPLICATION, 2025-2035 (USD Million)
      75. | 7.20 Indonesia MARKET SIZE ESTIMATES; FORECAST
      76. | | 7.20.1 BY TECHNOLOGY, 2025-2035 (USD Million)
      77. | | 7.20.2 BY OFFERING, 2025-2035 (USD Million)
      78. | | 7.20.3 BY APPLICATION, 2025-2035 (USD Million)
      79. | 7.21 Rest of APAC MARKET SIZE ESTIMATES; FORECAST
      80. | | 7.21.1 BY TECHNOLOGY, 2025-2035 (USD Million)
      81. | | 7.21.2 BY OFFERING, 2025-2035 (USD Million)
      82. | | 7.21.3 BY APPLICATION, 2025-2035 (USD Million)
      83. | 7.22 South America MARKET SIZE ESTIMATES; FORECAST
      84. | | 7.22.1 BY TECHNOLOGY, 2025-2035 (USD Million)
      85. | | 7.22.2 BY OFFERING, 2025-2035 (USD Million)
      86. | | 7.22.3 BY APPLICATION, 2025-2035 (USD Million)
      87. | 7.23 Brazil MARKET SIZE ESTIMATES; FORECAST
      88. | | 7.23.1 BY TECHNOLOGY, 2025-2035 (USD Million)
      89. | | 7.23.2 BY OFFERING, 2025-2035 (USD Million)
      90. | | 7.23.3 BY APPLICATION, 2025-2035 (USD Million)
      91. | 7.24 Mexico MARKET SIZE ESTIMATES; FORECAST
      92. | | 7.24.1 BY TECHNOLOGY, 2025-2035 (USD Million)
      93. | | 7.24.2 BY OFFERING, 2025-2035 (USD Million)
      94. | | 7.24.3 BY APPLICATION, 2025-2035 (USD Million)
      95. | 7.25 Argentina MARKET SIZE ESTIMATES; FORECAST
      96. | | 7.25.1 BY TECHNOLOGY, 2025-2035 (USD Million)
      97. | | 7.25.2 BY OFFERING, 2025-2035 (USD Million)
      98. | | 7.25.3 BY APPLICATION, 2025-2035 (USD Million)
      99. | 7.26 Rest of South America MARKET SIZE ESTIMATES; FORECAST
      100. | | 7.26.1 BY TECHNOLOGY, 2025-2035 (USD Million)
      101. | | 7.26.2 BY OFFERING, 2025-2035 (USD Million)
      102. | | 7.26.3 BY APPLICATION, 2025-2035 (USD Million)
      103. | 7.27 MEA MARKET SIZE ESTIMATES; FORECAST
      104. | | 7.27.1 BY TECHNOLOGY, 2025-2035 (USD Million)
      105. | | 7.27.2 BY OFFERING, 2025-2035 (USD Million)
      106. | | 7.27.3 BY APPLICATION, 2025-2035 (USD Million)
      107. | 7.28 GCC Countries MARKET SIZE ESTIMATES; FORECAST
      108. | | 7.28.1 BY TECHNOLOGY, 2025-2035 (USD Million)
      109. | | 7.28.2 BY OFFERING, 2025-2035 (USD Million)
      110. | | 7.28.3 BY APPLICATION, 2025-2035 (USD Million)
      111. | 7.29 South Africa MARKET SIZE ESTIMATES; FORECAST
      112. | | 7.29.1 BY TECHNOLOGY, 2025-2035 (USD Million)
      113. | | 7.29.2 BY OFFERING, 2025-2035 (USD Million)
      114. | | 7.29.3 BY APPLICATION, 2025-2035 (USD Million)
      115. | 7.30 Rest of MEA MARKET SIZE ESTIMATES; FORECAST
      116. | | 7.30.1 BY TECHNOLOGY, 2025-2035 (USD Million)
      117. | | 7.30.2 BY OFFERING, 2025-2035 (USD Million)
      118. | | 7.30.3 BY APPLICATION, 2025-2035 (USD Million)
      119. | 7.31 PRODUCT LAUNCH/PRODUCT DEVELOPMENT/APPROVAL
      120. | | 7.31.1
      121. | 7.32 ACQUISITION/PARTNERSHIP
      122. | | 7.32.1

    Applied AI in Agriculture Market Segmentation

    Market Segmentation Overview

    • Detailed segmentation data will be available in the full report
    • Comprehensive analysis by multiple parameters
    • Regional and country-level breakdowns
    • Market size forecasts by segment
    Infographic

    Free Sample Request

    Kindly complete the form below to receive a free sample of this Report

    Get Free Sample

    Customer Strories

    “I am very pleased with how market segments have been defined in a relevant way for my purposes (such as "Portable Freezers & refrigerators" and "last-mile"). In general the report is well structured. Thanks very much for your efforts.”

    Victoria Milne

    Founder
    Case Study
    Chemicals and Materials

    Compare Licence

    ×
    Features License Type
    Single User Multiuser License Enterprise User
    Price $4,950 $5,950 $7,250
    Maximum User Access Limit 1 User Upto 10 Users Unrestricted Access Throughout the Organization
    Free Customization
    Direct Access to Analyst
    Deliverable Format
    Platform Access
    Discount on Next Purchase 10% 15% 15%
    Printable Versions