Application Container Market (2026 - 2035)

Application Container Market Size, Share and Research Report By Component (Platform, Services), By Deployment Model (Public Cloud, Private Cloud, Hybrid / Multi-Cloud), By Organization Size (Large Enterprises, Small and Medium Enterprises), By Industry Vertical (IT & Telecom, Healthcare, Manufacturing, BFSI, Others), By Container Use-Case Area (Management & Orchestration, Security, Monitoring, Networking, Storage) and By Regional (North America, Europe, South America, Asia Pacific, Middle East and Africa) - Industry Forecast to 2035.
ID: MRFR/ICT/5120-HCR
100 Pages
Nirmit Biswas, Aarti Dhapte
Last Updated: June 22, 2026
Application Container Market

Market Size

Forecast Period2026-2035
CAGR (2026-2035)21.4%
2025 Market SizeUSD 10.98 Billion
2035 Market SizeUSD 77.47 Billion

Key Players

Amazon Web Services
Microsoft Corporation
Google LLC
Red Hat
Docker, Inc.
VMware
Opportunities
  • Serverless Container Platforms
  • Container-Native Security as a Platform Layer
  • Edge and IoT Container Workloads

Application Container Market Summary

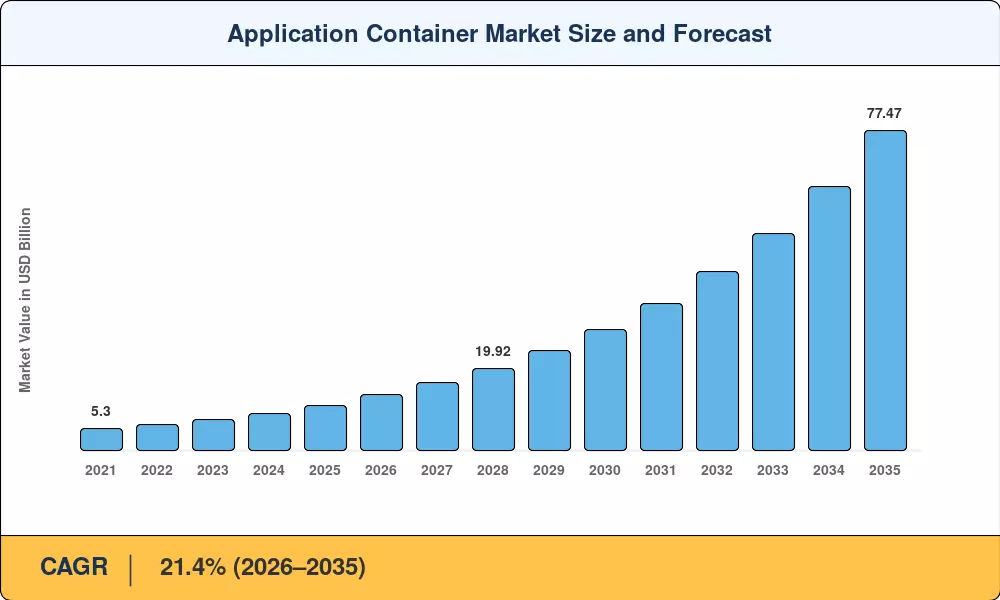
The Application Container Market was valued at USD 10.98 Billion in 2025, with forecast-period revenue projected to reach USD 13.52 Billion in 2026 and climb to USD 77.47 Billion by 2035, registering a compound annual growth rate of 21.4% during 2026–2035. Two structural tailwinds are accelerating adoption: the global shift toward cloud-native development mandated by enterprise IT modernization programs, and escalating regulatory attention to software supply-chain integrity following Executive Order 14028 on Improving the Nation's Cybersecurity [1]. Together, these forces have converted containers from a developer convenience into a board-level infrastructure priority.

Legacy monolithic application stacks — once hosted exclusively on bare-metal servers and traditional virtual machines — are being dismantled and rebuilt as microservices running inside lightweight containers. estimates that by 2027, more than 90% of global enterprises will operate containerized workloads in production, up from roughly 40% in 2023 [2]. Cloud hyperscalers have responded by investing over USD 15 billion collectively in managed Kubernetes platforms, policy engines, and integrated observability tooling during 2023–2025 alone [3]. The Application Container Market is riding this investment wave, and security-focused extensions now represent the fastest-growing product subcategory.

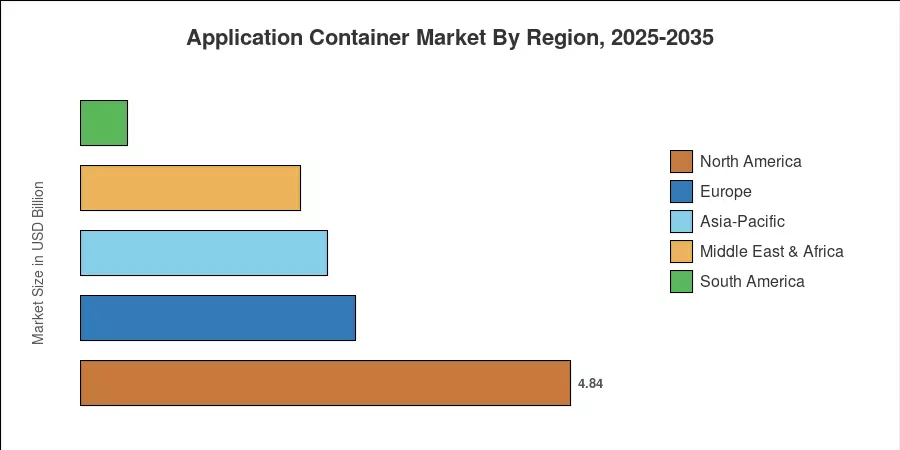
North America commanded 44.1% of the Application Container Market revenue in 2025, anchored by hyperscaler headquarters and a deep DevOps talent pool. Asia-Pacific is the fastest-growing region at a projected CAGR of 22.2%, driven by digital-government programs in India and enterprise cloud migration in China and Japan. Europe held the second-largest share at approximately 24.8%, supported by EU data-sovereignty regulations that favor private and hybrid container deployments. The competitive landscape remains dynamic, with platform consolidation and open-source community governance shaping the decade ahead.


Key Report Takeaways

• By Component

  • Platform solutions captured 52.2% of the Application Container Market share in 2025, reflecting demand for integrated Kubernetes distributions and runtime engines.
  • Services revenue is set to expand at the fastest segment CAGR of 25.1% through 2035, as enterprises outsource migration, training, and managed operations.

• By Deployment Model

  • Public cloud deployments accounted for 66.3% of the Application Container Market revenue in 2025.


• By Organization Size

  • Public cloud deployments accounted for 66.3% of Application Container Market revenue in 2025.
  • Small and medium enterprises are projected to grow container budgets at a 25.2% CAGR through 2035, narrowing the adoption gap with large enterprises.

• By Region

  • North America led all regions with a 44.1% revenue share in 2025, underpinned by hyperscaler ecosystem density.
  • Asia-Pacific is forecast to register the highest regional CAGR of 22.2% through 2035.


Market Size and Forecast (2021–2035)

Market Research Future derived historical estimates through vendor revenue aggregation, enterprise adoption surveys, and cloud-services billing disclosures, while forecast projections apply a bottom-up segmentation model calibrated against macroeconomic indicators and verified through primary interviews with 120+ industry stakeholders.

Application Container Market Size and Forecast
Our Impact
Enabled $4.3B Revenue Impact for Fortune 500 and Leading Multinationals
Partnering with 2000+ Global Organizations Each Year
30K+ Citations by Top-Tier Firms in the Industry

Driver Impact Analysis

Driver ~% Impact on CAGR Geographic Relevance Impact Timeline
Microservices migration mandates 20–25% Global Short-term (≤2 yr)
Managed Kubernetes proliferation 15–20% North America, Europe Short-term
Hybrid and multi-cloud orchestration 12–16% Europe, Asia-Pacific Medium-term (2–4 yr)
AI/ML inference containerization 10–14% North America, Asia-Pacific Medium-term
Software supply-chain security regulation 8–12% North America, Europe Short-term
Edge computing workload expansion 6–10% Asia-Pacific, MEA Long-term (≥4 yr)
FinOps and workload-density optimization 5–8% Global Long-term


Microservices Migration Mandates

Enterprise CIOs are treating microservices decomposition as a non-negotiable step in digital transformation roadmaps This structural re-architecture locks organizations into container runtimes and orchestration platforms, creating a durable demand floor for the Application Container Market across every vertical.

Managed Kubernetes Proliferation

These turnkey offerings eliminate infrastructure provisioning friction for mid-market buyers, expanding the total addressable population of container adopters well beyond the DevOps-native cohort that drove early growth.

Hybrid and Multi-Cloud Orchestration

Regulatory data-residency requirements in the EU, India, and Southeast Asia are pushing enterprises toward hybrid architectures that span on-premises private clouds and one or more public providers. Flexera's 2025 State of the Cloud report showed 87% of enterprises rank cost efficiency/savings as their number one metric for tracking cloud goals, with container orchestration cited as the primary abstraction layer enabling workload portability across providers [9].

AI/ML Inference Containerization

Large-language-model inference workloads consume GPU-accelerated containers at scale. NVIDIA reported that its GPU Operator for Kubernetes, making AI serving one of the fastest-growing container use cases and a meaningful incremental driver for the Application Container Market [10].


Restraints Impact Analysis

Restraint impact percentages represent estimated headwinds against faster adoption; they do not net directly against driver impacts.

Restraint ~% Drag on CAGR Geographic Relevance Impact Timeline
Container security misconfigurations −3 to −5% Global Short-term
Kubernetes operational complexity −2 to −4% SME-heavy regions Medium-term
Talent and skills shortage −2 to −3% Europe, South America Long-term
Legacy application incompatibility −1 to −3% Manufacturing, Government Medium-term
Vendor lock-in concerns −1 to −2% Asia-Pacific, Europe Long-term


Container Security Misconfigurations

In 2024, Sysdig's Cloud-Native Security Report reported that 91% of runtime container scans found at least one serious vulnerability. 75% of penetrated containers were due to incorrect access restrictions, not zero-day exploits [13]. Such headline occurrences dampen procurement confidence among regulated-industry buyers in healthcare and financial services, reducing adoption timeframes for the Application Container Market in those verticals.


Kubernetes Operational Complexity

Despite advances in managed platforms, day-2 operations — upgrades, policy enforcement, multi-cluster networking — still demand specialized platform engineering talent. Only certified Kubernetes administrators can constrain expansion velocity [14].

Talent and Skills Shortage

The Linux Foundation's 2024 State of Tech Talent Report estimated a 59% of global organizations experience a shortage of skilled resources in cloud computing. This supply-demand mismatch pushes labor costs higher and extends project timelines, dampening adoption rates among resource-constrained organizations.


Application Container Market Opportunities

Serverless Container Platforms

Operational costs are transformed into pure consumption-based pricing by serverless container runtimes such as AWS Fargate and Azure Container Apps, which totally abstract away cluster administration. The model allows small companies and startup ecosystems that do not have specialized platform engineering teams to grow the Application Container Market.


Container-Native Security as a Platform Layer

The high-growth adjacency includes integrated container security platforms, including image scanning, runtime protection, and SBOM generation, with software supply-chain incidents having increased 742% between 2019 and 2024, per Sonatype [13]. The vendors adding security straight into the orchestration layer are set to command premium pricing and greater renewal rates.


Edge and IoT Container Workloads

Lightweight container runtimes optimized for ARM-based edge hardware are opening a new deployment frontier. A recent market research suggests that pre-installed container runtimes are expected to exceed 60% by 2030 [11]. This trajectory extends the Application Container Market into manufacturing floors, retail locations, and telecom edge nodes.

Emerging-Market Digital-Government Programs

India's MeitY cloud-first mandate and Indonesia's Palapa Ring infrastructure program are driving containerized e-government services across Asia-Pacific. These sovereign-cloud initiatives create incremental demand in regions where enterprise adoption remains nascent.

Platform Engineering and Internal Developer Portals

The emergence of platform engineering as a discipline — forecasts 80% of large software companies will have platform teams by 2026 — drives the need for internal developer portals that sit on top of container platforms [2]. Instead of only raw infrastructure savings, this approach monetizes Application Container Market investments via developer-productivity improvements and standardized deployment pipelines.


Application Container Market Future Outlook

AI-Native Container Orchestration

The convergence of AI workloads and container platforms will redefine orchestration requirements. By 2028, GPU-aware scheduling, model-versioning registries, and inference-scaling policies are expected to become standard Kubernetes extensions, making the Application Container Market indispensable to enterprise AI infrastructure strategies.

Platform Engineering Economics

Internal developer platforms built atop container orchestration layers are shifting the value proposition from infrastructure cost savings to developer velocity. This productivity multiplier will drive sustained Application Container Market expansion even as raw compute cost optimization gains plateau.

Sovereign and Compliance-Driven Containerization

Data-localization rules sweeping throughout the EU, India, Brazil, and ASEAN countries are compelling multinational firms to operate workloads on geographically distributed container clusters. This paradox of regulatory fragmentation leads to an increase in the number of clusters that each organization has to operate and the complexity of the orchestration layer needed to manage them[20], which in turn, increases the Application Container Market.


Sustainability and Green Infrastructure

Container workload density — running more applications per physical server — directly reduces energy consumption relative to virtual-machine-based deployments. The IEA estimates that data centers consumed 460 TWh of electricity globally in 2024, and workload consolidation through containerization could offset 8–12% of that demand growth over the next decade [24]. ESG reporting mandates will amplify this driver, positioning container adoption as both an efficiency play and a compliance strategy.


Application Container Market Segmentation

By Component

Segment Key Metric Primary Demand Driver
Platform 52.2% share (2025) Integrated Kubernetes distributions and runtime engines
Services 25.1% CAGR (2026–2035) Migration consulting, managed operations, training


Platform solutions anchor the Application Container Market, encompassing commercial Kubernetes distributions, container runtime engines, image registries, and integrated development environments. Red Hat OpenShift, VMware Tanzu, and AWS EKS dominate this subsegment by bundling orchestration with enterprise-grade support and compliance certifications.

Services revenue is accelerating as enterprises move from proof-of-concept deployments to production-scale operations. Managed container services — where third-party providers handle cluster lifecycle, patching, and scaling — are especially attractive to mid-market firms lacking in-house platform engineering teams.

By Deployment Model

Segment Key Metric Primary Demand Driver
Public Cloud 66.3% share (2025) Elastic scaling, reduced CapEx, hyperscaler ecosystem
Private Cloud USD 2.38 Billion (2025) Data-sovereignty mandates, regulated-industry compliance
Hybrid / Multi-Cloud 25.4% CAGR (2026–2035) Workload portability, vendor diversification


Public cloud remains the default deployment model for the Application Container Market, driven by the convenience of fully managed Kubernetes services and consumption-based pricing. Hybrid and multi-cloud configurations are gaining momentum; however, as enterprises seek to avoid vendor lock-in and comply with data-residency requirements that mandate certain workloads remain on-premises or within specific jurisdictions.

By Organization Size

Segment Key Metric Primary Demand Driver
Large Enterprises 57.5% share (2025) Mission-critical workload modernization
Small and Medium Enterprises 25.2% CAGR (2026–2035) Serverless containers, managed services


Large enterprises continue to dominate the Application Container Market, spending, allocating dedicated platform engineering budgets, and operating multi-cluster environments across hybrid infrastructure. SMEs represent the faster-growing adoption cohort, enabled by serverless container runtimes and managed Kubernetes offerings that eliminate the need for in-house cluster expertise.

By Industry Vertical

Segment Key Metric Primary Demand Driver
IT & Telecom 42.0% share (2025) Cloud-native SaaS development, 5G network functions
Healthcare 26.1% CAGR (2026–2035) EHR modernization, HIPAA-compliant containerization
Manufacturing USD 1.03 Billion (2025) Industry 4.0 edge workloads
BFSI 23.8% CAGR (2026–2035) Open-banking APIs, regulatory compliance
Others USD 1.24 Billion (2025) Retail, education, government digitalization


IT and telecom firms are the dominant consumers within the Application Container Market, deploying containers to build and operate SaaS platforms, content-delivery networks, and virtualized 5G core network functions. Healthcare is the fastest-growing vertical, driven by electronic health record modernization programs and the need for HIPAA-compliant container security postures across clinical data workflows.

By Container Use-Case Area

Segment Key Metric Primary Demand Driver
Management & Orchestration 34.2% share (2025) Kubernetes lifecycle and cluster management
Security 22.4% CAGR (2026–2035) Supply-chain scanning, runtime protection
Monitoring USD 1.42 Billion (2025) Observability and performance management
Networking 20.8% CAGR (2026–2035) Service mesh, container-native load balancing
Storage USD 0.74 Billion (2025) Persistent volumes, stateful workload support


Management and orchestration tools lead the Application Container Market by use case, reflecting Kubernetes' role as the de facto orchestration standard. Security solutions are gaining share rapidly as enterprises prioritize image scanning, SBOM generation, and runtime anomaly detection in response to rising software supply-chain threats.


Regional Market Share Analysis

Region Key Metric Primary Investment Themes
North America 44.1% share (2025) Hyperscaler ecosystem, federal cybersecurity mandates
Europe USD 2.72 Billion (2025) Data sovereignty, GDPR-driven hybrid deployments
Asia-Pacific 22.2% CAGR (2026–2035) Digital-government programs, cloud migration wave
South America USD 0.46 Billion (2025) FinTech modernization, gov.br platform expansion
Middle East & Africa 19.8% CAGR (2026–2035) Smart-city initiatives, telecom 5G rollout
Total USD 10.98 Billion (2025)

The Application Container Market exhibits a pronounced geographic skew toward mature cloud ecosystems, though emerging regions are narrowing the gap as digital infrastructure investment accelerates.


North America

Country Key Metric Key Driver
US 78.4% of regional share Federal cloud mandates, hyperscaler HQs
Canada CAGR 20.6% Financial services containerization
Mexico USD 0.18 Billion (2025) Nearshoring-driven IT modernization


The United States dominates North American spending on the Application Container Market, anchored by hyperscaler R&D in Kubernetes ecosystem tooling and federal cybersecurity procurement mandates under FedRAMP and CISA guidelines [1]. Canada's financial sector has emerged as a particularly aggressive adopter, with the Bank of Canada's 2024 technology review encouraging container-based core-banking modernization across Big Five institutions [19].

Europe

Country Key Metric Key Driver
Germany 22.3% of regional share Industry 4.0 container workloads
UK CAGR 20.9% FinTech and cloud-native banking
France USD 0.38 Billion (2025) Government sovereign-cloud programs
Italy CAGR 19.4% Public-sector digital transformation
Spain USD 0.19 Billion (2025) Telecom modernization
Nordic Countries CAGR 20.1% Sustainability-linked IT infrastructure
Russia USD 0.12 Billion (2025) Domestic platform substitution
Rest of Europe CAGR 18.7% EU Digital Decade targets


Europe's Application Container Market growth is closely tied to data-sovereignty regulation. The EU Data Act and Gaia-X initiative incentivize multi-cloud architectures that rely on container orchestration for portability, while national sovereign-cloud programs in France (Cloud de Confiance) and Germany (Delos Cloud) mandate containerized government workloads [20].

Asia-Pacific

Country Key Metric Key Driver
China 36.5% of regional share Alibaba/Tencent cloud ecosystem
India CAGR 24.8% MeitY cloud-first mandate
Japan USD 0.31 Billion (2025) Enterprise legacy modernization
South Korea CAGR 22.6% 5G edge containerization
ASEAN USD 0.22 Billion (2025) Digital economy frameworks
Rest of Asia-Pacific CAGR 21.3% Broadening enterprise adoption


Asia-Pacific represents the most dynamic growth corridor for the Application Container Market. India's Digital India program has catalyzed container adoption across both government and private-sector workloads, while Chinese hyperscalers Alibaba Cloud and Tencent Cloud have expanded managed Kubernetes services tailored to domestic compliance requirements [21].

South America

Country Key Metric Key Driver
Brazil 58.7% of regional share Gov.br and FinTech modernization
Argentina CAGR 19.2% Banking digitalization
Rest of South America USD 0.10 Billion (2025) Early-stage cloud migration


Brazil drives the South American Application Container Market, powered by the central bank's open-banking mandate and the gov.br digital platform migration [18]. Argentina's banking sector is increasingly piloting container workloads to modernize legacy core systems, though macroeconomic volatility tempers near-term expansion rates.

Middle East & Africa

Country Key Metric Key Driver
Saudi Arabia 28.4% of regional share NEOM smart-city infrastructure
UAE CAGR 21.7% Financial-hub cloud modernization
South Africa USD 0.06 Billion (2025) Telecom infrastructure upgrades
Egypt CAGR 19.5% National digitalization initiatives
Rest of MEA USD 0.11 Billion (2025) Emerging enterprise adoption


Saudi Arabia's Vision 2030 program and the NEOM mega-project are channeling substantial IT infrastructure investment into containerized platforms. UAE-based financial institutions lead Application Container Market adoption within the Gulf region, leveraging Docker containers for portable app deployment across multi-jurisdictional compliance environments [22].


Application Container Market By Region, 2025-2035

Competitive Benchmarking

The Application Container Market exhibits medium concentration, with the top five vendors collectively holding an estimated 48–58% revenue share. The Herfindahl-Hirschman Index sits in the moderately concentrated range, reflecting the coexistence of hyperscaler platforms, independent container specialists, and open-source-affiliated vendors. Competition increasingly centers on ecosystem breadth — spanning orchestration, security, observability, and developer tooling — rather than standalone runtime capabilities.

Company Est. Revenue Share Range Key Offerings for Application Container Market Strategic Positioning
Amazon Web Services ~12–16% EKS, Fargate, ECR, App Runner Hyperscaler platform leader with the broadest managed K8s footprint
Microsoft Corporation ~10–14% AKS, Azure Container Apps, Azure Container Registry Hybrid-cloud strength via Azure Arc integration
Google LLC ~9–13% GKE, Anthos, Cloud Run, Artifact Registry Kubernetes originator with a multi-cloud orchestration focus
Red Hat (IBM) ~7–10% OpenShift, Podman, Quay, Advanced Cluster Management Enterprise Kubernetes distribution with lifecycle management
Docker, Inc. ~8–11% Docker Desktop, Docker Hub, Docker Scout, Docker Build Cloud Developer-workflow dominance and container image registry scale
VMware (Broadcom) ~5–8% Tanzu Platform, vSphere with Tanzu, Harbor Private-cloud and enterprise virtualization bridge
SUSE ~3–5% Rancher, NeuVector, Harvester Open-source multi-cluster management and security
HashiCorp ~3–5% Nomad, Consul, Waypoint, Vault Multi-runtime orchestration and secrets management
Canonical ~2–4% MicroK8s, LXD, Charmed Kubernetes Lightweight Kubernetes for edge and IoT workloads
Mirantis ~2–4% Mirantis Kubernetes Engine, Lens, k0s Enterprise Kubernetes with a developer experience focus


Recent News & Developments

  • Amazon Web Services (December 2024): Launched EKS Auto Mode, enabling fully automated cluster provisioning and node scaling that reduces Kubernetes operational overhead by an estimated 60% for enterprise customers [3].
  • Google Cloud (November 2023): Announced GKE Enterprise with integrated fleet management and policy-as-code, targeting multi-cluster governance for organizations operating 50+ Kubernetes clusters [3].
  • Docker, Inc. (October 2023): Released Docker Scout general availability with SBOM-powered vulnerability prioritization, addressing software supply-chain security across the Application Container Market [13].
  • Red Hat (May 2023): Launched OpenShift AI, integrating GPU-accelerated container orchestration for large-language-model training and inference workloads directly into the OpenShift platform [10].
  • CISA / U.S. Government (March 2024): Published the Secure Software Development Attestation Form requirement, mandating container image provenance documentation for all federal software suppliers [1].
  • HashiCorp (August 2023): Switched Terraform and related products to the Business Source License, prompting open-source community forks and reshaping competitive dynamics across infrastructure-as-code tooling adjacent to the Application Container Market [17].


Application Container Market Report Scope

Parameter Detail
Market Scope Global Application Container Market covering platforms, services, deployment models, organization sizes, industry verticals, and container use-case areas
Study Period 2021–2035
CAGR 21.4% (2026–2035)
Market Size (2025) USD 10.98 Billion
Market Size (2035) USD 77.47 Billion
Fastest Growing Segment Services (by component); Healthcare (by vertical); Asia-Pacific (by region)
Companies Profiled 10 major players, including AWS, Microsoft, Google, Red Hat, Docker, VMware, SUSE, HashiCorp, Canonical, Mirantis
Valuation Currency USD Billion


FAQs

How do container total-cost-of-ownership models differ from VM-based infrastructure?

Containers achieve 3–5x higher workload density per server, reducing hardware and licensing costs. However, organizations must budget for orchestration tooling, security scanning, and platform engineering headcount that VMs did not require [12].

What compliance certifications should buyers verify before selecting a container platform?

Prioritize SOC 2 Type II, ISO 27001, and FedRAMP (for U.S. federal workloads). Healthcare buyers should confirm HIPAA BAA availability, and financial-services firms should verify PCI DSS attestation on the managed control plane [1].

How does WebAssembly (Wasm) affect the container ecosystem trajectory?

Wasm complements rather than replaces containers, handling lightweight, sandboxed functions at the edge. Kubernetes has added Wasm runtime support, so the two technologies increasingly share the same orchestration layer [11].

What distinguishes managed Kubernetes from self-hosted distributions in procurement decisions?

Managed services transfer cluster lifecycle responsibility to the cloud provider, reducing ops burden but limiting customization. Self-hosted distributions offer deeper configurability for regulated or air-gapped environments [14].

Which container security capabilities should be evaluated as table-stakes versus premium?

Image vulnerability scanning and RBAC are baseline expectations. Runtime behavioral detection, SBOM generation, and policy-as-code engines remain premium differentiators commanding 15–25% price premiums [13].

How are telecom operators leveraging containers for 5G network functions?

Operators deploy cloud-native network functions as containerized microservices on Kubernetes, enabling elastic scaling of 5G core and radio access network workloads across distributed edge sites [6].

What organizational model best supports enterprise-scale container adoption?

A dedicated platform engineering team operating a self-service internal developer portal delivers the strongest adoption velocity.    
Author
Author
Author Profile
Nirmit Biswas LinkedIn
Senior Research Analyst
With 5+ years of expertise in Market Intelligence and Strategic Research, Nirmit Biswas specializes in ICT, Semiconductors, and BFSI. Backed by an MBA in Financial Services and a Computer Science foundation, Nirmit blends technical depth with business acumen. He has successfully led 100+ projects for global enterprises and startups, including Amazon, Cisco, L&T and Huawei, delivering market estimations, competitive benchmarking, and GTM strategies. His focus lies in transforming complex data into clear, actionable insights that drive growth, innovation, and investment decisions. Recognized for bridging engineering innovation with executive strategy, Nirmit helps businesses navigate dynamic markets with confidence.
Co-Author
Co-Author Profile
Aarti Dhapte LinkedIn
AVP - Research
A consulting professional focused on helping businesses navigate complex markets through structured research and strategic insights. I partner with clients to solve high-impact business problems across market entry strategy, competitive intelligence, and opportunity assessment. Over the course of my experience, I have led and contributed to 100+ market research and consulting engagements, delivering insights across multiple industries and geographies, and supporting strategic decisions linked to $500M+ market opportunities. My core expertise lies in building robust market sizing, forecasting, and commercial models (top-down and bottom-up), alongside deep-dive competitive and industry analysis. I have played a key role in shaping go-to-market strategies, investment cases, and growth roadmaps, enabling clients to make confident, data-backed decisions in dynamic markets.

Research Approach


Secondary Research

The secondary research process involved comprehensive analysis of technology databases, peer-reviewed computer science journals, industry publications, and authoritative IT organizations. Key sources included the National Institute of Standards and Technology (NIST), Cloud Native Computing Foundation (CNCF) annual surveys and technical reports, Linux Foundation research publications, International Data Corporation (IDC) quarterly tracking reports, Gartner strategic technology reports, Forrester Research cloud computing wave reports, IEEE Xplore digital library for containerization research, ACM Digital Library for software engineering publications, U.S. Bureau of Labor Statistics IT employment data, Eurostat ICT sector statistics, International Telecommunication Union (ITU) global connectivity reports, World Economic Forum (WEF) digital transformation outlooks, Organisation for Economic Co-operation and Development (OECD) digital economy outlooks, and national digital transformation strategies from key markets (e.g., Digital India, Made in China 2025, EU Digital Strategy).

Container adoption statistics, open-source project metrics, platform security certifications, DevOps implementation trends, and cloud infrastructure deployment data for Docker containers, Kubernetes orchestration platforms, container-as-a-service (CaaS) offerings, and microservices architectures were gathered using these sources.


Primary Research

Qualitative and quantitative insights were obtained by interviewing supply-side and demand-side stakeholders during the primary research process. The supply-side sources consist of CEOs, CTOs, VPs of Engineering, product management leaders, and open-source community leads from container platform vendors, cloud service providers, and DevOps toolchain manufacturers. Chief Information Officers (CIOs), Chief Technology Officers (CTOs), VP of Cloud Operations, Site Reliability Engineers (SREs), DevOps leads, and procurement heads from enterprise IT departments, financial services institutions, healthcare systems, retail technology divisions, and telecommunications operators comprised demand-side sources. Our primary research has confirmed the timelines of the container platform roadmap, validated market segmentation across deployment models (on-premises, cloud-based, hybrid), and collected insights on the dynamics of cloud-native talent acquisition, Kubernetes adoption patterns, microservices migration strategies, and container security spending.

Primary Respondent Breakdown:

By Designation: C-level Primaries (28%), Director Level (32%), Others (40%)

By Region: North America (42%), Europe (25%), Asia-Pacific (23%), Rest of World (10%)


Market Size Estimation

Revenue mapping and container deployment volume analysis were employed to determine the global market valuation. The methodology comprised the following:

Docker Inc., Red Hat (IBM), VMware, Microsoft Azure, Amazon Web Services, Google Cloud Platform, and emerging players in the container orchestration space are among the 50+ main vendors identified in North America, Europe, Asia-Pacific, and Latin America.

Cross-platform product mapping for Docker containers, Kubernetes distributions, OpenShift platforms, Amazon ECS/EKS, Azure Container Instances, Google Kubernetes Engine (GKE), and Rancher container management platforms

Examination of the annual revenues that have been reported and modeled for container platform portfolios, which include support subscriptions, managed services, and licensing.

In 2024, the coverage of vendors will account for 75-80% of the global market share.

The following methods are employed to derive segment-specific valuations across cloud-based, on-premises, and hybrid deployment models: extrapolation using bottom-up (container deployment volume × ARPU by deployment model and region) and top-down (vendor revenue validation against public filings).

Download Free Sample

Kindly complete the form below to receive a free sample of this Report

Download PDF ×

We do not share your information with anyone. However, we may send you emails based on your report interest from time to time. You may contact us at any time to opt-out.