Certified Global Research Member
Isomar fd.webp Wcrc 57.webp
Key Questions Answered
  • Global Market Outlook
  • In-depth analysis of global and regional trends
  • Analyze and identify the major players in the market, their market share, key developments, etc.
  • To understand the capability of the major players based on products offered, financials, and strategies.
  • Identify disrupting products, companies, and trends.
  • To identify opportunities in the market.
  • Analyze the key challenges in the market.
  • Analyze the regional penetration of players, products, and services in the market.
  • Comparison of major playersโ€™ financial performance.
  • Evaluate strategies adopted by major players.
  • Recommendations
Why Choose Market Research Future?
  • Vigorous research methodologies for specific market.
  • Knowledge partners across the globe
  • Large network of partner consultants.
  • Ever-increasing/ Escalating data base with quarterly monitoring of various markets
  • Trusted by fortune 500 companies/startups/ universities/organizations
  • Large database of 5000+ markets reports.
  • Effective and prompt pre- and post-sales support.

Amblyopia Market Research Report Information By Type (
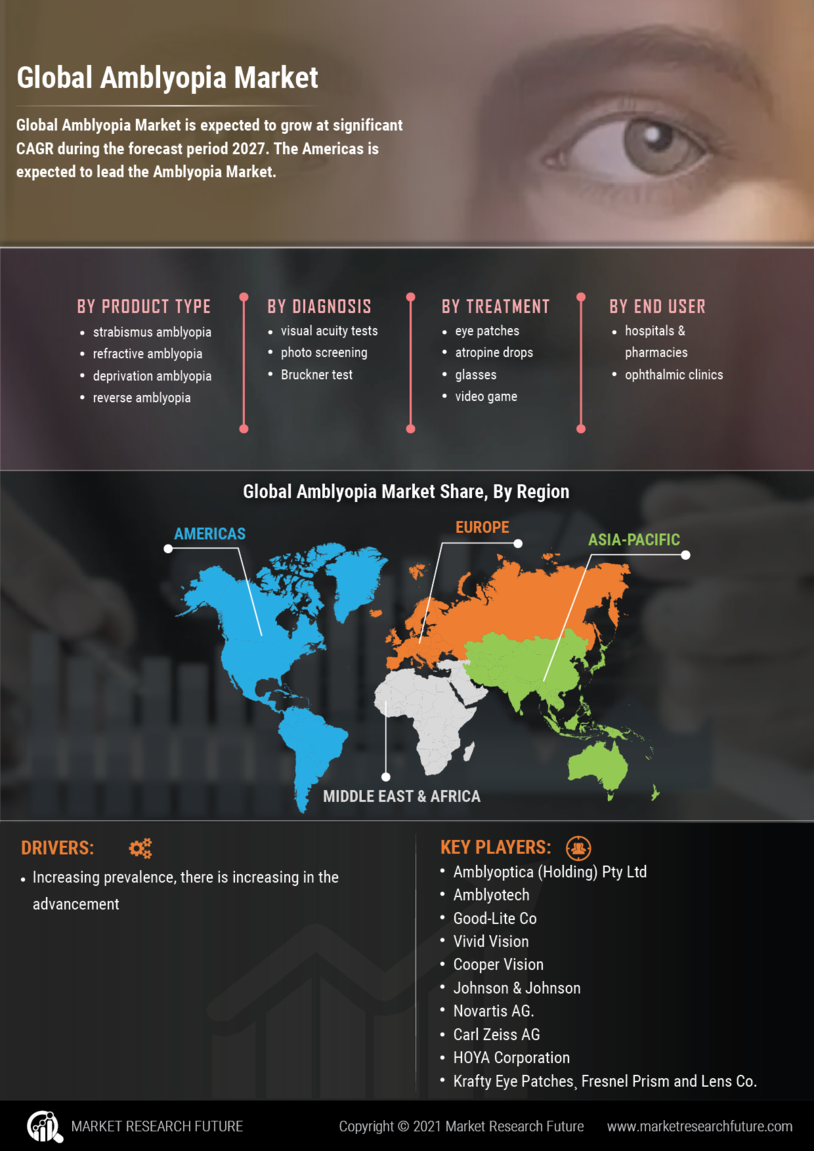
Strabismus amblyopia, Refractive amblyopia, Deprivation amblyopia, and Reverse amblyopia), By Diagnosis (Visual acuity tests, Photo screening, Bruckner test, and Others), By Treatment (Eye patches, Atropine drops, Glasses, Video game, and Others), By End-Users (Hospitals & pharmacies, and Ophthalmic clinics), And By Region (North America, Europe, Asia-Pacific, And Rest Of The World) โ€“ Market Forecast Till 2032


ID: MRFR/MED/2967-HCR | 108 Pages | Author: Rahul Gotadki| April 2024

Research Methodology on Amblyopia Market


Introduction


This research aims to provide an in-depth analysis of the market and trends in the amblyopia market. Market Research Future (MRFR) conducted an extensive quantitative and qualitative market study, focusing on the size and growth of the amblyopia market as well as its key driving factors, opportunities, and challenges.


Research Aim and Objectives


This research aims to provide an in-depth study and comprehensive analysis of the trends in the amblyopia market and its growth prospects from 2023 to 2030. The objectives of this research are to:


  • Identify key market segments and assess their expected future market size.

  • Analyse the global trends influencing the amblyopia market, including market dynamics, value chain, pricing structures, and market development strategies.

  • Assess the key opportunities and challenges in the amblyopia market.

  • Analyse the level of market competition and global market share.

  • Profile the major players in the amblyopia market and assess their current and future business strategies.

  • Appraise the long-term prospects of the amblyopia market.


Research Methodology


The research methodology for the amblyopia market is adopted to provide a detailed and in-depth analysis of the market. Market Research Future (MRFR) analysed the market using quantitative and qualitative methodologies, including interviews, surveys and secondary research.


Secondary Research


The preliminary step in the research methodology is secondary research. During the initial phase of the research, comprehensive secondary research was conducted to identify the key players in the amblyopia market along with identifying the major manufacturers. The research is conducted using corporate documents such as annual reports, 10Ks and SEC filings, industry and trade publications, media sources, and online databases such as company websites and trade association websites.


Primary Research


Primary research is conducted to better understand the amblyopia market and assess the growth trajectory. MRFR interacted with leading industry experts and opinion leaders to obtain their views regarding the market. In-depth interviews are conducted with active participants in the amblyopia market. Furthermore, primary research is also conducted to assess the current trends and future outlook of the market.


Market Segmentation


The amblyopia market is segmented by product, application, end-user, and geography.


  • By product, the market is segmented into glasses, contact lenses, prescription medications, and intraocular lenses.

  • By application, the market is segmented into amblyopia, presbyopia, astigmatism, and refractive errors.

  • By end user, the market is segmented into hospitals and clinics, optical stores, and online stores.

  • By geography, the market is segmented into North America, Europe, Asia-Pacific, and the Middle East & Africa.


Data Collection


Data for the market is sourced from a combination of primary and secondary sources. At the primary stage of data collection, multiple interviews were conducted with industry stakeholders to understand the current trends in the market. Data is also gathered from reliable sources, such as industry and trade journals, reports, online databases, and company websites. All the gathered data was analysed, processed, and validated to ascertain an accurate assessment of the market.


Data Analysis


Data analysis is conducted to evaluate the market size and its potential in the coming years. The market size is estimated using data collected through primary sources and verified through both top-down and bottom-up approaches. Detailed data analysis includes going through the existing market trends and analyzing them over the projected period.


Competition Analysis


Competition analysis is conducted to gain an understanding of the competitive landscape of the amblyopia market. The competitive landscape is evaluated based on market shares, growth strategies, geographical presence, and product portfolio. The analysis identified the major participants in the market, including their company description, financial performance, strategic roadmap, product portfolio, geographical presence, and recent developments.


Scope of the Study


The scope of the research covered the amblyopia market, focusing on growth drivers, opportunities, and challenges influencing the market and analysis of the market size and forecast. This report provides a detailed analysis of the amblyopia market and offers meaningful insights into the industry dynamics.


Research Assumptions


The research is based on certain assumptions relating to the market. These assumptions are based on interviews with industry stakeholders, including market experts and opinion leaders. The assumptions include assumptions regarding revenues and other incentives, which were validated with primary sources whenever possible.


Conclusion


This research offered a comprehensive assessment of the amblyopia market. The potential of the industry is evaluated, and key segments were identified. Market dynamics and challenges were analyzed, and an analysis of the competitive landscape was conducted. The data gathered was analyzed and compared to industry standards to validate the results and draw conclusions. The research is, therefore, expected to provide valuable insights into the growth and scope of the amblyopia market in the coming years.

Leading companies partner with us for data-driven Insights
client_1 client_2 client_3 client_4 client_5 client_6 client_7 client_8 client_9 client_10
Please fill in Business Email for Quick Response

1 Report Prologue

2 Introduction

2.1 Market Definition

2.2 Scope of Study

2.3 Research Objective

2.4 Assumptions amp Limitations

2.4.1 Assumptions

2.4.2 Limitations

3 Research Methodology

3.1.1 Primary Research Methodology

3.1.2 Secondary Research Methodology

3.1.3 Market Share Analysis

3.1.4 Market Pricing Approach

4, Market Dynamics

4.1 Introduction

4.2 Drivers

4.2.1 Increasing Prevalence of Ophthalmological Disorders

4.2.2 Favorable Government Funding

4.2.3 Product Advancements

4.3 Restraints

4.3.1 Lack of Awareness

4.3.2 Longer Duration of Treatment 28

4.4 Opportunity 29

4.4.1 Entering untapped markets 29

4.5 Mega Trend 30

4.5.1 Technological Trends 30

4.6 Macroeconomics 30n

5, Market Factor Analysis

5.1 Value Chain Analysis 32

5.1.1 RampD 32

5.1.2 Manufacturing 32

5.1.3 Distribution amp Sales 32

5.1.4 Postsales Monitoring 33

5.2 Porterrsquos Five Forces Model 33

5.2.1 Bargaining Power of Suppliers 33

5.2.2 Bargaining Power of Buyers 34

5.2.3 Threat of New Entrants 34

5.2.4 Threat of Substitutes 34

5.2.5 Intensity of Rivalry 34

5.3 Investment Opportunities 34

5.4 Pricing Analysis 34

5.5 Demand amp Supply Gap Analysis 35

6, Global Amblyopia Market By Type

6.1 Introduction 37

6.1.1 Strabismus Amblyopia 38

6.1.2 Refractive Amblyopia 38

6.1.3 Deprivation Amblyopia 38

6.1.4 Reverse Amblyopia 39n

7, Global Amblyopia Market By Diagnosis

7.1 Introduction 41

7.1.1 Visual acuity tests 41

7.1.2 Photo screening 41

7.1.3 Bruckner test 41n

8, Global Amblyopia Market By Treatment

8.1 Introduction 43

8.1.1 Eye Patches 44

8.1.2 Atropine Drops 44

8.1.3 Glasses 45

8.1.4 Video game 45

9, Global Amblyopia Market By End User

9.1 Introduction 47

9.1.1 Hospitals amp Pharmacies 48

9.1.2 Ophthalmic Clinics 48

10 Global Amblyopia Market By Region

10.1 Americas 51

10.1.1 North America 53

10.1.1.1 U.S. 55

10.1.1.2 Canada 56

10.1.2 South America 57

10.2 Europe 59

10.2.1 Western Europe 61

10.2.1.1 Germany 63

10.2.1.2 France 64

10.2.1.3 U.K. 65

10.2.1.4 Italy 66

10.2.1.5 Spain 67

10.2.1.6 Rest of Western Europe 68

10.2.2 Eastern Europe 69

10.3 Asia Pacific 71

10.3.1 Japan 73

10.3.2 China 74

10.3.3 India 75

10.3.4 Australia 76

10.3.5 Republic of Korea 77

10.3.6 Rest of Asia Pacific 78

10.4 Middle East amp Africa 80

10.4.1 Middle East 82

10.4.2 Africa 84

11, Company Landscape

11.1 Key Player Analysis, by Product 87

11.1.1 Patches 87

11.1.2 Video Games 87

11.1.3 Glasses 87

11.2 Key Growth Strategy Analysis 87

11.3 Recent key developments 87n

12, Company Profile

12.1 Amblyoptica Holding Pty Ltd 90

12.1.1 Company Overview 90

12.1.2 Financials 90

12.1.3 Products 90

12.1.4 Strategy 90

12.1.5 Key Developments 90

12.2 Amblyotech, Inc. 91

12.2.1 Company Overview 91

12.2.2 Financials 91

12.2.3 Products 91

12.2.4 Strategy 91

12.2.5 Key Developments 91

12.3 GoodLite Co 92

12.3.1 Company Overview 92

12.3.2 Financials 92

12.3.3 Products 92

12.3.4 Strategy 92

12.3.5 Key Developments 92

12.4 Vivid Vision, Inc. 93

12.4.1 Company Overview 93

12.4.2 Financials 93

12.4.3 Products 93

12.4.4 Strategy 93

12.4.5 Key Developments 93

12.5 CooperVision 94

12.5.1 Company Overview 94

12.5.2 Financials 94

12.5.3 Products 94

12.5.4 Strategy 94

12.5.5 Key Developments 94

12.6 Johnson amp Johnson 95

12.6.1 Company Overview 95

12.6.2 Financials 95

12.6.3 Products 95

12.6.4 Strategy 95

12.6.5 Key Developments 95

12.7 Novartis AG. 96

12.7.1 Company Overview 96

12.7.2 Financials 96

12.7.3 Products 96

12.7.4 Strategy 96

12.7.5 Key Developments 96

12.8 Carl Zeiss AG 97

12.8.1 Company Overview 97

12.8.2 Financials 97

12.8.3 Products 97

12.8.4 Strategy 97

12.8.5 Key Developments 97

12.9 HOYA Corporation 98

12.9.1 Company Overview 98

12.9.2 Financials 98

12.9.3 Products 98

12.9.4 Strategy 98

12.9.5 Key Developments 98

12.10 Krafty Eye Patches. 99

12.10.1 Company Overview 99

12.10.2 Financials 99

12.10.3 Products 99

12.10.4 Strategy 99

12.10.5 Key Developments 99

12.11 Fresnel Prism and Lens Co. 100

12.11.1 Company Overview 100

12.11.2 Financials 100

12.11.3 Products 100

12.11.4 Strategy 100

12.11.5 Key Developments 100

12.12 Hilco Vision 101

12.12.1 Company Overview 101

12.12.2 Financials 101

12.12.3 Products 101

12.12.4 Strategy 101

12.12.5 Key Developments 101

12.13 McKesson Corporation 102

12.13.1 Company Overview 102

12.13.2 Financials 102

12.13.3 Products 102

12.13.4 Strategy 102

12.13.5 Key Developments 102

13, Conclusion

13.1 Key Findings 104

13.1.1 The CEOrsquos Viewpoint 104

13.1.2 Unmet Needs 104

13.1.3 Key Companies to Watch 104

13.1.4 Prediction of Amblyopia Industry 104n

14, Appendix

14.1 Discussion Blue Print 106n14.2 References 107

15 List of Tables

TABLE 1 PRIMARY INTERVIEWS

TABLE 2 GLOBAL AMBLYOPIA MARKET, BY TYPE 20142023 USD MILLION 37

TABLE 3 GLOBAL AMBLYOPIA MARKET, BY STRABISMUS AMBLYOPIA 20142023 USD MILLION 38

TABLE 4 GLOBAL AMBLYOPIA MARKET, BY REFRACTIVE AMBLYOPIA 20142023 USD MILLION 38

TABLE 5 GLOBAL AMBLYOPIA MARKET, BY DEPRIVATION AMBLYOPIA 20142023 USD MILLION 38

TABLE 6 GLOBAL AMBLYOPIA MARKET, BY REVERSE AMBLYOPIA 20142023 USD MILLION 39

TABLE 7 GLOBAL AMBLYOPIA MARKET, BY TREATMENT 20142023 USD MILLION 44

TABLE 8 GLOBAL AMBLYOPIA MARKET, EYE PATCHES 20142023 USD MILLION 44

TABLE 9 GLOBAL AMBLYOPIA MARKET, ATROPINE DROPS 20142023 USD MILLION 44

TABLE 10 GLOBAL AMBLYOPIA MARKET, GLASSES 20142023 USD MILLION 45

TABLE 11 GLOBAL AMBLYOPIA MARKET, VIDEO GAME 20142023 USD MILLION 45

TABLE 12 GLOBAL AMBLYOPIA MARKET, BY END USER 20142023 USD MILLION 47

TABLE 13 GLOBAL AMBLYOPIA MARKET, HOSPITALS amp PHARMACIES 20142023 USD MILLION 48

TABLE 14 GLOBAL AMBLYOPIA MARKET, OPHTHALMIC CLINICS 20142023 USD MILLION 48

TABLE 15 GLOBAL AMBLYOPIA MARKET, BY REGION 20142023 USD MILLION 50

TABLE 16 AMERICAS AMBLYOPIA MARKET, BY REGION 20142023 USD MILLION 52

TABLE 17 AMERICAS AMBLYOPIA MARKET, BY TYPE 20142023 USD MILLION 52

TABLE 18 AMERICAS AMBLYOPIA MARKET, BY TREATMENT 20142023 USD MILLION 53

TABLE 19 AMERICAS AMBLYOPIA MARKET, BY END USER 20142023 USD MILLION 53

TABLE 20 NORTH AMERICA AMBLYOPIA MARKET, BY COUNTRY 20142023 USD MILLION 54

TABLE 21 NORTH AMERICA AMBLYOPIA MARKET, BY TYPE 20142023 USD MILLION 54

TABLE 22 NORTH AMERICA AMBLYOPIA MARKET, BY TREATMENT 20142023 USD MILLION 54

TABLE 23 NORTH AMERICA AMBLYOPIA MARKET, BY END USER 20142023 USD MILLION 55

TABLE 24 U.S. AMBLYOPIA MARKET, BY TYPE 20142023 USD MILLION 55

TABLE 25 U.S. AMBLYOPIA MARKET, BY TREATMENT 20142023 USD MILLION 55

TABLE 26 U.S. AMBLYOPIA MARKET, BY END USER 20142023 USD MILLION 56

TABLE 27 CANADA AMBLYOPIA MARKET, BY TYPE 20142023 USD MILLION 56

TABLE 28 CANADA AMBLYOPIA MARKET, BY TREATMENT 20142023 USD MILLION 56

TABLE 29 CANADA AMBLYOPIA MARKET, BY END USER 20142023 USD MILLION 57

TABLE 30 SOUTH AMERICA AMBLYOPIA MARKET, BY TYPE 20142023 USD MILLION 57

TABLE 31 SOUTH AMERICA AMBLYOPIA MARKET, BY TREATMENT 20142023 USD MILLION 57

TABLE 32 SOUTH AMERICA AMBLYOPIA MARKET, BY END USER 20142023 USD MILLION 58

TABLE 33 EUROPE AMBLYOPIA MARKET, BY REGION 20142023 USD MILLION 60

TABLE 34 EUROPE AMBLYOPIA MARKET, BY TYPE 20142023 USD MILLION 60

TABLE 35 EUROPE AMBLYOPIA MARKET, BY TREATMENT 20142023 USD MILLION 61

TABLE 36 EUROPE AMBLYOPIA MARKET, BY END USER 20142023 USD MILLION 61

TABLE 37 WESTERN EUROPE AMBLYOPIA MARKET, BY COUNTRY 20142023 USD MILLION 62

TABLE 38 WESTERN EUROPE AMBLYOPIA MARKET, BY TYPE 20142023 USD MILLION 62

TABLE 39 WESTERN EUROPE AMBLYOPIA MARKET, BY TREATMENT 20142023 USD MILLION 62

TABLE 40 WESTERN EUROPE AMBLYOPIA MARKET, BY END USER 20142023 USD MILLION 63

TABLE 41 GERMANY AMBLYOPIA MARKET, BY TYPE 20142023 USD MILLION 63

TABLE 42 GERMANY AMBLYOPIA MARKET, BY TREATMENT 20142023 USD MILLION 63

TABLE 43 GERMANY AMBLYOPIA MARKET, BY END USER 20142023 USD MILLION 64

TABLE 44 FRANCE AMBLYOPIA MARKET, BY TYPE 20142023 USD MILLION 64

TABLE 45 FRANCE AMBLYOPIA MARKET, BY TREATMENT 20142023 USD MILLION 64

TABLE 46 FRANCE AMBLYOPIA MARKET, BY END USER 20142023 USD MILLION 65

TABLE 47 U.K. AMBLYOPIA MARKET, BY TYPE 20142023 USD MILLION 65

TABLE 48 U.K. AMBLYOPIA MARKET, BY TREATMENT 20142023 USD MILLION 65

TABLE 49 U.K. AMBLYOPIA MARKET, BY END USER 20142023 USD MILLION 66

TABLE 50 ITALY AMBLYOPIA MARKET, BY TYPE 20142023 USD MILLION 66

TABLE 51 ITALY AMBLYOPIA MARKET, BY TREATMENT 20142023 USD MILLION 66

TABLE 52 ITALY AMBLYOPIA MARKET, BY END USER 20142023 USD MILLION 67

TABLE 53 SPAIN AMBLYOPIA MARKET, BY TYPE 20142023 USD MILLION 67

TABLE 54 SPAIN AMBLYOPIA MARKET, BY TREATMENT 20142023 USD MILLION 67

TABLE 55 SPAIN AMBLYOPIA MARKET, BY END USER 20142023 USD MILLION 68

TABLE 56 REST OF WESTERN EUROPE AMBLYOPIA MARKET, BY TYPE 20142023 USD MILLION 68

TABLE 57 REST OF WESTERN EUROPE AMBLYOPIA MARKET, BY TREATMENT 20142023 USD MILLION 68

TABLE 58 REST OF WESTERN EUROPE AMBLYOPIA MARKET, BY END USER 20142023 USD MILLION 69

TABLE 59 EASTERN EUROPE AMBLYOPIA MARKET, BY TYPE 20142023 USD MILLION 69

TABLE 60 EASTERN EUROPE AMBLYOPIA MARKET, BY TREATMENT 20142023 USD MILLION 69

TABLE 61 EASTERN EUROPE AMBLYOPIA MARKET, BY END USER 20142023 USD MILLION 70

TABLE 62 ASIA PACIFIC AMBLYOPIA MARKET, BY COUNTRY 20142023 USD MILLION 72

TABLE 63 ASIA PACIFIC AMBLYOPIA MARKET, BY TYPE 20142023 USD MILLION 72

TABLE 64 ASIA PACIFIC AMBLYOPIA MARKET, BY TREATMENT 20142023 USD MILLION 73

TABLE 65 ASIA PACIFIC AMBLYOPIA MARKET, BY END USER 20142023 USD MILLION 73

TABLE 66 JAPAN AMBLYOPIA MARKET, BY TYPE 20142023 USD MILLION 73

TABLE 67 JAPAN AMBLYOPIA MARKET, BY TREATMENT 20142023 USD MILLION 74

TABLE 68 JAPAN AMBLYOPIA MARKET, BY END USER 20142023 USD MILLION 74

TABLE 69 CHINA AMBLYOPIA MARKET, BY TYPE 20142023 USD MILLION 74

TABLE 70 CHINA AMBLYOPIA MARKET, BY TREATMENT 20142023 USD MILLION 75

TABLE 71 CHINA AMBLYOPIA MARKET, BY END USER 20142023 USD MILLION 75

TABLE 72 INDIA AMBLYOPIA MARKET, BY TYPE 20142023 USD MILLION 75

TABLE 73 INDIA AMBLYOPIA MARKET, BY TREATMENT 20142023 USD MILLION 76

TABLE 74 INDIA AMBLYOPIA MARKET, BY END USER 20142023 USD MILLION 76

TABLE 75 AUSTRALIA AMBLYOPIA MARKET, BY TYPE 20142023 USD MILLION 76

TABLE 76 AUSTRALIA AMBLYOPIA MARKET, BY TREATMENT 20142023 USD MILLION 77

TABLE 77 AUSTRALIA AMBLYOPIA MARKET, BY END USER 20142023 USD MILLION 77

TABLE 78 REPUBLIC OF KOREA AMBLYOPIA MARKET, BY TYPE 20142023 USD MILLION 77

TABLE 79 REPUBLIC OF KOREA AMBLYOPIA MARKET, BY TREATMENT 20142023 USD MILLION 78

TABLE 80 REPUBLIC OF KOREA AMBLYOPIA MARKET, BY END USER 20142023 USD MILLION 78

TABLE 81 REST OF ASIA PACIFIC AMBLYOPIA MARKET, BY TYPE 20142023 USD MILLION 78

TABLE 82 REST OF ASIA PACIFIC AMBLYOPIA MARKET, BY TREATMENT 20142023 USD MILLION 79

TABLE 83 REST OF ASIA PACIFIC AMBLYOPIA MARKET, BY END USER 20142023 USD MILLION 79

TABLE 84 MIDDLE EAST amp AFRICA AMBLYOPIA MARKET, BY REGION 20142023 USD MILLION 81

TABLE 85 MIDDLE EAST amp AFRICA AMBLYOPIA MARKET, BY TYPE 20142023 USD MILLION 81

TABLE 86 MIDDLE EAST amp AFRICA AMBLYOPIA MARKET, BY TREATMENT 20142023 USD MILLION 82

TABLE 87 MIDDLE EAST amp AFRICA AMBLYOPIA MARKET, BY END USER 20142023 USD MILLION 82

TABLE 88 MIDDLE EAST AMBLYOPIA MARKET, BY TYPE 20142023 USD MILLION 82

TABLE 89 MIDDLE EAST AMBLYOPIA MARKET, BY TREATMENT 20142023 USD MILLION 82

TABLE 90 MIDDLE EAST AMBLYOPIA MARKET, BY END USER 20142023 USD MILLION 84

TABLE 91 AFRICA AMBLYOPIA MARKET, BY TYPE 20142023 USD MILLION 84

TABLE 92 AFRICA AMBLYOPIA MARKET, BY TREATMENT 20142023 USD MILLION 84

TABLE 93 AFRICA AMBLYOPIA MARKET, BY END USER 20142023 USD MILLION 85

16 List of Figures

FIGURE 1 GLOBAL AMBLYOPIA MARKET 17

FIGURE 2 RESEARCH METHODOLOGY

FIGURE 3 GLOBAL AMBLYOPIA MARKET FORECAST MODEL 21

FIGURE 4 VALUE CHAIN GLOBAL AMBLYOPIA MARKET 32

FIGURE 5 PORTERS FIVE FORCES MODELGLOBAL AMBLYOPIA MARKET 33

FIGURE 6 GLOBAL AMBLYOPIA MARKET, BY TYPE 2017 amp 2023 USD MILLION 37

FIGURE 7 GLOBAL AMBLYOPIA MARKET, BY TREATMENT 2017 amp 2023 USD MILLION 43

FIGURE 8 GLOBAL AMBLYOPIA MARKET, BY END USER 2017 amp 2023 USD MILLION 47

FIGURE 9 GLOBAL AMBLYOPIA MARKET, BY REGION 2017 amp 2023 USD MILLION 50

FIGURE 10 AMERICAS AMBLYOPIA MARKET, BY REGION 2017 amp 2023 USD MILLION 52

FIGURE 11 NORTH AMERICA AMBLYOPIA MARKET, BY COUNTRY 2017 amp 2023 USD MILLION 53

FIGURE 12 EUROPE AMBLYOPIA MARKET, BY REGION 2017 amp 2023 USD MILLION 60

FIGURE 13 WESTERN EUROPE AMBLYOPIA MARKET, BY COUNTRY 2017 amp 2023 USD MILLION 61

FIGURE 14 ASIA PACIFIC AMBLYOPIA MARKET, BY COUNTRY 2017 amp 2023 USD MILLION 72

FIGURE 15 MIDDLE EAST amp AFRICA AMBLYOPIA MARKET, BY REGION 20142023 USD MILLION 81

Purchase Option
Single User $ 4,950
Multiuser License $ 5,950
Enterprise User $ 7,250
Compare Licenses
Tailored for You
  • Dedicated Research on any specifics segment or region.
  • Focused Research on specific players in the market.
  • Custom Report based only on your requirements.
  • Flexibility to add or subtract any chapter in the study.
  • Historic data from 2014 and forecasts outlook till 2040.
  • Flexibility of providing data/insights in formats (PDF, PPT, Excel).
  • Provide cross segmentation in applicable scenario/markets.