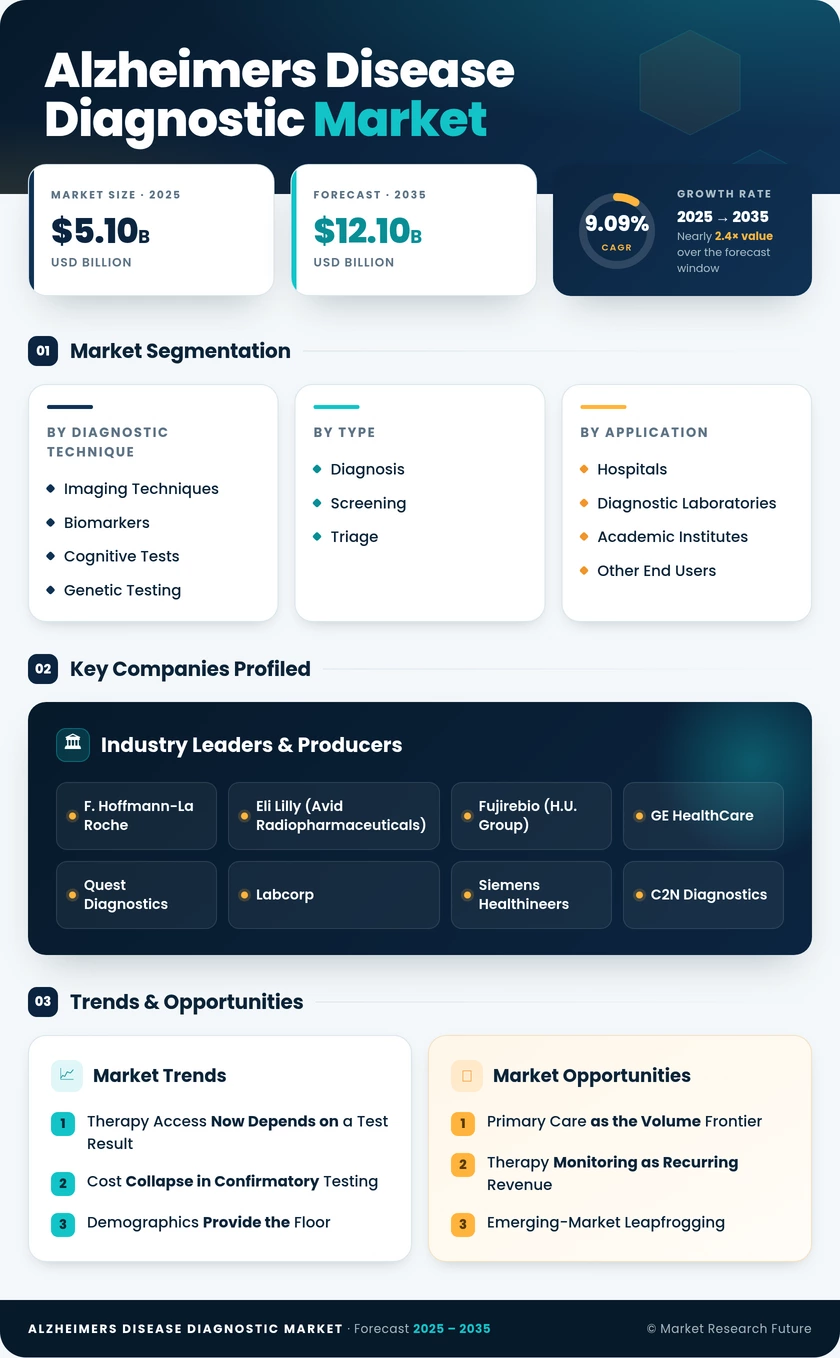
Alzheimer's Disease Diagnostic Market (2026 - 2035)

Alzheimer's Disease Diagnostic Market Research Report: Size, Share, Trend Analysis By Types (Early Onset Alzheimers, Late Onset Alzheimers, Familial Alzheimers Disease, and Others), By Diagnostic Tests (Genetic Testing, Neurological Exam, Mini Mental State Exam (MMSE), Brain Imaging, and Others), By End Users (Clinic, Hospital, Diagnostic Center, and Others), and By Region (North America, Europe, Asia-Pacific, and Rest Of The World) - Growth Outlook & Industry Forecast 2025 To 2035

Forecast Period
2026-2035
CAGR
9.09%
2025 Market Size
USD 5.10 Billion
2035 Market Size
USD 12.10 Billion
Medical Device ● Updated August 2026 Report ID: MRFR/MED/1597-HCR | Pages: 90 | Author: Satyendra Maurya, Rahul Gotadki
  1. 1 Market Summary |
    1. 1.1 Study Assumptions & Market Definition |
    2. 1.2 Scope of the Study |
    3. 1.3 Research Methodology
  2. 2 Key Report Takeaways |
    1. 2.1 By Diagnostic Technique |
    2. 2.2 By Type and End User |
    3. 2.3 By Geography
  3. 3 Market Size & Forecast (2021–2035) |
    1. 3.1 Historical Market Size (2021–2025) |
    2. 3.2 Current & Forecast Market Size (2026–2035) |
    3. 3.3 Year-over-Year Growth Analysis
  4. 4 Driver Impact Analysis |
    1. 4.1 Therapy Access Now Depends on a Test Result |
    2. 4.2 Cost Collapse in Confirmatory Testing |
    3. 4.3 Demographics Provide the Floor |
    4. 4.4 Algorithmic Triage Improves Yield
  5. 5 Restraints Impact Analysis |
    1. 5.1 Coverage Has Not Kept Pace With Clearance |
    2. 5.2 Results That Do Not Travel Between Laboratories |
    3. 5.3 Capacity, Not Demand, Caps Imaging Volume
  6. 6 Opportunities |
    1. 6.1 Primary Care as the Volume Frontier |
    2. 6.2 Therapy Monitoring as Recurring Revenue |
    3. 6.3 Emerging-Market Leapfrogging |
    4. 6.4 Data Monetisation and Trial Enrichment |
    5. 6.5 Bundled Pathway Contracting
  7. 7 Regional Market Share & Country-Level Analysis |
    1. 7.1 North America | |
      1. 7.1.1 US | |
      2. 7.1.2 Canada | |
      3. 7.1.3 Mexico |
    2. 7.2 Europe | |
      1. 7.2.1 Germany | |
      2. 7.2.2 UK | |
      3. 7.2.3 France | |
      4. 7.2.4 Italy | |
      5. 7.2.5 Spain | |
      6. 7.2.6 Nordic Countries | |
      7. 7.2.7 Russia | |
      8. 7.2.8 Rest of Europe |
    3. 7.3 Asia-Pacific | |
      1. 7.3.1 China | |
      2. 7.3.2 India | |
      3. 7.3.3 Japan | |
      4. 7.3.4 South Korea | |
      5. 7.3.5 ASEAN | |
      6. 7.3.6 Rest of Asia-Pacific |
    4. 7.4 South America | |
      1. 7.4.1 Brazil | |
      2. 7.4.2 Argentina | |
      3. 7.4.3 Rest of South America |
    5. 7.5 Middle East & Africa | |
      1. 7.5.1 Saudi Arabia | |
      2. 7.5.2 UAE | |
      3. 7.5.3 South Africa | |
      4. 7.5.4 Egypt | |
      5. 7.5.5 Rest of Middle East & Africa
  8. 8 Future Outlook (2026–2035) |
    1. 8.1 Testing Moves Out of the Specialist Suite |
    2. 8.2 Monitoring Becomes a Distinct Product Category |
    3. 8.3 Multi-Analyte Panels Replace Single Markers |
    4. 8.4 Standards Arrive and Reset Competition
  9. 9 Market Segmentation Analysis |
    1. 9.1 By Diagnostic Technique | |
      1. 9.1.1 Biomarkers | |
      2. 9.1.2 Imaging Techniques | |
      3. 9.1.3 Genetic Testing | |
      4. 9.1.4 Cognitive Tests |
    2. 9.2 By Type | |
      1. 9.2.1 Diagnosis | |
      2. 9.2.2 Screening | |
      3. 9.2.3 Triage |
    3. 9.3 By End User | |
      1. 9.3.1 Hospitals | |
      2. 9.3.2 Diagnostic Laboratories | |
      3. 9.3.3 Academic Institutes | |
      4. 9.3.4 Other End Users
  10. 10 Competitive Landscape |
    1. 10.1 Market Concentration Analysis (2026) |
    2. 10.2 Competitive Benchmarking Matrix |
    3. 10.3 Company Profiles | |
      1. 10.3.1 F. Hoffmann-La Roche | |
      2. 10.3.2 Eli Lilly (Avid Radiopharmaceuticals) | |
      3. 10.3.3 Fujirebio (H.U. Group) | |
      4. 10.3.4 GE HealthCare | |
      5. 10.3.5 Quest Diagnostics | |
      6. 10.3.6 Labcorp | |
      7. 10.3.7 Siemens Healthineers | |
      8. 10.3.8 C2N Diagnostics | |
      9. 10.3.9 Beckman Coulter Diagnostics | |
      10. 10.3.10 Life Molecular Imaging
  11. 11 Recent News & Developments
  12. 12 Report Scope & Methodology
  13. 13 Detailed Sources & Citations
  14. 14 Frequently Asked Questions
  15. 15 LIST OF TABLES |
  16. TABLE 1 Global Alzheimer’s Disease Diagnostic Market Size & Forecast, by Revenue (USD billion), 2021–2035 |
  17. TABLE 2 Global Alzheimer’s Disease Diagnostic Market – Year-over-Year Growth Analysis, 2021–2035 |
  18. TABLE 3 Driver Impact Analysis Matrix, 2026–2035 |
  19. TABLE 4 Restraint Impact Analysis Matrix, 2026–2035 |
  20. TABLE 5 Global Market Size, by Region, 2021–2035 (USD billion) |
  21. TABLE 6 North America Market Size, by Country, 2021–2035 (USD billion) |
  22. TABLE 7 Europe Market Size, by Country, 2021–2035 (USD billion) |
  23. TABLE 8 Asia-Pacific Market Size, by Country, 2021–2035 (USD billion) |
  24. TABLE 9 South America Market Size, by Country, 2021–2035 (USD billion) |
  25. TABLE 10 Middle East & Africa Market Size, by Country, 2021–2035 (USD billion) |
  26. TABLE 11 Global Market Size, by Diagnostic Technique, 2021–2035 (USD billion) |
  27. TABLE 12 Global Market Size, by Type, 2021–2035 (USD billion) |
  28. TABLE 13 Global Market Size, by End User, 2021–2035 (USD billion) |
  29. TABLE 14 North America Market Size, by Diagnostic Technique, 2021–2035 (USD billion) |
  30. TABLE 15 Europe Market Size, by Diagnostic Technique, 2021–2035 (USD billion) |
  31. TABLE 16 Asia-Pacific Market Size, by Diagnostic Technique, 2021–2035 (USD billion) |
  32. TABLE 17 Competitive Benchmarking Matrix, 2026 |
  33. TABLE 18 Company Profiles – Key Players |
  34. TABLE 19 Recent Developments & Strategic Announcements, 2023–2025 |
  35. TABLE 20 Report Scope & Methodology Summary |
  36. TABLE 21 Detailed Sources & Citations Index
  37. 16 LIST OF FIGURES |
  38. FIGURE 1 Market Dynamics – Drivers, Restraints & Opportunities Snapshot |
  39. FIGURE 2 Industry Value Chain Analysis |
  40. FIGURE 3 Porter's Five Forces Analysis |
  41. FIGURE 4 Global Market Size Trend, 2021–2035 (USD billion) |
  42. FIGURE 5 Year-over-Year Growth Curve, 2022–2035 |
  43. FIGURE 6 Market Share by Diagnostic Technique, 2025 vs 2035 |
  44. FIGURE 7 Market Share by Type, 2025 vs 2035 |
  45. FIGURE 8 Market Share by End User, 2025 vs 2035 |
  46. FIGURE 9 Regional Revenue Share, 2025 |
  47. FIGURE 10 Regional CAGR Comparison, 2026–2035 |
  48. FIGURE 11 Country-Level Revenue Heat Map, 2025 |
  49. FIGURE 12 Competitive Landscape – Estimated Revenue Share Bands, 2026 |
  50. FIGURE 13 Strategic Positioning Matrix – Scale vs Specialisation |
  51. FIGURE 14 Clinical Pathway Adoption Curve, 2026–2035
Share::
Request Free Sample

Segmentation Quick Reference

DimensionSub-SegmentsDominant SegmentFastest Growing Segment
By Diagnostic TechniqueBiomarkers, Imaging Techniques, Genetic Testing, Cognitive TestsImaging TechniquesBiomarkers
By TypeDiagnosis, Screening, TriageDiagnosisScreening
By End UserHospitals, Diagnostic Laboratories, Academic Institutes, Other End UsersHospitalsDiagnostic Laboratories
By GeographyNorth America, Europe, Asia-Pacific, Middle East and Africa, South AmericaNorth AmericaAsia-Pacific


Market Segmentation Overview

By Diagnostic Technique

Sub-SegmentKey Trend
BiomarkersPlasma testing displaces invasive sampling as first-line confirmation
Imaging TechniquesRepeat scanning for therapy monitoring offsets triage-driven volume loss.
Genetic TestingAPOE genotyping embedded in treatment eligibility workflows
Cognitive TestsDigital, tablet-administered batteries replace paper instruments.


Technique mix is shifting from capital-intensive confirmation toward sample-based confirmation, but imaging is not displaced — it is repositioned as the adjudicating step for equivocal and comorbid cases.

By Type

Sub-SegmentKey Trend
DiagnosisVolume tied directly to disease-modifying therapy prescribing pathways
ScreeningGovernment-funded population programmes drive step-change growth.
TriageAlgorithmic pre-filtering reduces downstream confirmatory waste.


Type mix reveals where funding originates: diagnosis is payer-funded and clinician-ordered, screening is government-funded and programme-driven, and triage is increasingly bundled into software subscriptions rather than billed separately.

By End User

Sub-SegmentKey Trend
HospitalsEnd-to-end pathway ownership from confirmation through infusion and monitoring
Diagnostic LaboratoriesNational draw-site networks convert primary-care demand into centralised volume.
Academic InstitutesTrial site activity and biomarker validation cohorts sustain demand.
Other End UsersLong-term care and specialty clinics adopt low-complexity screening.


End-user economics favour whoever controls the logistics between the collection point and the result. Hospitals retain the highest revenue per patient; laboratories capture the fastest incremental volume.

just now

Opus 5 High

Share::
Request Free Sample
Download PDF ×

We do not share your information with anyone. However, we may send you emails based on your report interest from time to time. You may contact us at any time to opt-out.