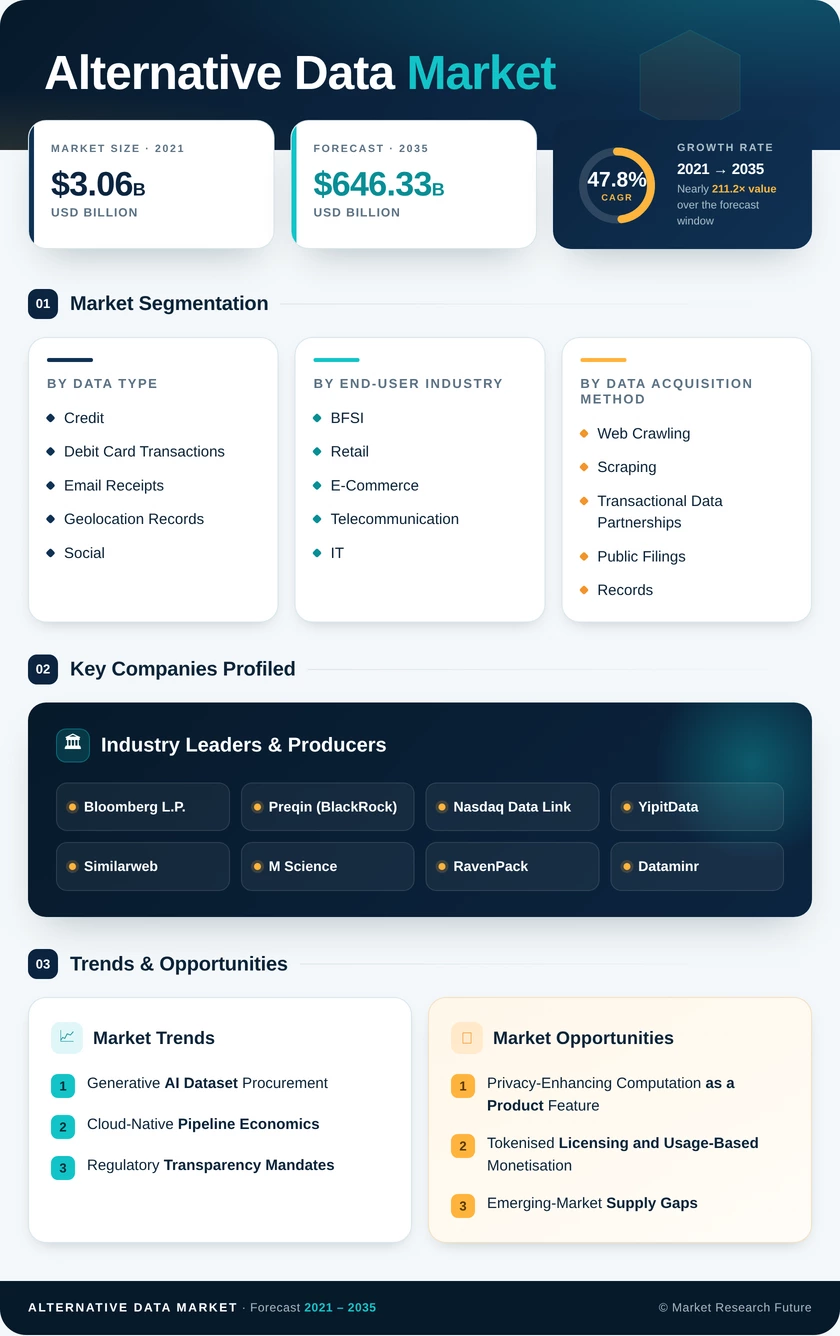
Market Segmentation Analysis
By Data Type
9.1.1 Credit and Debit Card Transactions
9.1.2 Email Receipts
9.1.3 Geolocation Records
9.1.4 Social and Sentiment Data
9.1.5 Mobile Application Usage
9.1.6 Web Scraped Data
9.1.7 Satellite and Weather Data
9.1.8 Agricultural Data
9.1.9 Other Data Types
By End-User Industry
9.2.1 BFSI
9.2.2 Retail and E-Commerce
9.2.3 Telecommunication and IT
9.2.4 Industrial and Manufacturing
9.2.5 Energy and Utilities
9.2.6 Transportation and Logistics
9.2.7 Real Estate and Construction
9.2.8 Media and Entertainment
9.2.9 Other End-User Industries
By Data Acquisition Method
9.3.1 Web Crawling and Scraping
9.3.2 Transactional Data Partnerships
9.3.3 Public Filings and Records
9.3.4 Proprietary Sensor/IoT Feeds
9.3.5 Crowd-Sourced Platforms
9.3.6 Other Acquisition Methods
By Application
9.4.1 Investment Signal Generation
9.4.2 Risk Management and Fraud Detection
| Dimension | Sub-Segments | Dominant Segment | Fastest Growing Segment |
| By Data Type | Credit and Debit Card Transactions; Email Receipts; Geolocation Records; Social and Sentiment Data; Mobile Application Usage; Web Scraped Data; Satellite and Weather Data; Agricultural Data; Other Data Types | Credit and Debit Card Transactions (25.4% share, 2025) | Geolocation Records (51.3% CAGR, 2026–2035) |
| By End-User Industry | BFSI; Retail and E-Commerce; Telecommunication and IT; Industrial and Manufacturing; Energy and Utilities; Transportation and Logistics; Real Estate and Construction; Media and Entertainment; Other End-User Industries | BFSI (30.4% share, 2025) | Retail and E-Commerce (48.7% CAGR, 2026–2035) |
| By Data Acquisition Method | Web Crawling and Scraping; Transactional Data Partnerships; Public Filings and Records; Proprietary Sensor/IoT Feeds; Crowd-Sourced Platforms; Other Acquisition Methods | Web Crawling and Scraping (28.1% share, 2025) | Proprietary Sensor/IoT Feeds (54.4% CAGR, 2026–2035) |
| By Application | Investment Signal Generation; Risk Management and Fraud Detection; Market Intelligence and Competitive Benchmarking; Customer Behavior Analytics; Supply-Chain Optimization; Other Applications | Investment Signal Generation (USD 4.36 billion, 2025) | Supply-Chain Optimization (43.2% CAGR, 2026–2035) |
Market Segmentation Overview
By Data Type
| Sub-Segment | Key Trend |
| Credit and Debit Card Transactions | Pricing softens as panel supply broadens, but audit-defensibility sustains demand. |
| Email Receipts | Basket-level detail valued; consented panel size caps expansion |
| Geolocation Records | Pseudonymisation techniques reopen previously restricted jurisdictions. |
| Social and Sentiment Data | Entity linking improves precision on narrative signals. |
| Mobile Application Usage | SDK consent changes compress historical comparability |
| Web Scraped Data | Content controls and enforcement narrow permissible collection |
| Satellite and Weather Data | Open imagery programmes lower base-layer acquisition costs. |
| Agricultural Data | Climate volatility raises yield-forecasting willingness to pay |
| Other Data Types | Experimental signals incubate before graduating to named categories. |
Credit and Debit Card Transactions lead this dimension because they map directly onto reported revenue lines, letting analysts validate a signal against audited filings — a property no behavioural stream matches. Geolocation Records grow fastest as privacy-preserving aggregation lets vendors sell spatial granularity without personal identifiers, restoring access in Europe and India. Web Scraped Data occupies an uncomfortable middle: cheap to produce, increasingly hard to license cleanly, and structurally exposed to publisher enforcement.
By End-User Industry
| Sub-Segment | Key Trend |
| BFSI | Deepest per-seat budgets; governance scrutiny lengthens onboarding |
| Retail and E-Commerce | Merchandising teams displace research as the buying centre. |
| Telecommunication and IT | Churn and network planning models absorb third-party panels. |
| Industrial and Manufacturing | Sensor telemetry purchased against maintenance cost avoidance. |
| Energy and Utilities | Satellite monitoring informs exploration and hedging strategy. |
| Transportation and Logistics | Route and capacity optimisation scales with fuel volatility |
| Real Estate and Construction | Footfall and occupancy data underpin site selection. |
| Media and Entertainment | Audience measurement fragments across streaming platforms |
| Other End-User Industries | Public health and policy research pilots expand slowly. |
BFSI holds the largest share because a single systematic manager may run dozens of concurrent licences, concentrating spend even as seat counts stay modest. Retail and E-Commerce expands fastest because the decision cycle is daily rather than quarterly, and merchandising budgets are larger and less compliance-constrained than research budgets. Industrial and Manufacturing follows a distinct logic entirely, buying telemetry with a maintenance-savings payback that survives procurement review more easily than any alpha claim.
By Data Acquisition Method
| Sub-Segment | Key Trend |
| Web Crawling and Scraping | Legal exposure rising; buyers demand documented collection authority |
| Transactional Data Partnerships | High barriers to entry create durable contractual moats. |
| Public Filings and Records | Indispensable for entity resolution and compliance workflows |
| Proprietary Sensor/IoT Feeds | Falling edge-hardware costs make instrumentation cheaper than proxies. |
| Crowd-Sourced Platforms | Gamified participation lowers unit collection cost. |
| Other Acquisition Methods | Synthetic and federated generation enter early commercial use. |
Web Crawling and Scraping still leads on revenue because marginal collection cost is near zero, but its position is the most fragile in the taxonomy as content controls tighten. Proprietary Sensor/IoT Feeds grow fastest for a hardware reason rather than a regulatory one: instrumenting an asset base now costs less than licensing an inferred proxy for it, and the resulting observations arrive continuously rather than in weekly batches. Transactional Data Partnerships sit between them — costly to originate, but contractually clean enough to satisfy the compliance reviews that increasingly gate purchase.
By Application
| Sub-Segment | Key Trend |
| Investment Signal Generation | Largest budget pool; share eroding as operational uses scale |
| Risk Management and Fraud Detection | Enriched feature sets improve real-time anomaly detection. |
| Market Intelligence and Competitive Benchmarking | Pricing and share tracking move into corporate strategy budgets. |
| Customer Behavior Analytics | Retention modelling absorbs receipt and app-usage panels. |
| Supply-Chain Optimization | Multimodal inputs lift forecast accuracy against ERP baselines. |
| Other Applications | Policy and public health research adopt commercial panels. |
Investment Signal Generation remains the largest application by absolute spend, anchored in the systematic and fundamental research desks that created the category. Supply-Chain Optimization grows fastest because combining sensor, weather, and trade-flow inputs produces measurable forecast improvement that operations leaders can defend without reference to trading performance — a materially easier internal sale. Risk Management and Fraud Detection benefit from the same enriched features while facing lighter procurement scrutiny, since the datasets rarely touch investment decisions and therefore avoid material non-public information review.


 Noah Malgeri
Co-Founder

 Peter Groot koerkamp
Account and Business Manager

 Younghwan Choi
Senior Retail Manager

 Mark Irwin
Management Consultant

 Akif Moroglu
Strategy & Business Development Director

 Guilherme Gomes Martins
Product Management Director

 Joseph Aguayo
Sales Operations & Pricing Manager

 La Terria Dodd
Program Support Specialist

 Rob Kooiker
Group Product Manager HVAC & Fire Protection GMA