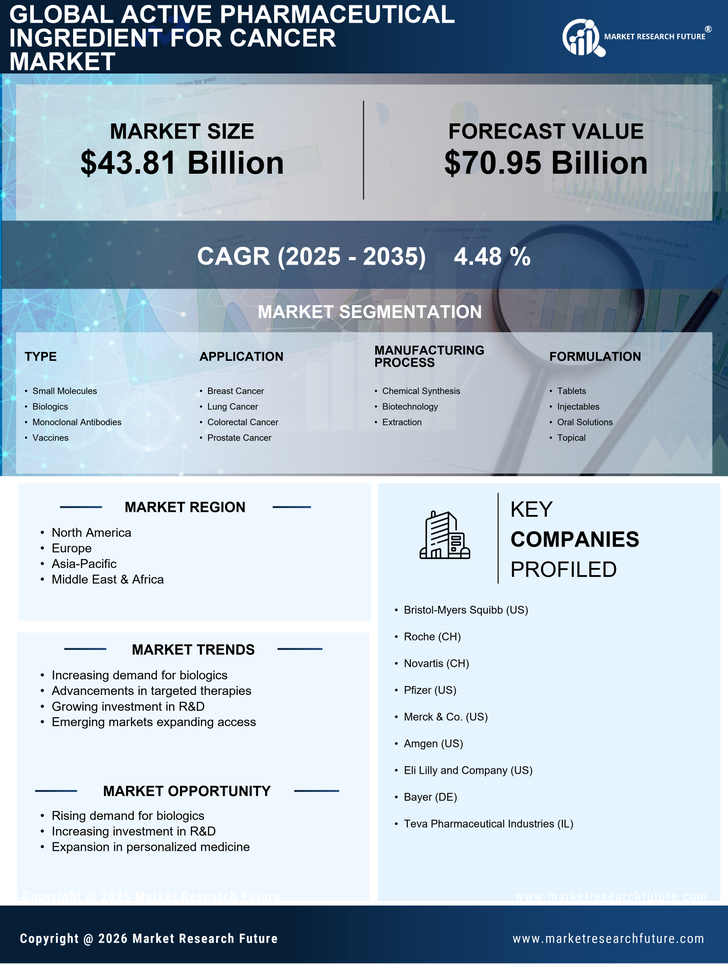
Active Pharmaceutical Ingredient for Cancer Market Segmentation
Active Pharmaceutical Ingredient for Cancer Market By Type (USD Billion, 2025-2035)
- Small Molecules
- Biologics
- Monoclonal Antibodies
- Vaccines
Active Pharmaceutical Ingredient for Cancer Market By Application (USD Billion, 2025-2035)
- Breast Cancer
- Lung Cancer
- Colorectal Cancer
- Prostate Cancer
Active Pharmaceutical Ingredient for Cancer Market By Manufacturing Process (USD Billion, 2025-2035)
- Chemical Synthesis
- Biotechnology
- Extraction
Active Pharmaceutical Ingredient for Cancer Market By Formulation (USD Billion, 2025-2035)
- Tablets
- Injectables
- Oral Solutions
- Topical