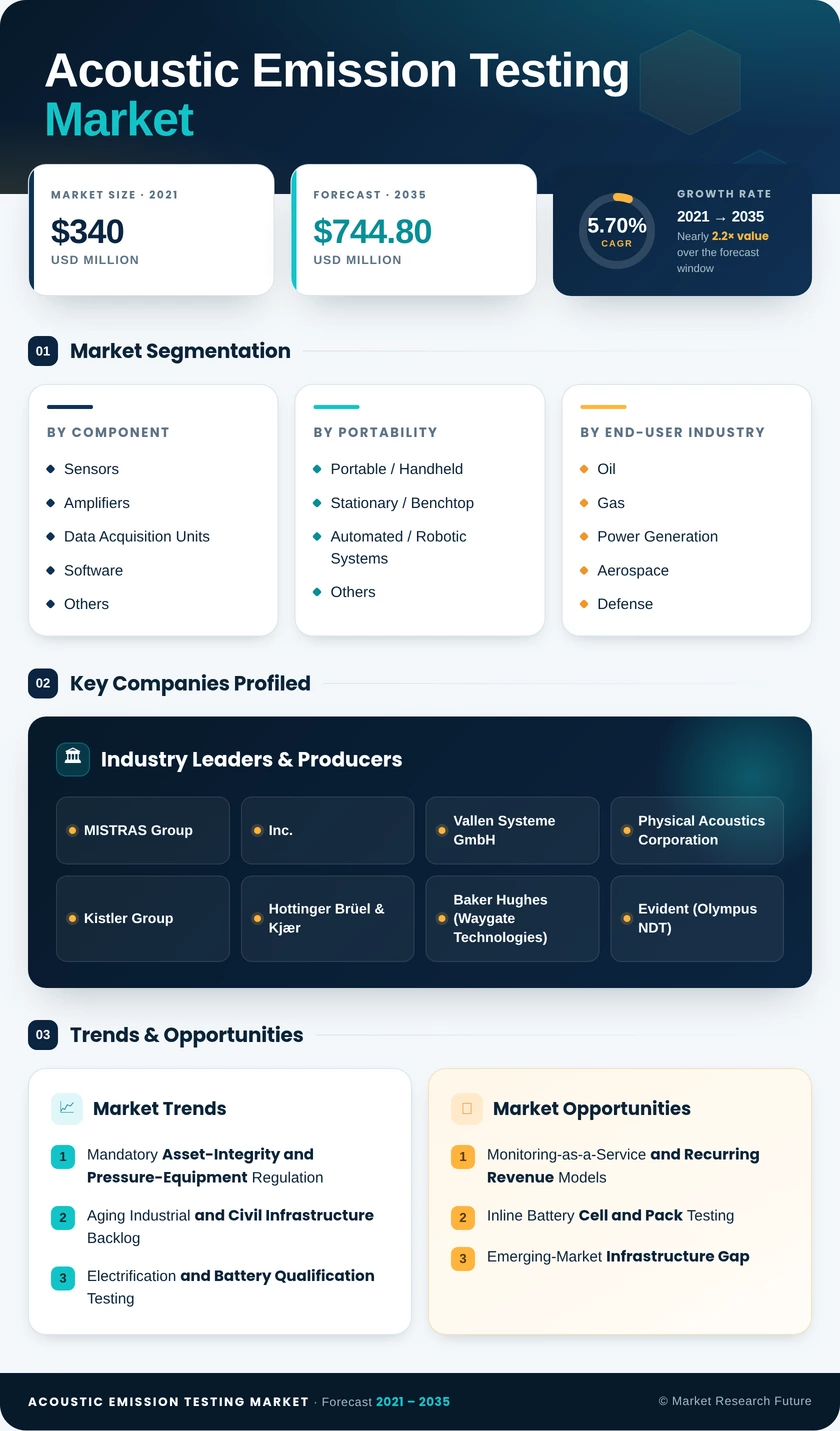
Acoustic Emission Testing Market (2026 – 2035)

ID: MRFR/SEM/30972-HCR 200 Pages Aarti Dhapte Last Updated: October 17, 2026
Acoustic Emission Testing Market Size, Share and Research Report By Component (Sensors, Amplifiers, Data Acquisition Units, Software, and Others), By Portability (Portable / Handheld, Stationary / Benchtop, Automated / Robotic Systems, and Others), By End-User Industry (Oil and Gas, Power Generation, Aerospace, Defense, Automotive and Transportation, Manufacturing and Heavy Engineering, Construction and Infrastructure, and Others) And By Region (North America, Europe, Asia-Pacific, And Rest Of The World) – Industry Forecast Till 2035
Acoustic Emission Testing Market
Market Size
Forecast Period2026-2035
CAGR (2026-2035)5.70%
2025 Market SizeUSD 427.8 Million
2035 Market SizeUSD 744.8 Million
Key Players
MISTRAS Group, Inc.
Vallen Systeme GmbH
Physical Acoustics Corporation
Kistler Group
Hottinger Brüel & Kjær
Baker Hughes
Opportunities
  • Monitoring-as-a-Service and Recurring Revenue Models
  • Inline Battery Cell and Pack Testing
  • Emerging-Market Infrastructure Gap
  1. 1 Market Summary | |
    1. 1.1 Study Assumptions & Market Definition | |
    2. 1.2 Scope of the Study | |
    3. 1.3 Research Methodology | |
  2. 2 Key Report Takeaways | |
    1. 2.1 By Component | |
    2. 2.2 By Portability | |
    3. 2.3 By End-User Industry | |
    4. 2.4 By Region | |
  3. 3 Market Size and Forecast (2021–2035) | |
    1. 3.1 Historical Market Size (2021–2025) | |
    2. 3.2 Current & Forecast Market Size (2026–2035) | |
    3. 3.3 Year-over-Year Growth Analysis | |
  4. 4 Driver Impact Analysis | |
    1. 4.1 Mandatory Asset-Integrity and Pressure-Equipment Regulation | |
    2. 4.2 Aging Industrial and Civil Infrastructure Backlog | |
    3. 4.3 Electrification and Battery Qualification Testing | |
    4. 4.4 Machine-Learning Waveform Classification | |
    5. 4.5 Robotic and Drone-Deployed Inspection | |
    6. 4.6 Hydrogen and Carbon-Capture Infrastructure | |
    7. 4.7 Nuclear Life-Extension and Small Modular Reactor Programmes | |
  5. 5 Restraints Impact Analysis | |
    1. 5.1 Shortage of Certified Level II and III Analysts | |
    2. 5.2 Ambient Noise and Interpretation Ambiguity | |
    3. 5.3 Capital Cost of Permanent Monitoring Arrays | |
    4. 5.4 Substitution by Phased-Array and Guided-Wave Methods | |
    5. 5.5 Fragmented Codes and Cross-Border Qualification | |
  6. 6 Opportunities | |
    1. 6.1 Monitoring-as-a-Service and Recurring Revenue Models | |
    2. 6.2 Inline Battery Cell and Pack Testing | |
    3. 6.3 Emerging-Market Infrastructure Gap | |
    4. 6.4 Hydrogen and Carbon Dioxide Pipeline Integrity | |
    5. 6.5 Fleet Benchmarking and Data Monetisation | |
  7. 7 Regional Market Share and Country-Level Analysis | |
    1. 7.1 North America | | |
      1. 7.1.1 US | | |
      2. 7.1.2 Canada | | |
      3. 7.1.3 Mexico | |
    2. 7.2 Europe | | |
      1. 7.2.1 Germany | | |
      2. 7.2.2 UK | | |
      3. 7.2.3 France | | |
      4. 7.2.4 Italy | | |
      5. 7.2.5 Spain | | |
      6. 7.2.6 Nordic Countries | | |
      7. 7.2.7 Russia | | |
      8. 7.2.8 Rest of Europe | |
    3. 7.3 Asia-Pacific | | |
      1. 7.3.1 China | | |
      2. 7.3.2 India | | |
      3. 7.3.3 Japan | | |
      4. 7.3.4 South Korea | | |
      5. 7.3.5 ASEAN | | |
      6. 7.3.6 Rest of Asia-Pacific | |
    4. 7.4 South America | | |
      1. 7.4.1 Brazil | | |
      2. 7.4.2 Argentina | | |
      3. 7.4.3 Rest of South America | |
    5. 7.5 Middle East & Africa | | |
      1. 7.5.1 Saudi Arabia | | |
      2. 7.5.2 UAE | | |
      3. 7.5.3 South Africa | | |
      4. 7.5.4 Egypt | | |
      5. 7.5.5 Rest of MEA | |
  8. 8 Future Outlook (2026–2035) | |
    1. 8.1 Autonomous Inspection Becomes Default | |
    2. 8.2 Platform Economics Reshape Vendor Margins | |
    3. 8.3 Electrification Supercycle Expands the Addressable Base | |
    4. 8.4 Integrity Disclosure Enters Sustainability Reporting | |
  9. 9 Segmentation Analysis | |
    1. 9.1 By Component | | |
      1. 9.1.1 Sensors | | |
      2. 9.1.2 Amplifiers | | |
      3. 9.1.3 Data Acquisition Units | | |
      4. 9.1.4 Software | | |
      5. 9.1.5 Others | |
    2. 9.2 By Portability | | |
      1. 9.2.1 Portable / Handheld | | |
      2. 9.2.2 Stationary / Benchtop | | |
      3. 9.2.3 Automated / Robotic Systems | | |
      4. 9.2.4 Others | |
    3. 9.3 By End-User Industry | | |
      1. 9.3.1 Oil and Gas | | |
      2. 9.3.2 Power Generation | | |
      3. 9.3.3 Aerospace | | |
      4. 9.3.4 Defense | | |
      5. 9.3.5 Automotive and Transportation | | |
      6. 9.3.6 Manufacturing and Heavy Engineering | | |
      7. 9.3.7 Construction and Infrastructure | | |
      8. 9.3.8 Others | |
  10. 10 Competitive Landscape | |
    1. 10.1 Market Share Analysis (2026) | |
    2. 10.2 Competitive Benchmarking Matrix | |
    3. 10.3 Company Profiles | | |
      1. 10.3.1 MISTRAS Group, Inc. | | |
      2. 10.3.2 Vallen Systeme GmbH | | |
      3. 10.3.3 Physical Acoustics Corporation | | |
      4. 10.3.4 Kistler Group | | |
      5. 10.3.5 Hottinger Brüel & Kjær | | |
      6. 10.3.6 Baker Hughes (Waygate Technologies) | | |
      7. 10.3.7 Evident (Olympus NDT) | | |
      8. 10.3.8 Eddyfi Technologies | | |
      9. 10.3.9 Sensor Networks, Inc. | | |
      10. 10.3.10 Digital Wave Corporation | | |
      11. 10.3.11 Applus+ RTD | |
  11. 11 Recent News & Developments | |
  12. 12 Report Scope and Methodology | |
    1. 12.1 Study Period & Base Year | |
    2. 12.2 Data Sources & Citations | |
    3. 12.3 Abbreviations | |
  13. 13 Detailed Sources and Citations | |
  14. 14 Frequently Asked Questions (FAQs) | | LIST OF TABLES | |
  15. TABLE 1 Global Acoustic Emission Testing Market Size & Forecast, by Revenue (USD Million), 2021–2035 | |
  16. TABLE 2 Global Market – Year-over-Year Growth Analysis, 2021–2035 | |
  17. TABLE 3 Driver Impact Analysis Matrix, 2026–2035 | |
  18. TABLE 4 Restraint Impact Analysis Matrix, 2026–2035 | |
  19. TABLE 5 Global Market Size, by Region, 2021–2035 (USD Million) | |
  20. TABLE 6 North America Market Size, by Country, 2021–2035 (USD Million) | |
  21. TABLE 7 Europe Market Size, by Country, 2021–2035 (USD Million) | |
  22. TABLE 8 Asia-Pacific Market Size, by Country, 2021–2035 (USD Million) | |
  23. TABLE 9 South America Market Size, by Country, 2021–2035 (USD Million) | |
  24. TABLE 10 Middle East & Africa Market Size, by Country, 2021–2035 (USD Million) | |
  25. TABLE 11 Global Market Size, by Component, 2021–2035 (USD Million) | |
  26. TABLE 12 Global Market Size, by Portability, 2021–2035 (USD Million) | |
  27. TABLE 13 Global Market Size, by End-User Industry, 2021–2035 (USD Million) | |
  28. TABLE 14 North America Market Size, by Component and End-User Industry, 2021–2035 (USD Million) | |
  29. TABLE 15 Europe Market Size, by Component and End-User Industry, 2021–2035 (USD Million) | |
  30. TABLE 16 Asia-Pacific Market Size, by Component and End-User Industry, 2021–2035 (USD Million) | |
  31. TABLE 17 Competitive Benchmarking Matrix, 2026 | |
  32. TABLE 18 Company Profiles – Key Players | |
  33. TABLE 19 Recent Developments & Strategic Announcements, 2023–2025 | |
  34. TABLE 20 Report Scope & Methodology Summary | |
  35. TABLE 21 Detailed Sources and Citations Index | | LIST OF FIGURES | |
  36. FIGURE 1 Market Dynamics Overview – Drivers, Restraints and Opportunities | |
  37. FIGURE 2 Industry Value Chain Analysis | |
  38. FIGURE 3 Porter's Five Forces Analysis | |
  39. FIGURE 4 Global Market Size Trend and Forecast, 2021–2035 (USD Million) | |
  40. FIGURE 5 Year-over-Year Growth Curve, 2022–2035 | |
  41. FIGURE 6 Market Share by Component, 2025 vs 2035 | |
  42. FIGURE 7 Market Share by Portability, 2025 vs 2035 | |
  43. FIGURE 8 Market Share by End-User Industry, 2025 | |
  44. FIGURE 9 Regional Share Distribution, 2025 | |
  45. FIGURE 10 Regional CAGR Comparison, 2026–2035 | |
  46. FIGURE 11 Country-Level Contribution within Asia-Pacific, 2025 | |
  47. FIGURE 12 Competitive Landscape – Estimated Revenue Share Bands, 2026 | |
  48. FIGURE 13 Vendor Positioning Matrix – Capability vs Geographic Reach

Segmentation Quick Reference

DimensionSub-SegmentsDominant SegmentFastest Growing Segment
By ComponentSensors; Amplifiers; Data Acquisition Units; Software; OthersSensors (38.9% share, 2025)Software (9.04% CAGR, 2026–2035)
By PortabilityPortable / Handheld; Stationary / Benchtop; Automated / Robotic Systems; OthersPortable / Handheld (41.9% share, 2025)Automated / Robotic Systems (12.2% CAGR, 2026–2035)
By End-User IndustryOil and Gas; Power Generation; Aerospace; Defense; Automotive and Transportation; Manufacturing and Heavy Engineering; Construction and Infrastructure; OthersOil and Gas (22.6% share, 2025)Automotive and Transportation (10.5% CAGR, 2026–2035)
By RegionNorth America; Europe; Asia-Pacific; South America; Middle East & AfricaAsia-Pacific (34.8% share, 2025)Asia-Pacific (7.1% CAGR, 2026–2035)


Market Segmentation Overview

By Component

Sub-SegmentKey Trend
SensorsPiezoelectric dominance with MEMS transducers entering low-cost distributed arrays
AmplifiersPreamplifier consolidation into integrated front ends reduces cabling overhead.
Data Acquisition UnitsChannel density rising as permanent installations replace campaign deployments.
SoftwareCloud classification, digital-twin APIs and subscription licensing drive revenue mix shift.
OthersCouplants, waveguides and calibration accessories tied to installed-base servicing


Sensors lead on revenue because every channel begins with a transducer and replacement cycles are predictable, yet unit pricing is eroding as Asian manufacturing scales. Software grows fastest at a 9.04% CAGR, and the reason is labour: classifier models absorb the interpretation work that previously consumed most of a project's certified-analyst hours. Data acquisition units sit between the two, gaining volume as channel counts rise on permanent installations but competing on price against integrated front ends that fold amplification into the chassis.

By Portability

Sub-SegmentKey Trend
Portable / HandheldStable replacement demand for spot checks on tanks and pressure vessels
Stationary / BenchtopPreferred for laboratory qualification and continuous petrochemical duty
Automated / Robotic SystemsCrawlers and rotorcraft platforms remove scaffolding and confined-space permits.
OthersWearable and specialty form factors for constrained access geometries


Portable and handheld units hold the largest installed position at 41.9% because turnaround schedules demand immediate answers at unpredictable locations, and no automated platform yet matches a technician with a probe for improvised access. Automated and robotic systems grow fastest at 12.2% CAGR by targeting the two line items plant managers complain about most — scaffold erection and confined-space permitting. Stationary benchtop racks keep their laboratory and fixed-plant niche on signal-to-noise grounds, where controlled mounting outperforms any field-deployed alternative.

By End-User Industry

Sub-SegmentKey Trend
Oil and GasRegulatory integrity programmes and high consequence-of-failure economics
Power GenerationNuclear licence extension and boiler surveillance under availability pressure
AerospaceComposite airframe and engine component certification testing
DefenseNaval hull, submarine pressure boundary and munitions casing qualification
Automotive and TransportationBattery pack signature monitoring and lightweight structure validation
Manufacturing and Heavy EngineeringRotating equipment and press frame condition monitoring
Construction and InfrastructureBridge, tunnel and stadium structural health surveillance
OthersSemiconductor packaging, pulp digesters and marine applications


Oil and gas retains leadership at 22.6% share because mandated integrity programmes and catastrophic failure costs make monitoring spend effectively non-discretionary at refineries and pipeline operators. Automotive and transportation advances fastest at 10.5% CAGR, driven by electric-vehicle pack testing where lithium plating produces detectable high-frequency signatures ahead of any thermal indication. Power generation holds a steady middle position through nuclear life-extension surveillance. At the same time, construction and infrastructure grow off a small base as transport agencies choose instrumented monitoring over closing fracture-critical spans.




Download PDF ×

We do not share your information with anyone. However, we may send you emails based on your report interest from time to time. You may contact us at any time to opt-out.