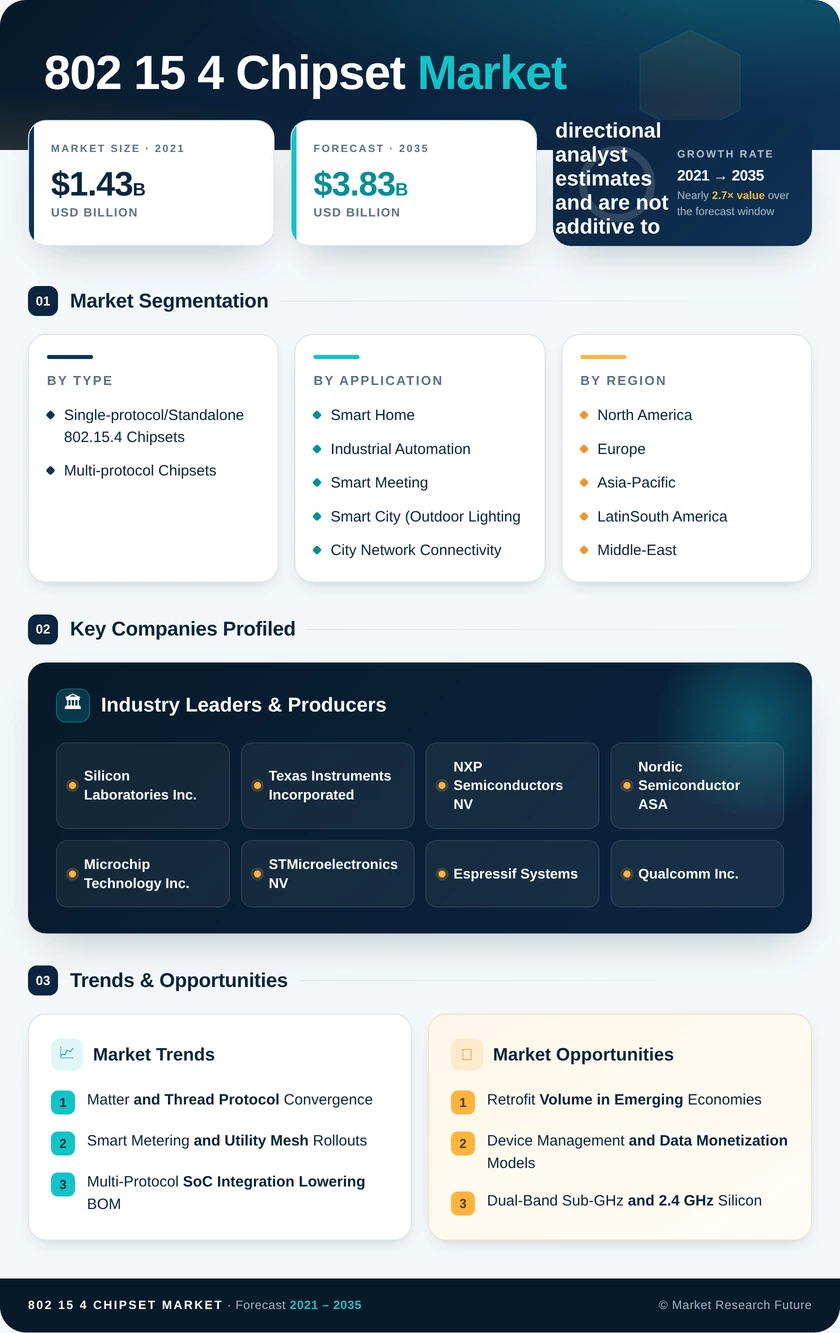
802 15 4 Chipset Market (2026 – 2035)

ID: MRFR/SEM/40994-HCR 200 Pages Nirmit Biswas Last Updated: November 09, 2026
802.15.4 Chipset Market Size, Share and Research Report By Application (Smart Home Devices, Industrial Automation, Healthcare Monitoring, Smart Agriculture, Wearable Technology), By End Use (Consumer Electronics, Healthcare, Industrial, Automotive), By Connectivity Type (Point-to-Point, Point-to-Multipoint, Mesh Networking), By Component Type (Transceivers, Microcontrollers, Software Protocols, Power Amplifiers) and By Regional (North America, Europe, South America, Asia Pacific, Middle East and Africa) - Industry Forecast Till 2035
802 15 4 Chipset Market
Market Size
Forecast Period2026-2035
CAGR (2026-2035)7.50%
2025 Market Size$1.86 Billion
2035 Market Size$3.83 Billion
Key Players
Silicon Laboratories Inc.
Texas Instruments Incorporated
NXP Semiconductors NV
Nordic Semiconductor ASA
Microchip Technology Inc.
STMicroelectronics NV
Opportunities
  • Retrofit Volume in Emerging Economies
  • Device Management and Data Monetization Models
  • Dual-Band Sub-GHz and 2.4 GHz Silicon
  1. 1 Market Summary | |
    1. 1.1 Study Assumptions & Market Definition | |
    2. 1.2 Scope of the Study | |
    3. 1.3 Research Methodology | |
  2. 2 Key Report Takeaways | |
    1. 2.1 By Type | |
    2. 2.2 By Application | |
    3. 2.3 By Region | |
  3. 3 Market Size and Forecast (2021–2035) | |
    1. 3.1 Historical Market Size (2021–2025) | |
    2. 3.2 Current & Forecast Market Size (2026–2035) | |
    3. 3.3 Market Size by Revenue (USD Billion) | |
    4. 3.4 Year-over-Year Growth Analysis | |
  4. 4 Driver Impact Analysis | |
    1. 4.1 Matter and Thread Protocol Convergence | |
    2. 4.2 Smart Metering and Utility Mesh Rollouts | |
    3. 4.3 Multi-Protocol SoC Integration Lowering BOM | |
    4. 4.4 Industrial Wireless Condition Monitoring | |
    5. 4.5 Municipal Outdoor Lighting Control Programmes | |
    6. 4.6 Energy-Harvesting and Battery-Free Endpoints | |
    7. 4.7 Commercial Building Energy Code Tightening | |
  5. 5 Restraints Impact Analysis | |
    1. 2.4 GHz Spectrum Congestion and Coexistence | |
    2. 5.2 Competition from Wi-Fi HaLow, BLE and LPWAN | |
    3. 5.3 Foundry Allocation Volatility for RF Nodes | |
    4. 5.4 Security Certification and Firmware Lifecycle Cost | |
    5. 5.5 Legacy Profile Fragmentation and Migration Friction | |
  6. 6 Opportunities | |
    1. 6.1 Retrofit Volume in Emerging Economies | |
    2. 6.2 Device Management and Data Monetization Models | |
    3. 6.3 Dual-Band Sub-GHz and
    4. 2.4 GHz Silicon | |
    5. 6.4 On-Die Machine Learning for Industrial Endpoints | |
    6. 6.5 Ambient and Battery-Free Sensing Categories | |
  7. 7 Regional Market Share and Country-Level Analysis | |
    1. 7.1 North America | | |
      1. 7.1.1 United States | | |
      2. 7.1.2 Canada | |
    2. 7.2 Europe | | |
      1. 7.2.1 Germany | | |
      2. 7.2.2 United Kingdom | | |
      3. 7.2.3 France | | |
      4. 7.2.4 Rest of Europe | |
    3. 7.3 Asia-Pacific | | |
      1. 7.3.1 India | | |
      2. 7.3.2 China | | |
      3. 7.3.3 Japan | | |
      4. 7.3.4 Rest of Asia-Pacific | |
    4. 7.4 South America | | |
      1. 7.4.1 Brazil | | |
      2. 7.4.2 Mexico | | |
      3. 7.4.3 Rest of South America | |
    5. 7.5 Middle East and Africa | | |
      1. 7.5.1 Saudi Arabia | | |
      2. 7.5.2 United Arab Emirates | | |
      3. 7.5.3 South Africa | | |
      4. 7.5.4 Rest of Middle East and Africa | |
  8. 8 Future Outlook (2026–2035) | |
    1. 8.1 Edge Intelligence Reshapes Node Economics | |
    2. 8.2 Certification Ecosystems Become the Competitive Moat | |
    3. 8.3 Grid Digitalization Sustains a Decade-Long Demand Floor | |
    4. 8.4 Sustainability Reporting Pulls Sensing Into Compliance Budgets | |
  9. 9 Segmentation Analysis | |
    1. 9.1 By Type | | |
      1. 9.1.1 Single-protocol/Standalone
      2. 802.15.4 Chipsets | | |
      3. 9.1.2 Multi-protocol Chipsets | |
    2. 9.2 By Application | | |
      1. 9.2.1 Smart Home | | |
      2. 9.2.2 Industrial Automation | | |
      3. 9.2.3 Smart Meeting | | |
      4. 9.2.4 Smart City (Outdoor Lighting, City Network Connectivity, etc.) | | |
      5. 9.2.5 Other Applications | |
  10. 10 Competitive Landscape | |
    1. 10.1 Market Share Analysis (2026) | |
    2. 10.2 Competitive Benchmarking Matrix | |
    3. 10.3 Company Profiles | | |
      1. 10.3.1 Silicon Laboratories Inc. | | |
      2. 10.3.2 Texas Instruments Incorporated | | |
      3. 10.3.3 NXP Semiconductors NV | | |
      4. 10.3.4 Nordic Semiconductor ASA | | |
      5. 10.3.5 Microchip Technology Inc. | | |
      6. 10.3.6 STMicroelectronics NV | | |
      7. 10.3.7 Espressif Systems | | |
      8. 10.3.8 Qualcomm Inc. | | |
      9. 10.3.9 Telink Semiconductor | | |
      10. 10.3.10 Renesas Electronics Corporation | | |
      11. 10.3.11 Infineon Technologies AG | | |
      12. 10.3.12 Analog Devices Inc. | |
  11. 11 Recent News and Developments | |
  12. 12 Report Scope and Methodology | |
    1. 12.1 Study Period & Base Year | |
    2. 12.2 Data Sources & Assumptions | |
    3. 12.3 Abbreviations | |
  13. 13 Detailed Sources and Citations | |
  14. 14 Frequently Asked Questions (FAQs) | | LIST OF TABLES | |
  15. TABLE 1 Global
  16. 802.15.4 Chipset Market Size & Forecast, by Revenue (USD Billion), 2021–2035 | |
  17. TABLE 2 Global
  18. 802.15.4 Chipset Market – Year-over-Year Growth Analysis, 2021–2035 | |
  19. TABLE 3 Driver Impact Analysis – Estimated Contribution to Growth Momentum, 2026–2035 | |
  20. TABLE 4 Restraint Impact Analysis – Estimated Drag on Growth Momentum, 2026–2035 | |
  21. TABLE 5 Global
  22. 802.15.4 Chipset Market Size, by Region, 2021–2035 (USD Billion) | |
  23. TABLE 6 Regional Summary – Share, Investment Themes and Growth Profile, 2025 | |
  24. TABLE 7 North America
  25. 802.15.4 Chipset Market Size, by Country, 2021–2035 (USD Billion) | |
  26. TABLE 8 Europe
  27. 802.15.4 Chipset Market Size, by Country, 2021–2035 (USD Billion) | |
  28. TABLE 9 Asia-Pacific
  29. 802.15.4 Chipset Market Size, by Country, 2021–2035 (USD Billion) | |
  30. TABLE 10 South America
  31. 802.15.4 Chipset Market Size, by Country, 2021–2035 (USD Billion) | |
  32. TABLE 11 Middle East and Africa
  33. 802.15.4 Chipset Market Size, by Country, 2021–2035 (USD Billion) | |
  34. TABLE 12 Global
  35. 802.15.4 Chipset Market Size, by Type, 2021–2035 (USD Billion) | |
  36. TABLE 13 Global
  37. 802.15.4 Chipset Market Size, by Application, 2021–2035 (USD Billion) | |
  38. TABLE 14 North America
  39. 802.15.4 Chipset Market Size, by Type, 2021–2035 (USD Billion) | |
  40. TABLE 15 North America
  41. 802.15.4 Chipset Market Size, by Application, 2021–2035 (USD Billion) | |
  42. TABLE 16 Europe
  43. 802.15.4 Chipset Market Size, by Type, 2021–2035 (USD Billion) | |
  44. TABLE 17 Europe
  45. 802.15.4 Chipset Market Size, by Application, 2021–2035 (USD Billion) | |
  46. TABLE 18 Asia-Pacific
  47. 802.15.4 Chipset Market Size, by Type, 2021–2035 (USD Billion) | |
  48. TABLE 19 Asia-Pacific
  49. 802.15.4 Chipset Market Size, by Application, 2021–2035 (USD Billion) | |
  50. TABLE 20 South America
  51. 802.15.4 Chipset Market Size, by Type, 2021–2035 (USD Billion) | |
  52. TABLE 21 South America
  53. 802.15.4 Chipset Market Size, by Application, 2021–2035 (USD Billion) | |
  54. TABLE 22 Middle East and Africa
  55. 802.15.4 Chipset Market Size, by Type, 2021–2035 (USD Billion) | |
  56. TABLE 23 Middle East and Africa
  57. 802.15.4 Chipset Market Size, by Application, 2021–2035 (USD Billion) | |
  58. TABLE 24 Competitive Benchmarking Matrix – Global
  59. 802.15.4 Chipset Market, 2026 | |
  60. TABLE 25 Company Profiles – Key Players, Global
  61. 802.15.4 Chipset Market | |
  62. TABLE 26 Recent Developments & Strategic Announcements, 2023–2025 | |
  63. TABLE 27 Report Scope & Methodology Summary | |
  64. TABLE 28 Detailed Sources and Citations Index | | LIST OF FIGURES | |
  65. FIGURE 1 Market Dynamics Overview – Drivers, Restraints and Opportunities | |
  66. FIGURE 2 Industry Value Chain Analysis – Wafer to Certified Endpoint | |
  67. FIGURE 3 Porter's Five Forces Analysis –
  68. 802.15.4 Chipset Industry | |
  69. FIGURE 4 Global Market Size Trend and Forecast, 2021–2035 (USD Billion) | |
  70. FIGURE 5 Year-over-Year Growth Rate Trend, 2022–2035 (%) | |
  71. FIGURE 6 Market Share by Type, 2025 vs 2035 (%) | |
  72. FIGURE 7 Market Share by Application, 2025 (%) | |
  73. FIGURE 8 Application Segment CAGR Comparison, 2026–2035 (%) | |
  74. FIGURE 9 Regional Market Share Distribution, 2025 (%) | |
  75. FIGURE 10 Regional CAGR Comparison, 2026–2035 (%) | |
  76. FIGURE 11 Country-Level Share within Asia-Pacific, 2025 (%) | |
  77. FIGURE 12 Country-Level Share within Europe, 2025 (%) | |
  78. FIGURE 13 Competitive Landscape – Estimated Revenue Share Bands, 2026 | |
  79. FIGURE 14 Competitive Positioning Matrix – Stack Depth vs Price Position | |
  80. FIGURE 15 Certification and Compliance Cost Trend, 2023–2030

Segmentation Quick Reference

DimensionSub-SegmentsDominant SegmentFastest Growing Segment
By TypeSingle-protocol/Standalone 802.15.4 Chipsets; Multi-protocol ChipsetsSingle-protocol/Standalone 802.15.4 Chipsets (54.8% share)Multi-protocol Chipsets (9.4% CAGR)
By ApplicationSmart Home; Industrial Automation; Smart Meeting; Smart City (Outdoor Lighting, City Network Connectivity, etc.); Other ApplicationsSmart Home (38.2% share)Smart City (Outdoor Lighting, City Network Connectivity, etc.) (9.6% CAGR)
By RegionNorth America; Europe; Asia-Pacific; South America; Middle-East and AfricaAsia-Pacific (38.6%)Asia-Pacific (38.6%)


Market Segmentation Overview

By Type

Sub-SegmentKey Trend
Single-protocol/Standalone 802.15.4 ChipsetsPrice compression toward sub-USD-1.00 unit costs at metering volumes
Multi-protocol ChipsetsBluetooth Low Energy commissioning requirement drives mandatory dual-radio adoption


Single-protocol/Standalone 802.15.4 Chipsets lead this dimension because metering, switch, and sensor designs derive no benefit from a second radio and compete almost entirely on unit cost. Multi-protocol Chipsets grow faster, at a 9.4% CAGR, because Matter certification requires Bluetooth Low Energy for device commissioning, which makes dual-radio silicon a compliance requirement rather than a feature choice for consumer OEMs. Buyers in industrial and utility channels continue to specify standalone parts where certified interoperability is unnecessary and ten-year supply commitments matter more than protocol breadth.

By Application

Sub-SegmentKey Trend
Smart HomeMatter-certified lighting, locks and climate devices sustain highest unit volume
Industrial AutomationCondition monitoring retrofits deliver highest revenue per node
Smart MeetingOccupancy sensing and room booking panels tied to hybrid-work estate planning
Smart City (Outdoor Lighting, City Network Connectivity, etc.)Municipal luminaire controller replacement cycles reaching scale
Other ApplicationsAgriculture, healthcare telemetry and logistics asset tracking


Smart Home holds 38.2% of application revenue and sets the mainstream silicon roadmap, since its price sensitivity and unit volume dictate what vendors optimize for. Smart City (Outdoor Lighting, City Network Connectivity, etc.) grows fastest at a 9.6% CAGR because European and North American municipalities are converting arterial roads to networked control in hundred-pole batches, and mesh hop counts eliminate per-node backhaul cost. Industrial Automation, at USD 0.46 billion in 2025, monetizes differently: fewer nodes, higher-specification parts, and industrial temperature ratings that command premium pricing over consumer-grade equivalents.




Download PDF ×

We do not share your information with anyone. However, we may send you emails based on your report interest from time to time. You may contact us at any time to opt-out.