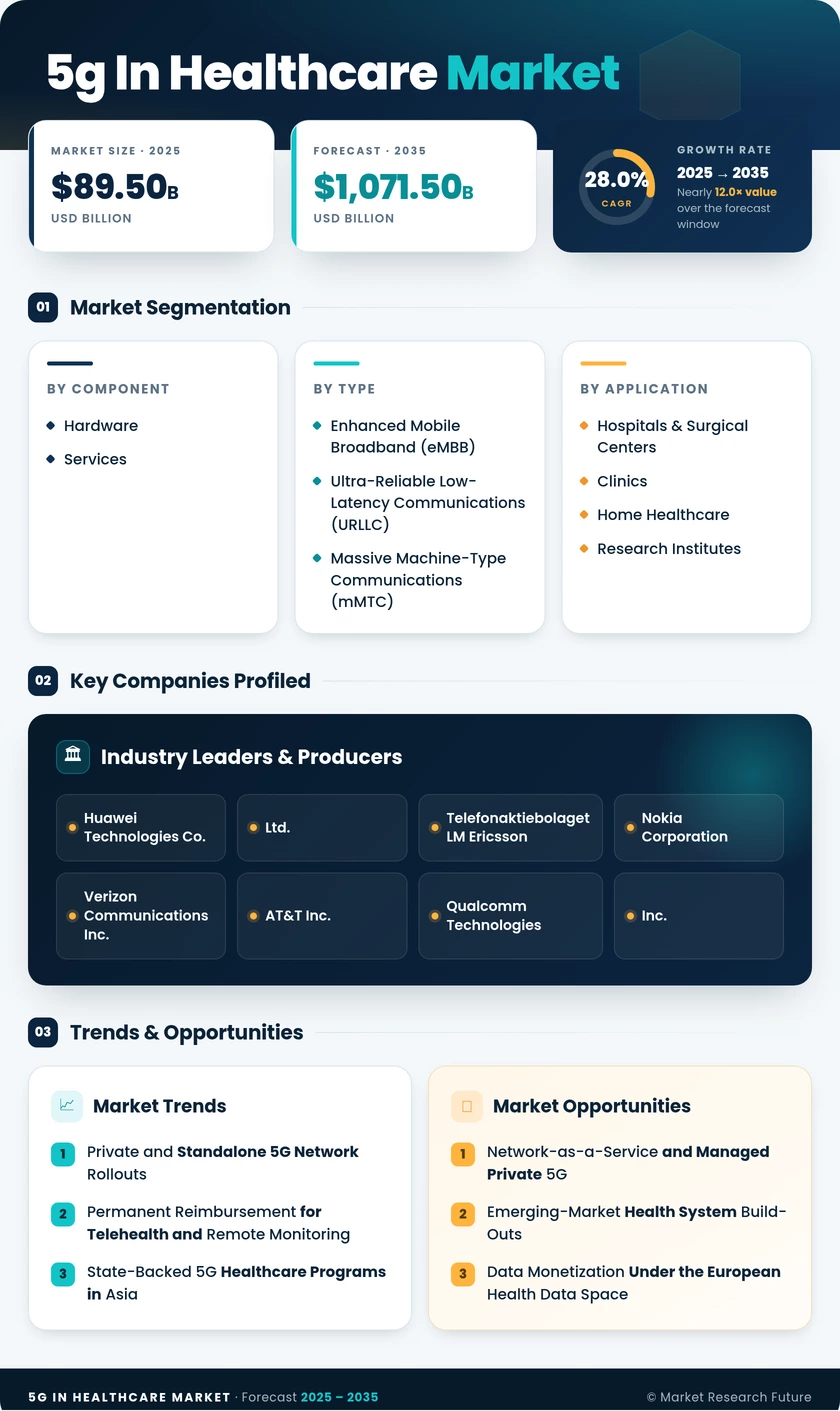
5G in Healthcare Market (2026 - 2035)

ID: MRFR/HC/9232-HCR 200 Pages Rahul Gotadki Last Updated: September 23, 2026
5G in Healthcare Market Size, Growth Research Report By Application (Telemedicine, Remote Patient Monitoring, Robotic Surgery, Augmented Reality, Health Analytics), By End Use (Hospitals, Clinics, Homecare, Emergency Medical Services, Pharmaceuticals), By Connectivity Type (Enhanced Mobile Broadband, Ultra-Reliable Low Latency Communications, Massive Machine Type Communications), By Component (Hardware, Software, Services) andBy Regional (North America, Europe, South America, Asia Pacific, Middle East and Africa) - Competitor Industry Analysis and Trends Forecast Till 2035
5G in Healthcare Market
Market Size
Forecast Period2026-2035
CAGR (2026-2035)28.0%
2025 Market SizeUSD 89.5 Billion
2035 Market SizeUSD 1,071.5 Billion
Key Players
Huawei Technologies Co., Ltd.
Telefonaktiebolaget LM Ericsson
Nokia Corporation
Verizon Communications Inc.
AT&T Inc.
Qualcomm Technologies, Inc.
Opportunities
  • Network-as-a-Service and Managed Private 5G
  • Emerging-Market Health System Build-Outs
  • Data Monetization Under the European Health Data Space
  1. 1 Market Summary | |
  2. 2 Key Report Takeaways | |
    1. 2.1 By Component (Value) | |
    2. 2.2 By Communication Type (Value) | |
    3. 2.3 By Application (Value) | |
    4. 2.4 By End User (Value) | |
    5. 2.5 By Region | |
  3. 3 Market Size and Forecast (2021–2035) | |
    1. 3.1 Research Methodology and Data Sourcing | |
    2. 3.2 Historical Market Size (2021–2025) | |
    3. 3.3 Forecast Market Size (2026–2035) | |
    4. 3.4 Year-over-Year Growth Analysis | |
  4. 4 Driver Impact Analysis | |
    1. 4.1 Private and Standalone 5G Network Rollouts | |
    2. 4.2 Permanent Reimbursement for Telehealth and Remote Monitoring | |
    3. 4.3 State-Backed 5G Healthcare Programs in Asia | |
    4. 4.4 Chronic Disease Burden and Hospital-at-Home Models | |
    5. 4.5 Edge AI Imaging and High-Resolution Diagnostics | |
    6. 4.6 Public Broadband and Digital Infrastructure Funding | |
  5. 5 Restraints Impact Analysis | |
    1. 5.1 Cybersecurity Risk and Compliance Costs | |
    2. 5.2 High Upfront Capital Requirements | |
    3. 5.3 Spectrum Access and Fragmented Licensing | |
    4. 5.4 Legacy Medical Device Interoperability | |
    5. 5.5 Rural and Low-Income Coverage Gaps | |
  6. 6 Opportunities | |
    1. 6.1 Network-as-a-Service and Managed Private 5G | |
    2. 6.2 Emerging-Market Health System Build-Outs | |
    3. 6.3 Data Monetization Under the European Health Data Space | |
    4. 6.4 Connected Ambulance and Emergency Care Networks | |
    5. 6.5 Smart Wearables and Hospital-at-Home Platforms | |
  7. 7 Regional Market Share and Country-Level Analysis | |
    1. 7.1 North America | | |
      1. 7.1.1 United States | | |
      2. 7.1.2 Canada | | |
      3. 7.1.3 Mexico | |
    2. 7.2 Europe | | |
      1. 7.2.1 Germany | | |
      2. 7.2.2 UK | | |
      3. 7.2.3 France | | |
      4. 7.2.4 Italy | | |
      5. 7.2.5 Spain | | |
      6. 7.2.6 Nordic Countries | | |
      7. 7.2.7 Russia | | |
      8. 7.2.8 Rest of Europe | |
    3. 7.3 Asia-Pacific | | |
      1. 7.3.1 China | | |
      2. 7.3.2 India | | |
      3. 7.3.3 Japan | | |
      4. 7.3.4 South Korea | | |
      5. 7.3.5 ASEAN | | |
      6. 7.3.6 Rest of Asia-Pacific | |
    4. 7.4 South America | | |
      1. 7.4.1 Brazil | | |
      2. 7.4.2 Argentina | | |
      3. 7.4.3 Rest of South America | |
    5. 7.5 Middle East & Africa | | |
      1. 7.5.1 Saudi Arabia | | |
      2. 7.5.2 UAE | | |
      3. 7.5.3 South Africa | | |
      4. 7.5.4 Egypt | | |
      5. 7.5.5 Rest of MEA | |
  8. 8 Future Outlook (2026–2035) | |
    1. 8.1 AI at the Network Edge and Autonomous Operations | |
    2. 8.2 Platform Economics and Network Slicing as a Product | |
    3. 8.3 5G-Advanced and the Path to 6G | |
    4. 8.4 Sustainability and Energy-Efficient Networks | |
  9. 9 Segmentation Analysis | |
    1. 9.1 By Component (Value) | | |
      1. 9.1.1 Hardware | | |
      2. 9.1.2 Services | |
    2. 9.2 By Communication Type (Value) | | |
      1. 9.2.1 Enhanced Mobile Broadband (eMBB) | | |
      2. 9.2.2 Ultra-Reliable Low-Latency Communications (URLLC) | | |
      3. 9.2.3 Massive Machine-Type Communications (mMTC) | |
    3. 9.3 By Application (Value) | | |
      1. 9.3.1 Telemedicine & Virtual Consultation | | |
      2. 9.3.2 Remote Patient Monitoring (RPM) | | |
      3. 9.3.3 AR/VR Therapy | | |
      4. 9.3.4 Connected Ambulance | | |
      5. 9.3.5 Smart Wearables | | |
      6. 9.3.6 Robotic Surgery | |
    4. 9.4 By End User (Value) | | |
      1. 9.4.1 Hospitals & Surgical Centers | | |
      2. 9.4.2 Clinics | | |
      3. 9.4.3 Home Healthcare | | |
      4. 9.4.4 Research Institutes | |
  10. 10 Competitive Landscape | |
    1. 10.1 Market Concentration Analysis | |
    2. 10.2 Competitive Benchmarking Matrix | |
    3. 10.3 Company Profiles | | |
      1. 10.3.1 Huawei Technologies Co., Ltd. | | |
      2. 10.3.2 Telefonaktiebolaget LM Ericsson | | |
      3. 10.3.3 Nokia Corporation | | |
      4. 10.3.4 Verizon Communications Inc. | | |
      5. 10.3.5 AT&T Inc. | | |
      6. 10.3.6 Qualcomm Technologies, Inc. | | |
      7. 10.3.7 Cisco Systems, Inc. | | |
      8. 10.3.8 Samsung Electronics Co., Ltd. | | |
      9. 10.3.9 ZTE Corporation | | |
      10. 10.3.10 China Mobile Limited | |
  11. 11 Recent News & Developments | |
  12. 12 Report Scope and Methodology | |
  13. 13 Detailed Sources and Citations | |
  14. 14 Frequently Asked Questions (FAQs) | | LIST OF TABLES | |
  15. TABLE 1 Report Snapshot – Key Market Metrics | |
  16. TABLE 2 Global Market Size and Forecast, 2021–2035 (USD Billion) | |
  17. TABLE 3 Driver Impact Analysis | |
  18. TABLE 4 Restraints Impact Analysis | |
  19. TABLE 5 Regional Summary, 2025 | |
  20. TABLE 6 North America – Country-Level Analysis | |
  21. TABLE 7 Europe – Country-Level Analysis | |
  22. TABLE 8 Asia-Pacific – Country-Level Analysis | |
  23. TABLE 9 South America – Country-Level Analysis | |
  24. TABLE 10 Middle East & Africa – Country-Level Analysis | |
  25. TABLE 11 Market Segmentation, By Component (Value) | |
  26. TABLE 12 Market Segmentation, By Communication Type (Value) | |
  27. TABLE 13 Market Segmentation, By Application (Value) | |
  28. TABLE 14 Market Segmentation, By End User (Value) | |
  29. TABLE 15 Competitive Benchmarking Matrix | |
  30. TABLE 16 Report Scope and Methodology | |
  31. TABLE 17 Detailed Sources and Citations | |
  32. TABLE 18 Segmentation Quick Reference | | LIST OF FIGURES | |
  33. FIGURE 1 Market Dynamics Overview – Drivers, Restraints, and Opportunities | |
  34. FIGURE 2 Value Chain Analysis | |
  35. FIGURE 3 Porter's Five Forces Analysis | |
  36. FIGURE 4 Global Market Size Trend, 2021–2035 (USD Billion) | |
  37. FIGURE 5 Year-over-Year Growth Rate, 2021–2035 | |
  38. FIGURE 6 Market Share, By Component (Value), 2025 | |
  39. FIGURE 7 Market Share, By Communication Type (Value), 2025 | |
  40. FIGURE 8 Market Share, By Application (Value), 2025 | |
  41. FIGURE 9 Market Share, By End User (Value), 2025 | |
  42. FIGURE 10 Regional Market Share, 2025 | |
  43. FIGURE 11 Regional Growth Comparison, 2026–2035 | |
  44. FIGURE 12 Competitive Landscape – Revenue Share Ranges of Key Players | |
  45. FIGURE 13 Recent Developments Timeline, 2023–2025

Segmentation Quick Reference

DimensionSub-SegmentsDominant SegmentFastest Growing Segment
By Component (Value)Hardware; ServicesHardware (53.1% share)Services (30.2% CAGR)
By Communication Type (Value)Enhanced Mobile Broadband (eMBB); Ultra-Reliable Low-Latency Communications (URLLC); Massive Machine-Type Communications (mMTC)Enhanced Mobile Broadband (eMBB) (48.9% share)Ultra-Reliable Low-Latency Communications (URLLC) (30.3% CAGR)
By Application (Value)Telemedicine & Virtual Consultation; Remote Patient Monitoring (RPM); AR/VR Therapy; Connected Ambulance; Smart Wearables; Robotic SurgeryTelemedicine & Virtual Consultation (32.0% share)Robotic Surgery (30.8% CAGR)
By End User (Value)Hospitals & Surgical Centers; Clinics; Home Healthcare; Research InstitutesHospitals & Surgical Centers (48.6% share)Home Healthcare (31.4% CAGR)
By RegionNorth America; Europe; Asia-Pacific; South America; Middle East & AfricaNorth America (38.4% share)Asia-Pacific (31.2% CAGR)


Market Segmentation Overview

By Component (Value)

Sub-SegmentKey Trend
HardwareShift from macro radios toward small cells, indoor antennas, and on-premises edge servers in clinical zones.
ServicesManaged private 5G subscriptions bundling spectrum, security monitoring, and compliance reporting


Hardware leads the component mix because radios, small cells, and edge servers must be installed before clinical services start, and surgical and imaging areas need dense indoor coverage. Services grow fastest as hospitals choose subscriptions that fold integration, monitoring, and lifecycle support into one operating fee. That shift moves vendor value from equipment shipments toward long-term managed contracts.

By Communication Type (Value)

Sub-SegmentKey Trend
Enhanced Mobile Broadband (eMBB)Migration to 8K imaging and volumetric video for remote training
Ultra-Reliable Low-Latency Communications (URLLC)Robotic procedures and multi-site stroke networks needing sub-10 ms latency
Massive Machine-Type Communications (mMTC)Low-power sensors and RedCap wearables deployed at scale


Enhanced Mobile Broadband (eMBB) leads because radiology and video consultation generate the largest daily data volumes on hospital networks. Ultra-Reliable Low-Latency Communications (URLLC) grows fastest as surgical robotics and time-critical interventions require guaranteed latency and jitter that only dedicated slices provide. Massive Machine-Type Communications (mMTC) supports the sensor density that continuous monitoring requires.

By Application (Value)

Sub-SegmentKey Trend
Telemedicine & Virtual ConsultationPermanent reimbursement and hybrid in-person/virtual care pathways
Remote Patient Monitoring (RPM)Billable chronic-care programs using continuous vitals
AR/VR TherapyImmersive rehabilitation and surgical simulation
Connected AmbulancePre-hospital video triage for stroke and trauma
Smart WearablesMedical-grade devices streaming ECG, glucose, and oxygen data
Robotic SurgeryLong-distance and multi-site procedures over low-latency links


Telemedicine & Virtual Consultation leads because reimbursement codes have made virtual visits a routine, billable part of care. Robotic Surgery grows fastest as low-latency 5G links demonstrate that surgeons can operate reliably over distance, drawing investment from academic medical centers. Remote Patient Monitoring (RPM) and Smart Wearables form the data layer that ties these applications together.

By End User (Value)

Sub-SegmentKey Trend
Hospitals & Surgical CentersPrivate cores and edge clusters for critical-care workloads
ClinicsOperator-managed connectivity for teleconsultation and imaging uploads
Home HealthcarePayer-backed hospital-at-home and remote monitoring programs
Research Institutes5G testbeds for AR-assisted training and connected laboratories


Hospitals & Surgical Centers lead because intensive-care units and operating rooms cannot tolerate connectivity failure, which justifies investment in private networks. Home Healthcare grows fastest as insurers and hospital-at-home programs move monitoring and acute care into patients' residences. Clinics and Research Institutes adopt lighter, operator-managed services suited to smaller sites and experimental workloads.




Download PDF ×

We do not share your information with anyone. However, we may send you emails based on your report interest from time to time. You may contact us at any time to opt-out.