ID: MRFR/SEM/3587-HCR | February 2021 | Region: Global | 100 pages
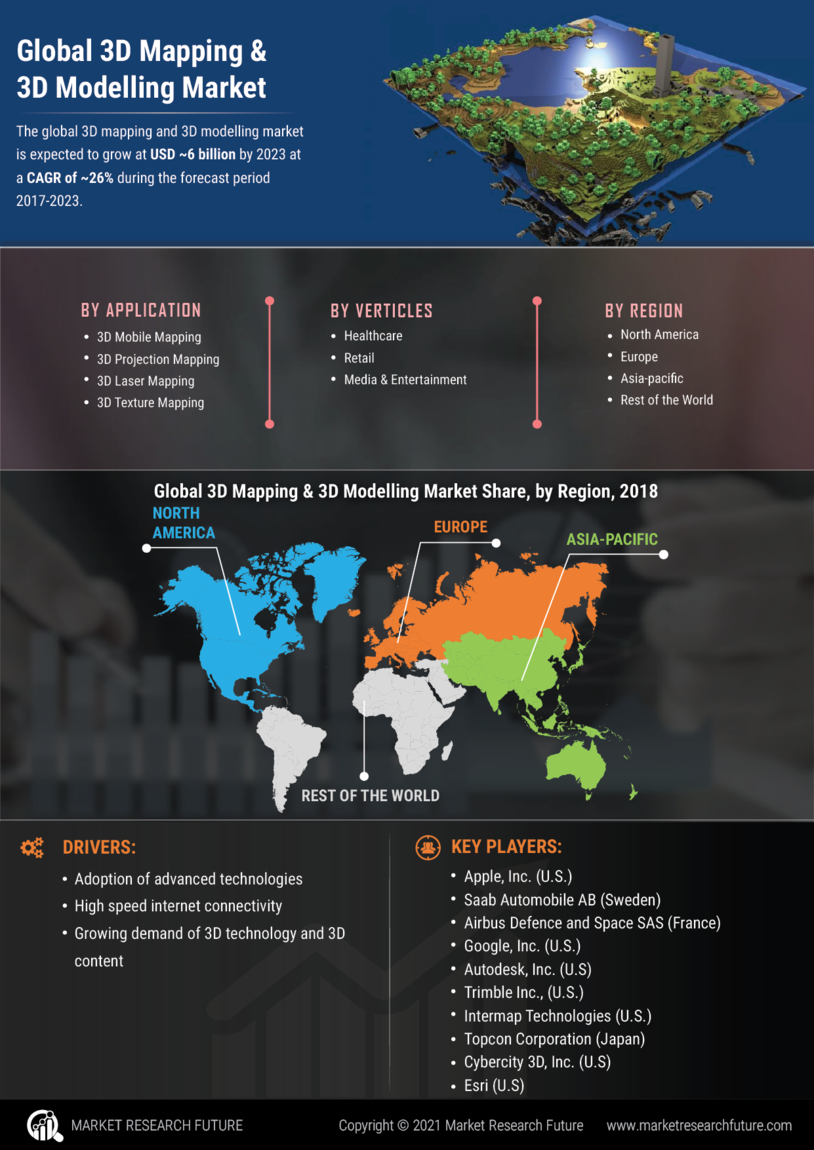
Companies such Apple, Inc. (U.S.), Saab Automobile AB (Sweden), Google, Inc. (U.S.), Autodesk, Inc. (U.S), Trimble, Inc. (U.S.), Intermap Technologies (U.S.), Topcon Corporation (Japan), are the leading providers of 3D mapping and 3D modelling solution in the global market. With the emergence of 3D technologies including 3D sensors, scanners and other devices which is propelling the growth of 3D mapping and 3D modelling market to the large extent. These components are widely used in electronics devices as well as in various sectors such as automotive, healthcare, media and entertainment and others.
The adoption of advanced technologies and high speed internet connectivity which is driving the growth of 3D mapping and 3D modelling market. On December 9, 2016, Mitsubishi Motors Corporation announced its advanced mobile 3D mapping system to synchronize 3D maps for driverless cars. These 3D maps are available with laser scanners, cameras, GPS tracking and sensors.
The global 3D mapping and 3D modelling market is segmented into application, verticals, and region. The application is 3D mobile mapping, 3D projection mapping, 3D laser mapping, mapping and navigation, 3D texture mapping, 3D video mapping, and others. The verticals segment is segmented into defense and public safety, automotive, transport and logistics, healthcare, construction, aviation and space, retail, media and entertainment, and others. The market is spanned across regions including North America, Europe, Asia Pacific, and rest of the world.
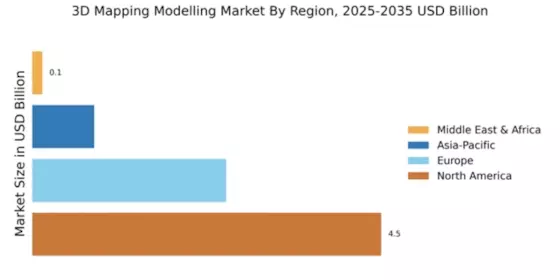
The regional analysis of 3D mapping and 3D modelling market is studied for regions such as Asia Pacific (China, Japan, and India), North America (the U.S., Mexico, and Canada), Europe (the U.K, Germany) and Rest of the World. North America is one of the leading regions of the world in terms of market share. The 3D mapping and 3D modelling market in this region has a huge demand due to smart device activities which is propelling the market of 3D mapping and 3D modelling. The 3D mapping and 3D modelling market in Europe is expected to witness rapid growth in the forthcoming period. Whereas, Asia Pacific countries such as China, Japan, and India is an emerging 3D mapping and 3D modelling market, which is expected to grow at the highest CAGR in the coming years.
The global 3D mapping and 3D modelling market is expected to grow at USD ~6 billion by 2023 at a CAGR of ~26% during the forecast period 2017-2023.
Global 3D Mapping & 3D Modelling Market
Key Players
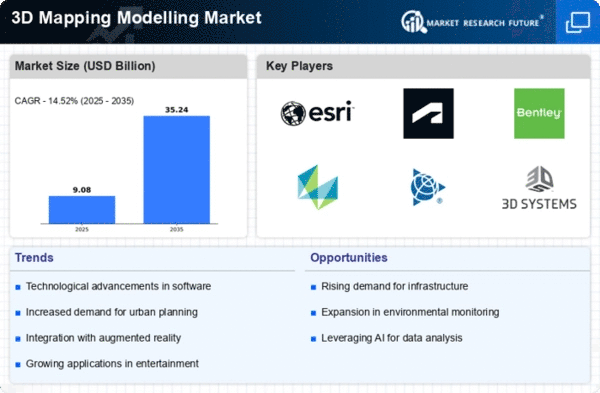
Some of the prominent players in the global 3D mapping and 3D modelling market Apple, Inc. (U.S.), Saab Automobile AB (Sweden), Airbus Defence and Space SAS (France), Google, Inc. (U.S.), Autodesk, Inc. (U.S) Trimble Inc., (U.S.), Intermap Technologies (U.S.), Topcon Corporation (Japan), Cybercity 3D, Inc. (U.S), Esri (U.S), Applied EarthWorks, Inc. (U.S.), Aerolion (U.S.), Mitsubishi Motors Corporation (Japan), Udemy Inc. (U.S.), the Blender Foundation (the Netherlands), Pixologic, Inc. (U.S.), among others.
Intended Audience
Frequently Asked Questions (FAQ) :
Global 3D mapping and 3D modelling market is projected to grow at approximately 26% CAGR during the assessment period (2017 -2023).
The valuation of the global 3D mapping and 3D modelling market is estimated to increase to approximately USD 6 BN by the end of 2023.
The adoption of advanced technologies and high speed internet connectivity, are major tailwinds pushing the growth of the global 3D mapping and 3D modelling market.
Saab Automobile AB (Sweden), Apple, Inc. (U.S.), Airbus Defence and Space SAS (France), Autodesk, Inc. (U.S), Google, Inc. (U.S.), Trimble Inc., (U.S.), Topcon Corporation (Japan), Intermap Technologies (U.S.), Cybercity 3D, Inc. (U.S), Applied EarthWorks, Inc. (U.S.), Esri (U.S), Aerolion (U.S.), Udemy Inc. (U.S.), Mitsubishi Motors Corporation (Japan), the Blender Foundation (the Netherlands), and Pixologic, Inc. (U.S.), are some of the top players operating in the global 3D mapping and 3D modelling market.
North America is expected to hold the highest market share in the global 3D mapping and 3D modelling market.
TABLE OF CONTENTS
1 Executive Summary
2 Scope of the Report
2.1 Market Definition
2.2 Scope of the Study
2.2.1 Research Objectives
2.2.2 Assumptions & Limitations
2.3 Markets Structure
3 Market Research Methodology
3.1 Research Process
3.2 Secondary Research
3.3 Primary Research
3.4 Forecast Model
4 Market Landscape
4.1 Porter’s Five Forces Analysis
4.1.1 Threat of New Entrants
4.1.2 Bargaining power of buyers
4.1.3 Threat of substitutes
4.1.4 Segment rivalry
4.2 Value Chain/Supply Chain of Global 3D mapping and 3D modelling Market
5 Industry Overview of Global 3D Mapping & 3D Modelling Market
5.1 Introduction
5.2 Growth Drivers
5.3 Impact analysis
5.4 Market Challenges
6 Market Trends
6.1 Introduction
6.2 Growth Trends
6.3 Impact analysis
7. Global 3D mapping and 3D modelling Market by Application
7.1 Introduction
7.2 3D Mobile Mapping
7.2.1 Market Estimates & Forecast, 2017-2023
7.2.2 Market Estimates & Forecast by Region, 2017-2023
7.3 3D Projection Mapping
7.3.1 Market Estimates & Forecast, 2017-2023
7.3.2 Market Estimates & Forecast by Region, 2017-2023
7.4 3D Laser Mapping
7.4.1 Market Estimates & Forecast, 2017-2023
7.4.2 Market Estimates & Forecast by Region, 2017-2023
7.5 Mapping and Navigation
7.5.1 Market Estimates & Forecast, 2017-2023
7.5.2 Market Estimates & Forecast by Region, 2017-2023
7.6 3D Texture Mapping
7.6.1 Market Estimates & Forecast, 2017-2023
7.6.2 Market Estimates & Forecast by Region, 2017-2023
7.7 3D Video Mapping
7.7.1 Market Estimates & Forecast, 2017-2023
7.7.2 Market Estimates & Forecast by Region, 2017-2023
7.8 Others
7.8.1 Market Estimates & Forecast, 2017-2023
7.8.2 Market Estimates & Forecast by Region, 2017-2023
8. Global 3D mapping and 3D modelling Market by Verticals
8.1 Introduction
8.2 Automotive
8.2.1 Market Estimates & Forecast, 2017-2023
8.2.2 Market Estimates & Forecast by Region, 2017-2023
8.3 Transportation
8.3.1 Market Estimates & Forecast, 2017-2023
8.3.2 Market Estimates & Forecast by Region, 2017-2023
8.4 Healthcare
8.4.1 Market Estimates & Forecast, 2017-2023
8.4.2 Market Estimates & Forecast by Region, 2017-2023
8.5 Construction
8.5.1 Market Estimates & Forecast, 2017-2023
8.5.2 Market Estimates & Forecast by Region, 2017-2023
8.6 Aviation and Space
8.6.1 Market Estimates & Forecast, 2017-2023
8.6.2 Market Estimates & Forecast by Region, 2017-2023
8.7 Retail
8.7.1 Market Estimates & Forecast, 2017-2023
8.7.2 Market Estimates & Forecast by Region, 2017-2023
8.8 Media and Entertainment
8.8.1 Market Estimates & Forecast, 2017-2023
8.8.2 Market Estimates & Forecast by Region, 2017-2023
8.9 Others
8.9.1 Market Estimates & Forecast, 2017-2023
8.9.2 Market Estimates & Forecast wby Region, 2017-2023
9. Global 3D mapping and 3D modelling Market by Region
9.1 Introduction
9.2 North America
9.2.1 Market Estimates & Forecast, 2017-2023
9.2.2 Market Estimates & Forecast by Application, 2017-2023
9.2.3 Market Estimates & Forecast by Verticals, 2017-2023
9.2.4 Market Estimates & Forecast by Verticals, 2017-2023
9.2.5 U.S.A
9.2.5.1 Market Estimates & Forecast, 2017-2023
9.2.5.2 Market Estimates & Forecast by Application, 2017-2023
9.2.5.3 Market Estimates & Forecast by Verticals, 2017-2023
9.2.5.4 Market Estimates & Forecast by Applications, 2017-2023
9.2.6 Mexico
9.2.6.1 Market Estimates & Forecast, 2017-2023
9.2.6.2 Market Estimates & Forecast by Application, 2017-2023
9.2.6.3 Market Estimates & Forecast by Verticals, 2017-2023
9.2.6.4 Market Estimates & Forecast by Applications, 2017-2023
9.2.7 Canada
9.2.7.1 Market Estimates & Forecast, 2017-2023
9.2.7.2 Market Estimates & Forecast by Application, 2017-2023
9.2.7.3 Market Estimates & Forecast by Verticals, 2017-2023
9.2.7.4 Market Estimates & Forecast by Applications, 2017-2023
9.3 Europe
9.3.1 Market Estimates & Forecast, 2017-2023
9.3.2 Market Estimates & Forecast by Application, 2017-2023
9.3.3 Market Estimates & Forecast by Verticals, 2017-2023
9.3.4 Market Estimates & Forecast by Applications, 2017-2023
9.3.5 Germany
9.3.5.1 Market Estimates & Forecast, 2017-2023
9.3.5.2 Market Estimates & Forecast by Application, 2017-2023
9.3.5.3 Market Estimates & Forecast by Verticals, 2017-2023
9.3.5.4 Market Estimates & Forecast by Applications, 2017-2023
9.3.6. France
9.3.6.1 Market Estimates & Forecast, 2017-2023
9.3.6.2 Market Estimates & Forecast by Application, 2017-2023
9.3.6.3 Market Estimates & Forecast by Verticals, 2017-2023
9.2.6.4 Market Estimates & Forecast by Applications, 2017-2023
9.3.7 Italy
9.3.7.1 Market Estimates & Forecast, 2017-2023
9.3.7.2 Market Estimates & Forecast by Application, 2017-2023
9.3.7.3 Market Estimates & Forecast by Verticals, 2017-2023
9.3.7.4 Market Estimates & Forecast by Applications, 2017-2023
9.3.8 Spain
9.3. 8.1 Market Estimates & Forecast, 2017-2023
9.3. 8.2 Market Estimates & Forecast by Application, 2017-2023
9.3. 8.3 Market Estimates & Forecast by Verticals, 2017-2023
9.3. 8.4 Market Estimates & Forecast by Applications, 2017-2023
9.3.9 U.K
9.3.9.1 Market Estimates & Forecast, 2017-2023
9.3.9.2 Market Estimates & Forecast by Application, 2017-2023
9.3.9.3 Market Estimates & Forecast by Verticals, 2017-2023
9.3.9.4 Market Estimates & Forecast by Applications, 2017-2023
9.4 Asia Pacific
9.4.1 Market Estimates & Forecast, 2017-2023
9.4.2 Market Estimates & Forecast by Application, 2017-2023
9.4.3 Market Estimates & Forecast by Verticals, 2017-2023
9.4.4 Market Estimates & Forecast by Applications, 2017-2023
9.4.5 China
9.4.5.1 Market Estimates & Forecast, 2017-2023
9.4.5.2 Market Estimates & Forecast by Application, 2017-2023
9.4.5.3 Market Estimates & Forecast by Verticals, 2017-2023
9.4.5.4 Market Estimates & Forecast by Applications, 2017-2023
9.4.6 India
9.4.6.1 Market Estimates & Forecast, 2017-2023
9.4.6.2 Market Estimates & Forecast by Application, 2017-2023
9.4.6.3 Market Estimates & Forecast by Verticals, 2017-2023
9.4.6.4 Market Estimates & Forecast by Applications, 2017-2023
9.4.7 Japan
9.4.7.1 Market Estimates & Forecast, 2017-2023
9.4.7.2 Market Estimates & Forecast by Application, 2017-2023
9.4.7.3 Market Estimates & Forecast by Verticals, 2017-2023
9.4.7.4 Market Estimates & Forecast by Applications, 2017-2023
9.4.8 Australia
9.4.8.1 Market Estimates & Forecast, 2017-2023
9.4.8.2 Market Estimates & Forecast by Application, 2017-2023
9.4.8.3 Market Estimates & Forecast by Verticals, 2017-2023
9.4.8.4 Market Estimates & Forecast by Applications, 2017-2023
9.4.9 New Zealand
9.4.9.1 Market Estimates & Forecast, 2017-2023
9.4.9.2 Market Estimates & Forecast by Application, 2017-2023
9.4.9.3 Market Estimates & Forecast by Verticals, 2017-2023
9.4.9.4 Market Estimates & Forecast by Applications, 2017-2023
9.4.10 Rest of Asia Pacific
9.4.9.1 Market Estimates & Forecast, 2017-2023
9.4.9.2 Market Estimates & Forecast by Application, 2017-2023
9.4.9.3 Market Estimates & Forecast by Verticals, 2017-2023
9.4.9.4 Market Estimates & Forecast by Applications, 2017-2023
9.5 Rest of the World
9.5.1 Market Estimates & Forecast, 2017-2023
9.5.2 Market Estimates & Forecast by Application, 2017-2023
9.5.3 Market Estimates & Forecast by Verticals, 2017-2023
9.5.4 Market Estimates & Forecast by Applications, 2017-2023
9.5.5 The Middle East & Africa
9.5.5.1 Market Estimates & Forecast, 2017-2023
9.5.5.2 Market Estimates & Forecast by Application, 2017-2023
9.5.5.3 Market Estimates & Forecast by Verticals, 2017-2023
9.5.5.4 Market Estimates & Forecast by Applications, 2017-2023
9.5.6 Latin Countries
9.5.6.1 Market Estimates & Forecast, 2017-2023
9.5.6.2 Market Estimates & Forecast by Application, 2017-2023
9.5.6.3 Market Estimates & Forecast by Verticals, 2017-2023
9.5.6.4 Market Estimates & Forecast by Applications, 2017-2023
10. Company Landscape
11. Company Profiles
11.1 Apple, Inc
11.1.1 Company Overview
11.1.2 Product/Business Segment Overview
11.1.3 Financial Updates
11.1.4 Key Developments
11.2 Saab Automobile AB
11.2.1 Company Overview
11.2.2 Product/Business Segment Overview
11.2.3 Financial Updates
11.2.4 Key Developments
11.3 Airbus Defence and Space SAS
11.3.1 Company Overview
11.3.2 Product/Business Segment Overview
11.3.3 Financial Updates
11.3.4 Key Developments
11.4 Google, Inc.
11.4.1 Company Overview
11.4.2 Product/Business Segment Overview
11.4.3 Financial Updates
11.4.4 Key Developments
11.5 Autodesk, Inc.
11.5.1 Company Overview
11.5.2 Product/Business Segment Overview
11.5.3 Financial Updates
11.5.4 Key Developments
11.6 Trimble Inc.
11.6.1 Company Overview
11.6.2 Product/Business Segment Overview
11.6.3 Financial Updates
11.6.4 Key Developments
11.7 Intermap Technologies
11.7.1 Company Overview
11.7.2 Product/Business Segment Overview
11.7.3 Financial Updates
11.7.4 Key Developments
11.8 Topcon Corporation
11.8.1 Company Overview
11.8.2 Product/Business Segment Overview
11.8.3 Financial Updates
11.8.4 Key Developments
11.9 Cybercity 3D, Inc.
11.9.1 Company Overview
11.9.2 Product/Business Segment Overview
11.9.3 Financial Updates
11.9.4 Key Developments
11.10 Esri
11.10.1 Company Overview
11.10.2 Product/Business Segment Overview
11.10.3 Financial Updates
11.10.4 Key Developments
11.11 Applied EarthWorks, Inc.
11.11.1 Company Overview
11.11.2 Product/Business Segment Overview
11.11.3 Financial Updates
11.11.4 Key Developments
11.12 Aerolion
11.12.1 Company Overview
11.12.2 Product/Business Segment Overview
11.12.3 Financial Updates
11.12.4 Key Developments
11.13 Mitsubishi Motors Corporation
11.13.1 Company Overview
11.13.2 Product/Business Segment Overview
11.13.3 Financial Updates
11.13.4 Key Developments
11.14 Udemy Inc.
11.14.1 Company Overview
11.14.2 Product/Business Segment Overview
11.14.3 Financial Updates
11.14.4 Key Developments
11.15 Pixologic, Inc.
11.15.1 Company Overview
11.15.2 Product/Business Segment Overview
11.15.3 Financial Updates
11.15.4 Key Developments
11.16 Others
11.16.1 Company Overview
11.16.2 Product/Business Segment Overview
11.16.3 Financial Updates
11.16.4 Key Developments
12 Conclusion
LIST OF TABLES
Table 1 Global 3D mapping and 3D modelling Market: By Region, 2017-2023
Table 2 North America 3D mapping and 3D modelling Market: By Country, 2017-2023
Table 3 Europe 3D mapping and 3D modelling Market: By Country, 2017-2023
Table 4 Asia-Pacific 3D mapping and 3D modelling Market: By Country, 2017-2023
Table 5 Middle East & Africa 3D mapping and 3D modelling Market: By Country, 2017-2023
Table 6 Latin America 3D mapping and 3D modelling Market: By Country, 2017-2023
Table 7 Global 3D mapping and 3D modelling by Application Market: By Regions, 2017-2023
Table 8 North America 3D mapping and 3D modelling by Application Market: By Country, 2017-2023
Table9 Europe 3D mapping and 3D modelling by Application Market: By Country, 2017-2023
Table9 Asia-Pacific 3D mapping and 3D modelling by Application Market: By Country, 2017-2023
Table9 Middle East & Africa 3D mapping and 3D modelling by Application Market: By Country, 2017-2023
Table11 Latin America 3D mapping and 3D modelling by Application Market: By Country, 2017-2023
Table13 Global 3D mapping and 3D modelling by Applications Market: By Regions, 2017-2023
Table14 North America 3D mapping and 3D modelling by Applications Market: By Country, 2017-2023
Table15 Europe 3D mapping and 3D modelling by Applications Market: By Country, 2017-2023
Table16 Asia-Pacific 3D mapping and 3D modelling by Applications Market: By Country, 2017-2023
Table17 Middle East & Africa 3D mapping and 3D modelling by Applications Market: By Country, 2017-2023
Table18 Latin America 3D mapping and 3D modelling by Applications Market: By Country, 2017-2023
Table19 North America 3D mapping and 3D modelling for Application Market: By Country, 2017-2023
Table20 Europe 3D mapping and 3D modelling for Application Market: By Country, 2017-2023
Table21 Asia-Pacific 3D mapping and 3D modelling for Application Market: By Country, 2017-2023
Table22 Middle East & Africa 3D mapping and 3D modelling for Application Market: By Country, 2017-2023
Table23 Latin America 3D mapping and 3D modelling for Application Market: By Country, 2017-2023
Table24 Global Application Market: By Region, 2017-2023
Table25 Global Application Market: By Region, 2017-2023
Table26 Global Application Market: By Region, 2017-2023
Table27 North America 3D mapping and 3D modelling Market, By Country
Table28 North America 3D mapping and 3D modelling Market, By Application
Table29 North America 3D mapping and 3D modelling Market, By Application
Table30 North America 3D mapping and 3D modelling Market, By Applications
Table31 Europe: 3D mapping and 3D modelling Market, By Country
Table32 Europe: 3D mapping and 3D modelling Market, By Application
Table33 Europe: 3D mapping and 3D modelling Market, By Application
Table 34 Europe: 3D mapping and 3D modelling Market, By Applications
Table35 Asia-Pacific: 3D mapping and 3D modelling Market, By Country
Table36 Asia-Pacific: 3D mapping and 3D modelling Market, By Application
Table37 Asia-Pacific: 3D mapping and 3D modelling Market, By Application
Table 38 Asia-Pacific: 3D mapping and 3D modelling Market, By Applications
Table39 Middle East & Africa: 3D mapping and 3D modelling Market, By Country
Table40 Middle East & Africa 3D mapping and 3D modelling Market, By Application
Table41 Middle East & Africa: 3D mapping and 3D modelling Market, By Application
Table42 Middle East & Africa: 3D mapping and 3D modelling Market, By Applications
Table43 Latin America: 3D mapping and 3D modelling Market, By Country
Table44 Latin America 3D mapping and 3D modelling Market, By Application
Table45 Latin America: 3D mapping and 3D modelling Market, By Application
Table46 Latin America: 3D mapping and 3D modelling Market, By Applications
LIST OF FIGURES
FIGURE 1 Global 3D mapping and 3D modelling market segmentation
FIGURE 2 Forecast Methodology
FIGURE 3 Five Forces Analysis of Global 3D mapping and 3D modelling Market
FIGURE 4 Value Chain of Global 3D mapping and 3D modelling Market
FIGURE 5 Share of Global 3D mapping and 3D modelling Market in 2017, by country (in %)
FIGURE 6 Global 3D mapping and 3D modelling Market, 2017-2023,
FIGURE 7 Sub segments of Application
FIGURE 8 Global 3D mapping and 3D modelling Market size by Verticals, 2017
FIGURE 9 Share of Global 3D mapping and 3D modelling Market by Application, 2017 TO 2023
FIGURE 9 Global 3D mapping and 3D modelling Market size by Verticals, 2017
FIGURE 9 Share of Global 3D mapping and 3D modelling Market by Application, 2017 TO 2023
FIGURE 11 Global 3D mapping and 3D modelling Market size by Verticals, 2017 TO 2023
FIGURE 13 Share of Global 3D mapping and 3D modelling Market by Verticals, 2017 TO 2023