Certified Global Research Member
Isomar fd.webp Wcrc 57.webp
Key Questions Answered
  • Global Market Outlook
  • In-depth analysis of global and regional trends
  • Analyze and identify the major players in the market, their market share, key developments, etc.
  • To understand the capability of the major players based on products offered, financials, and strategies.
  • Identify disrupting products, companies, and trends.
  • To identify opportunities in the market.
  • Analyze the key challenges in the market.
  • Analyze the regional penetration of players, products, and services in the market.
  • Comparison of major players’ financial performance.
  • Evaluate strategies adopted by major players.
  • Recommendations
Why Choose Market Research Future?
  • Vigorous research methodologies for specific market.
  • Knowledge partners across the globe
  • Large network of partner consultants.
  • Ever-increasing/ Escalating data base with quarterly monitoring of various markets
  • Trusted by fortune 500 companies/startups/ universities/organizations
  • Large database of 5000+ markets reports.
  • Effective and prompt pre- and post-sales support.

2-D Materials Market Research Report Information By Materials (Graphene, TMDCs, Black Phosphorus and Boron Nitride), By Application (Semiconductor, Aerospace, Consumer Electronics, Healthcare, and Energy), And By Region (North America, Europe, Asia-Pacific, And Rest Of The World) –Market Forecast Till 2032.


ID: MRFR/CnM/0629-HCR | 110 Pages | Author: Anshula Mandaokar| April 2024


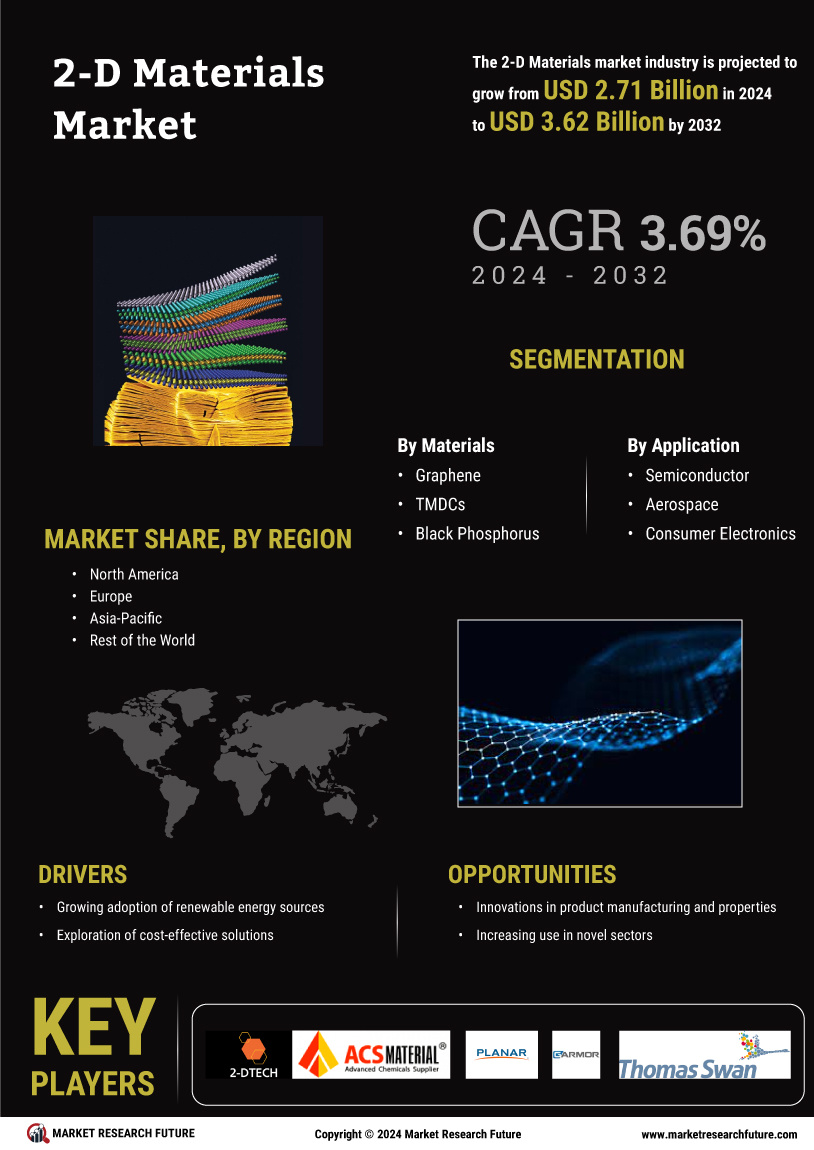
2-D Materials Market Segmentation


2-D Materials Materials Outlook (USD Billion, 2018-2032)


  • Graphene


  • TMDCs


  • Black Phosphorus


  • Boron Nitride


2-D Materials Application Outlook (USD Billion, 2018-2032)


  • Semiconductor


  • Aerospace


  • Consumer Electronics


  • Healthcare


  • Energy


2-D Materials Regional Outlook (USD Billion, 2018-2032)


  • North America Outlook (USD Billion, 2018-2032)


    • North America 2-D Materials by Materials


      • Graphene


      • TMDCs


      • Black Phosphorus


      • Boron Nitride


    • North America 2-D Materials by Application


      • Semiconductor


      • Aerospace


      • Consumer Electronics


      • Healthcare


      • Energy


    • US Outlook (USD Billion, 2018-2032)


    • US 2-D Materials by Materials


      • Graphene


      • TMDCs


      • Black Phosphorus


      • Boron Nitride


    • US 2-D Materials by Application


      • Semiconductor


      • Aerospace


      • Consumer Electronics


      • Healthcare


      • Energy


    • CANADA Outlook (USD Billion, 2018-2032)


    • CANADA 2-D Materials by Materials


      • Graphene


      • TMDCs


      • Black Phosphorus


      • Boron Nitride


    • CANADA 2-D Materials by Application


      • Semiconductor


      • Aerospace


      • Consumer Electronics


      • Healthcare


      • Energy


  • Europe Outlook (USD Billion, 2018-2032)


    • Europe 2-D Materials by Materials


      • Graphene


      • TMDCs


      • Black Phosphorus


      • Boron Nitride


    • Europe 2-D Materials by Application


      • Semiconductor


      • Aerospace


      • Consumer Electronics


      • Healthcare


      • Energy


    • Germany Outlook (USD Billion, 2018-2032)


    • Germany 2-D Materials by Materials


      • Graphene


      • TMDCs


      • Black Phosphorus


      • Boron Nitride


    • Germany 2-D Materials by Application


      • Semiconductor


      • Aerospace


      • Consumer Electronics


      • Healthcare


      • Energy


    • France Outlook (USD Billion, 2018-2032)


    • France 2-D Materials by Materials


      • Graphene


      • TMDCs


      • Black Phosphorus


      • Boron Nitride


    • France 2-D Materials by Application


      • Semiconductor


      • Aerospace


      • Consumer Electronics


      • Healthcare


      • Energy


    • UK Outlook (USD Billion, 2018-2032)


    • UK 2-D Materials by Materials


      • Graphene


      • TMDCs


      • Black Phosphorus


      • Boron Nitride


    • UK 2-D Materials by Application


      • Semiconductor


      • Aerospace


      • Consumer Electronics


      • Healthcare


      • Energy


    • ITALY Outlook (USD Billion, 2018-2032)


    • ITALY 2-D Materials by Materials


      • Graphene


      • TMDCs


      • Black Phosphorus


      • Boron Nitride


    • ITALY 2-D Materials by Application


      • Semiconductor


      • Aerospace


      • Consumer Electronics


      • Healthcare


      • Energy


    • SPAIN Outlook (USD Billion, 2018-2032)


    • Spain 2-D Materials by Materials


      • Graphene


      • TMDCs


      • Black Phosphorus


      • Boron Nitride


    • Spain 2-D Materials by Application


      • Semiconductor


      • Aerospace


      • Consumer Electronics


      • Healthcare


      • Energy


    • Rest Of Europe Outlook (USD Billion, 2018-2032)


    • Rest Of Europe 2-D Materials by Materials


      • Graphene


      • TMDCs


      • Black Phosphorus


      • Boron Nitride


    • Rest Of Europe 2-D Materials by Application


      • Semiconductor


      • Aerospace


      • Consumer Electronics


      • Healthcare


      • Energy


  • Asia-Pacific Outlook (USD Billion, 2018-2032)


    • Asia-Pacific 2-D Materials by Materials


      • Graphene


      • TMDCs


      • Black Phosphorus


      • Boron Nitride


    • Asia-Pacific 2-D Materials by Application


      • Semiconductor


      • Aerospace


      • Consumer Electronics


      • Healthcare


      • Energy


    • China Outlook (USD Billion, 2018-2032)


    • China 2-D Materials by Materials


      • Graphene


      • TMDCs


      • Black Phosphorus


      • Boron Nitride


    • China 2-D Materials by Application


      • Semiconductor


      • Aerospace


      • Consumer Electronics


      • Healthcare


      • Energy


    • Japan Outlook (USD Billion, 2018-2032)


    • Japan 2-D Materials by Materials


      • Graphene


      • TMDCs


      • Black Phosphorus


      • Boron Nitride


    • Japan 2-D Materials by Application


      • Semiconductor


      • Aerospace


      • Consumer Electronics


      • Healthcare


      • Energy


    • India Outlook (USD Billion, 2018-2032)


    • India 2-D Materials by Materials


      • Graphene


      • TMDCs


      • Black Phosphorus


      • Boron Nitride


    • India 2-D Materials by Application


      • Semiconductor


      • Aerospace


      • Consumer Electronics


      • Healthcare


      • Energy


    • Australia Outlook (USD Billion, 2018-2032)


    • Australia 2-D Materials by Materials


      • Graphene


      • TMDCs


      • Black Phosphorus


      • Boron Nitride


    • Australia 2-D Materials by Application


      • Semiconductor


      • Aerospace


      • Consumer Electronics


      • Healthcare


      • Energy


    • Rest of Asia-Pacific Outlook (USD Billion, 2018-2032)


    • Rest of Asia-Pacific 2-D Materials by Materials


      • Graphene


      • TMDCs


      • Black Phosphorus


      • Boron Nitride


    • Rest of Asia-Pacific 2-D Materials by Application


      • Semiconductor


      • Aerospace


      • Consumer Electronics


      • Healthcare


      • Energy


  • Rest of the World Outlook (USD Billion, 2018-2032)


    • Rest of the World 2-D Materials by Materials


      • Graphene


      • TMDCs


      • Black Phosphorus


      • Boron Nitride


    • Rest of the World 2-D Materials by Application


      • Semiconductor


      • Aerospace


      • Consumer Electronics


      • Healthcare


      • Energy


    • Middle East Outlook (USD Billion, 2018-2032)


    • Middle East 2-D Materials by Materials


      • Graphene


      • TMDCs


      • Black Phosphorus


      • Boron Nitride


    • Middle East 2-D Materials by Application


      • Semiconductor


      • Aerospace


      • Consumer Electronics


      • Healthcare


      • Energy


    • Africa Outlook (USD Billion, 2018-2032)


    • Africa 2-D Materials by Materials


      • Graphene


      • TMDCs


      • Black Phosphorus


      • Boron Nitride


    • Africa 2-D Materials by Application


      • Semiconductor


      • Aerospace


      • Consumer Electronics


      • Healthcare


      • Energy


    • Latin America Outlook (USD Billion, 2018-2032)


    • Latin America 2-D Materials by Materials


      • Graphene


      • TMDCs


      • Black Phosphorus


      • Boron Nitride


    • Latin America 2-D Materials by Application


      • Semiconductor


      • Aerospace


      • Consumer Electronics


      • Healthcare


      • Energy


Research Methodology on 2D Materials Market


The purpose of this research is to make an analysis of the global 2D Materials Market. The primary research methodology is focused on researching and collecting data from the key players and the top industries that are working on 2D Materials. This research involves collecting primary and secondary data on the past and current situation of the global 2D materials market. Research techniques such as factor analysis, bottom-up approach, top-down approach, and demand-side and supply-side data triangulation were used.


Research Approach


The research approach used in this study includes secondary research, conducted using various sources such as original periodicals, journals, governmental websites, market reports, corporate and company websites, analysts’ opinions and industry databases, and primary research where the data obtained from structured interviews with industry experts and manufacturers. The research approach also involves the use of different tools such as time-series analysis to figure out trends in the volume of the market, industry estimations, and future forecasts regarding market growth and market value. Comprehensive additional research was implemented on customer insights, market strategies, pricing, technology, competition, and supply chain in the market.


Secondary Research


Secondary research is used as the main source for data compilation and analysis in this study for analyzing the global 2D materials market. In secondary research, the data is collected from various sources such as government regulatory bodies, company websites, press releases, articles, books, and periodicals. Other sources such as factsheets, annual reports, and patent data were also collected from relevant stakeholders. The data gathered was validated through primary research and was used for interviews and surveys.


Primary Research


The opinion of the primary respondents from the global 2D materials from industry was also taken into account by conducting structured interviews with industry experts, manufacturers, and market players. The validated data was collected from manufacturers, existing suppliers, and customers through the complete analysis of the supply chain. The primary research also included surveys conducted online to obtain information about the end-users, price, and other usage-related information. A comprehensive database was compiled from the primary research conducted.


Bottom-up Approach


In this study, the bottom-up approach was used for the comprehensive analysis of the 2D materials market. In the bottom-up approach, first, the subtotal sales of different regions and countries were calculated and then they were summed up to arrive at the total market value. This approach was used to forecast the market size of the global 2D Materials market. This approach takes into account the micro-economic factors of the market.


Top-Down Approach


The top-down approach was also used to analyze the global 2D materials market. In this approach, the total market size was based on the market size of the various countries and regions as identified by the secondary research. This approach was used to estimate the total market size of the global 2D Materials market. This approach takes into account the macroeconomic factors of the market.


Factor Analysis


Factor analysis was used in this research to identify and analyze the driving forces, restraining forces, opportunities, and risks related to the global 2D materials market. Various industry parameters such as pricing, competition, customer preferences, technology, supply chain, and government policies were considered while carrying out the factor analysis.


Time-series Analysis


An in-depth time-series analysis was used to analyze the past and present trends in the volume of the global 2D materials market. The historical trends of the market were studied to make projections about the future direction of the global 2D materials market.


Demand Side and Supply Side Data Triangulation


Data triangulation was used to ensure the accuracy and reliability of the results. Data from different sources and different perspectives was collected and triangulated to identify and recognize any discrepancies between the market forecasts. The demand-side and supply-side data triangulation is used to arrive at an accurate overall market size.


Stakeholder Mapping


The research also includes conducting a stakeholder mapping. This involves mapping the stakeholders based on their roles in the global 2D materials market. The information collected from the mapping process was used for verifying the primary and secondary research and arrive at a reasonable market size.


Conclusion


The research methodology adopted in this study focused on collecting primary and secondary data on the past and current situation of the global 2D materials market. The primary research methodology included interviewing industry experts, suppliers, and customers. The research also included the utilization of different tools such as factor analysis, bottom-up approach, top-down approach, time-series analysis, and demand side and supply side data triangulation to identify, assess, and analyze the trends in the global 2D Materials market.

Leading companies partner with us for data-driven Insights
client_1 client_2 client_3 client_4 client_5 client_6 client_7 client_8 client_9 client_10
Please fill in Business Email for Quick Response

TABLE OF CONTENTS

SECTION I: EXECUTIVE SUMMARY AND KEY HIGHLIGHTS

1. EXECUTIVE’S HANDBOOK

1.1. The Top Performing Segments

1.2. Key Trends Summarized

1.3. Pricing Outlook

1.4. Strategic Insights

1.5. Who are the Key Players in the Market?

SECTION II: SCOPING, METHODOLOGY AND MARKET STRUCTURE

2. MARKET INTRODUCTION

2.1. Definition

2.2. Report Segmentation & Scope

2.3. Regional & Country Level Coverage

2.4. Why you need this report?

3. RESEARCH METHODOLOGY

3.1. Research Process

3.2. Secondary Research

3.2.1. Data Mining & Condensation

3.2.2. Sources (Associations, Organizations, Magazines, Paid Databases)

3.3. Primary Research

3.3.1. Sample Size (Demand-Supply, Company Type, Designations, Region)

3.3.2. Sources

3.4. Factorial Analysis & Approach Setting

3.5. Estimation & Forecast Models

3.6. Pricing Baskets

3.7. Analyst Hours & Team

SECTION III: QUALITATIVE ANALYSIS

4. MARKET DYNAMICS

4.1. Introduction

4.2. Growth Parameters Mapped - Drivers

4.2.1. Growing adoption of renewable energy sources

4.2.2. Exploration of cost-effective solutions

4.3. What are the challenges faced by Industry Participants?

4.3.1. High manufacturing costs

4.4. Opportunities

4.4.1. Innovations in product manufacturing and properties

4.4.2. Increasing use in novel sectors

4.5. Regulatory Update

4.6. Impact Analysis of COVID-19

4.6.1. Impact on Supply Chain of 2D Materials

4.6.2. Impact on Market Demand of 2D Materials

5. MARKET FACTOR ANALYSIS

5.1. Supply/Value Chain Analysis

5.1.1. Participants

5.1.2. Value Percolation Across the Chain

5.1.3. Integration Levels

5.1.4. Key Issues Addressed

5.2. Porter’s Five Forces Model

5.2.1. Bargaining Power of Suppliers

5.2.2. Bargaining Power of Buyers

5.2.3. Threat of New Entrants

5.2.4. Threat of Substitutes

5.2.5. Intensity of Rivalry

SECTION IV: QUANTITATIVE ANALYSIS

6. GLOBAL 2D MATERIALS MARKET, BY MATERIAL (USD MILLION & KILOTONS)

6.1. Introduction

6.2. Graphene

6.2.1. Global 2D Materials Market Size: Market Estimates & Forecast, By Graphene, 2018-2032

6.3. TMDCs

6.3.1. Global 2D Materials Market Size: Market Estimates & Forecast, By TMDCs, 2018-2032

6.4. Black Phosphorus

6.4.1. Global 2D Materials Market Size: Market Estimates & Forecast, By Black Phosphorus, 2018-2032

6.5. Boron Nitride

6.5.1. Global 2D Materials Market Size: Market Estimates & Forecast, By Boron Nitride, 2018-2032

6.6. Others

6.6.1. Global 2D Materials Market Size: Market Estimates & Forecast, By Others, 2018-2032

7. GLOBAL 2D MATERIALS MARKET, BY APPLICATION (USD MILLION & KILOTONS)

7.1. Introduction

7.2. Semiconductor

7.2.1. Global 2D Materials Market Size: Market Estimates & Forecast, By Semiconductor, 2018-2032

7.3. Aerospace

7.3.1. Global 2D Materials Market Size: Market Estimates & Forecast, By Aerospace, 2018-2032

7.4. Consumer Electronics

7.4.1. Global 2D Materials Market Size: Market Estimates & Forecast, By Consumer Electronics, 2018-2032

7.5. Healthcare

7.5.1. Global 2D Materials Market Size: Market Estimates & Forecast, By Healthcare, 2018-2032

7.6. Others

7.6.1. Global 2D Materials Market Size: Market Estimates & Forecast, By Others, 2018-2032

8. GLOBAL 2D MATERIALS MARKET, BY REGION (USD MILLION & KILOTONS)

8.1. Introduction

8.2. North America

8.2.1. North America 2D Materials Market Size: Market Estimates & Forecast, By Country, 2018-2032

8.2.2. North America 2D Materials Market Size: Market Estimates & Forecast, By Material, 2018-2032

8.2.3. North America 2D Materials Market Size: Market Estimates & Forecast, By Application, 2018-2032

8.2.4. US

8.2.4.1. US 2D Materials Market Size: Market Estimates & Forecast, By Material, 2018-2032

8.2.4.2. US 2D Materials Market Size: Market Estimates & Forecast, By Application, 2018-2032

8.2.5. Canada

8.2.5.1. Canada 2D Materials Market Size: Market Estimates & Forecast, By Material, 2018-2032

8.2.5.2. Canada 2D Materials Market Size: Market Estimates & Forecast, By Application, 2018-2032

8.2.6. Mexico

8.2.6.1. Mexico 2D Materials Market Size: Market Estimates & Forecast, By Material, 2018-2032

8.2.6.2. Mexico 2D Materials Market Size: Market Estimates & Forecast, By Application, 2018-2032

8.3. Europe

8.3.1. Europe 2D Materials Market Size: Market Estimates & Forecast, By Country, 2018-2032

8.3.2. Europe 2D Materials Market Size: Market Estimates & Forecast, By Material, 2018-2032

8.3.3. Europe 2D Materials Market Size: Market Estimates & Forecast, By Application, 2018-2032

8.3.4. Germany

8.3.4.1. Germany 2D Materials Market Size: Market Estimates & Forecast, By Material, 2018-2032

8.3.4.2. Germany 2D Materials Market Size: Market Estimates & Forecast, By Application, 2018-2032

8.3.5. France

8.3.5.1. France 2D Materials Market Size: Market Estimates & Forecast, By Material, 2018-2032

8.3.5.2. France 2D Materials Market Size: Market Estimates & Forecast, By Application, 2018-2032

8.3.6. UK

8.3.6.1. UK 2D Materials Market Size: Market Estimates & Forecast, By Material, 2018-2032

8.3.6.2. UK 2D Materials Market Size: Market Estimates & Forecast, By Application, 2018-2032

8.3.7. Spain

8.3.7.1. Spain 2D Materials Market Size: Market Estimates & Forecast, By Material, 2018-2032

8.3.7.2. Spain 2D Materials Market Size: Market Estimates & Forecast, By Application, 2018-2032

8.3.8. Italy

8.3.8.1. Italy 2D Materials Market Size: Market Estimates & Forecast, By Material, 2018-2032

8.3.8.2. Italy 2D Materials Market Size: Market Estimates & Forecast, By Application, 2018-2032

8.3.9. Rest of Europe

8.3.9.1. Rest of Europe 2D Materials Market Size: Market Estimates & Forecast, By Country, 2018-2032

8.3.9.2. Rest of Europe 2D Materials Market Size: Market Estimates & Forecast, By Material, 2018-2032

8.3.9.3. Rest of Europe 2D Materials Market Size: Market Estimates & Forecast, By Application, 2018-2032

8.4. Asia-Pacific

8.4.1. Asia-Pacific 2D Materials Market Size: Market Estimates & Forecast, By Country, 2018-2032

8.4.2. Asia-Pacific 2D Materials Market Size: Market Estimates & Forecast, By Material, 2018-2032

8.4.3. Asia-Pacific 2D Materials Market Size: Market Estimates & Forecast, By Application, 2018-2032

8.4.4. China

8.4.4.1. China 2D Materials Market Size: Market Estimates & Forecast, By Material, 2018-2032

8.4.4.2. China 2D Materials Market Size: Market Estimates & Forecast, By Application, 2018-2032

8.4.5. India

8.4.5.1. India 2D Materials Market Size: Market Estimates & Forecast, By Material, 2018-2032

8.4.5.2. India 2D Materials Market Size: Market Estimates & Forecast, By Application, 2018-2032

8.4.6. Japan

8.4.6.1. Japan 2D Materials Market Size: Market Estimates & Forecast, By Material, 2018-2032

8.4.6.2. Japan 2D Materials Market Size: Market Estimates & Forecast, By Application, 2018-2032

8.4.7. South Korea

8.4.7.1. South Korea 2D Materials Market Size: Market Estimates & Forecast, By Material, 2018-2032

8.4.7.2. South Korea 2D Materials Market Size: Market Estimates & Forecast, By Application, 2018-2032

8.4.8. Rest of Asia-Pacific

8.4.8.1. Rest of Asia-Pacific 2D Materials Market Size: Market Estimates & Forecast, By Country, 2018-2032

8.4.8.2. Rest of Asia-Pacific 2D Materials Market Size: Market Estimates & Forecast, By Material, 2018-2032

8.4.8.3. Rest of Asia-Pacific 2D Materials Market Size: Market Estimates & Forecast, By Application, 2018-2032

8.5. Middle East & Africa

8.5.1. Middle East & Africa 2D Materials Market Size: Market Estimates & Forecast, By Country, 2018-2032

8.5.2. Middle East & Africa 2D Materials Market Size: Market Estimates & Forecast, By Material, 2018-2032

8.5.3. Middle East & Africa 2D Materials Market Size: Market Estimates & Forecast, By Application, 2018-2032

8.5.4. GCC Countries

8.5.4.1. GCC Countries 2D Materials Market Size: Market Estimates & Forecast, By Material, 2018-2032

8.5.4.2. GCC Countries 2D Materials Market Size: Market Estimates & Forecast, By Application, 2018-2032

8.5.5. South Africa

8.5.5.1. South Africa 2D Materials Market Size: Market Estimates & Forecast, By Material, 2018-2032

8.5.5.2. South Africa 2D Materials Market Size: Market Estimates & Forecast, By Application, 2018-2032

8.5.6. Rest of Middle East & Africa

8.5.6.1. Rest of Middle East & Africa 2D Materials Market Size: Market Estimates & Forecast, By Country, 2018-2032

8.5.6.2. Rest of Middle East & Africa 2D Materials Market Size: Market Estimates & Forecast, By Material, 2018-2032

8.5.6.3. Rest of Middle East & Africa 2D Materials Market Size: Market Estimates & Forecast, By Application, 2018-2032

8.6. South America

8.6.1. South America 2D Materials Market Size: Market Estimates & Forecast, By Country, 2018-2032

8.6.2. South America 2D Materials Market Size: Market Estimates & Forecast, By Material, 2018-2032

8.6.3. South America 2D Materials Market Size: Market Estimates & Forecast, By Application, 2018-2032

8.6.4. Brazil

8.6.4.1. Brazil 2D Materials Market Size: Market Estimates & Forecast, By Material, 2018-2032

8.6.4.2. Brazil 2D Materials Market Size: Market Estimates & Forecast, By Application, 2018-2032

8.6.5. Argentina

8.6.5.1. Argentina 2D Materials Market Size: Market Estimates & Forecast, By Material, 2018-2032

8.6.5.2. Argentina 2D Materials Market Size: Market Estimates & Forecast, By Application, 2018-2032

8.6.6. Rest of South America

8.6.6.1. Rest of South America 2D Materials Market Size: Market Estimates & Forecast, By Country, 2018-2032

8.6.6.2. Rest of South America 2D Materials Market Size: Market Estimates & Forecast, By Material, 2018-2032

8.6.6.3. Rest of South America 2D Materials Market Size: Market Estimates & Forecast, By Application, 2018-2032

SECTION V: COMPETITIVE ANALYSIS

9. COMPETITIVE LANDSCAPE

9.1. Introduction

9.2. Competition Dashboard

9.3. Company Market Share Analysis, 2023

9.4. Who are the market disruptors & innovators?

9.5. What strategies are being adopted by market leaders?

9.6. Competitive Benchmarking

9.7. The Leading Player in terms of Number of Developments in the Global 2D Materials Market

9.8. List of Key Players, By Region

9.9. Public Players Stock Summary

9.10. Comparative Analysis: Key Players Financial

9.11. Key Developments & Growth Strategies

9.11.1. New Product Launch/Service Deployment

9.11.2. Merger & Acquisition

9.11.3. Joint Ventures

10. COMPANY PROFILES

10.1. 2-DTech

10.1.1. Company Overview

10.1.2. Financial Overview

10.1.3. Product Offered

10.1.4. Key Developments

10.1.5. SWOT Analysis

10.1.6. Key Strategies

10.2. Layer One – Advanced Materials

10.2.1. Company Overview

10.2.2. Financial Overview

10.2.3. Product Offered

10.2.4. Key Developments

10.2.5. SWOT Analysis

10.2.6. Key Strategies

10.3. ACS Material, LLC

10.3.1. Company Overview

10.3.2. Financial Overview

10.3.3. Product Offered

10.3.4. Key Developments

10.3.5. SWOT Analysis

10.3.6. Key Strategies

10.4. Nitronix

10.4.1. Company Overview

10.4.2. Financial Overview

10.4.3. Product Offered

10.4.4. Key Developments

10.4.5. SWOT Analysis

10.4.6. Key Strategies

10.5. Planar Tech

10.5.1. Company Overview

10.5.2. Financial Overview

10.5.3. Product Offered

10.5.4. Key Developments

10.5.5. SWOT Analysis

10.5.6. Key Strategies

10.6. Thomas-swan

10.6.1. Company Overview

10.6.2. Financial Overview

10.6.3. Product Offered

10.6.4. Key Developments

10.6.5. SWOT Analysis

10.6.6. Key Strategies

10.7. AVANZARE

10.7.1. Company Overview

10.7.2. Financial Overview

10.7.3. Product Offered

10.7.4. Key Developments

10.7.5. SWOT Analysis

10.7.6. Key Strategies

10.8. Garmor

10.8.1. Company Overview

10.8.2. Financial Overview

10.8.3. Product Offered

10.8.4. Key Developments

10.8.5. SWOT Analysis

10.8.6. Key Strategies

10.9. Abalonyx AS

10.9.1. Company Overview

10.9.2. Financial Overview

10.9.3. Product Offered

10.9.4. Key Developments

10.9.5. SWOT Analysis

10.9.6. Key Strategies

10.10. XG Sciences

10.10.1. Company Overview

10.10.2. Financial Overview

10.10.3. Product Offered

10.10.4. Key Developments

10.10.5. SWOT Analysis

10.10.6. Key Strategies

11. RECOMMENDATIONS & EXPERT INSIGHTS

11.1. What is the short-term vs long-term outlook for 2D Materials Market?

11.2. Who are the players to look out for?

11.3. What will the product mix look in coming years?

12. MRFR OFFERINGS & TEAM

12.1. Citations & Media

12.2. Our Regional Representatives

12.3. Related Reports

12.4. Our Domain Coverage

LIST OF TABLES

TABLE 1. LIST OF ASSUMPTIONS

TABLE 2. GLOBAL 2D MATERIALS MARKET ESTIMATES & FORECAST, BY MATERIAL, 2018-2032 (USD MILLION)

TABLE 3. GLOBAL 2D MATERIALS MARKET ESTIMATES & FORECAST, BY MATERIAL, 2018-2032 (IN KILOTONS)

TABLE 4. GLOBAL 2D MATERIALS MARKET ESTIMATES & FORECAST, BY APPLICATION, 2018-2032 (USD MILLION)

TABLE 5. GLOBAL 2D MATERIALS MARKET ESTIMATES & FORECAST, BY APPLICATION, 2018-2032 (IN KILOTONS)

TABLE 6. GLOBAL 2D MATERIALS MARKET, BY REGION, 2018-2032 (USD MILLION)

TABLE 7. NORTH AMERICA: 2D MATERIALS MARKET, BY COUNTRY, 2018-2032 (USD MILLION)

TABLE 8. NORTH AMERICA: 2D MATERIALS MARKET, BY COUNTRY, 2018-2032 (IN KILOTONS)

TABLE 9. NORTH AMERICA: 2D MATERIALS MARKET, BY MATERIAL, 2018-2032 (USD MILLION)

TABLE 10. NORTH AMERICA: 2D MATERIALS MARKET, BY MATERIAL, 2018-2032 (IN KILOTONS)

TABLE 11. NORTH AMERICA: 2D MATERIALS MARKET, BY APPLICATION, 2018-2032 (USD MILLION)

TABLE 12. NORTH AMERICA: 2D MATERIALS MARKET, BY APPLICATION, 2018-2032 (IN KILOTONS)

TABLE 13. U.S.: 2D MATERIALS MARKET, BY MATERIAL, 2018-2032 (USD MILLION)

TABLE 14. U.S.: 2D MATERIALS MARKET, BY MATERIAL, 2018-2032 (IN KILOTONS)

TABLE 15. U.S.: 2D MATERIALS MARKET, BY APPLICATION, 2018-2032 (USD MILLION)

TABLE 16. U.S.: 2D MATERIALS MARKET, BY APPLICATION, 2018-2032 (IN KILOTONS)

TABLE 17. CANADA: 2D MATERIALS MARKET, BY MATERIAL, 2018-2032 (USD MILLION)

TABLE 18. CANADA: 2D MATERIALS MARKET, BY MATERIAL, 2018-2032 (IN KILOTONS)

TABLE 19. CANADA: 2D MATERIALS MARKET, BY APPLICATION, 2018-2032 (USD MILLION)

TABLE 20. CANADA: 2D MATERIALS MARKET, BY APPLICATION, 2018-2032 (IN KILOTONS)

TABLE 21. MEXICO: 2D MATERIALS MARKET, BY MATERIAL, 2018-2032 (USD MILLION)

TABLE 22. MEXICO: 2D MATERIALS MARKET, BY MATERIAL, 2018-2032 (IN KILOTONS)

TABLE 23. MEXICO: 2D MATERIALS MARKET, BY APPLICATION, 2018-2032 (USD MILLION)

TABLE 24. MEXICO: 2D MATERIALS MARKET, BY APPLICATION, 2018-2032 (IN KILOTONS)

TABLE 25. EUROPE: 2D MATERIALS MARKET, BY COUNTRY, 2018-2032 (USD MILLION)

TABLE 26. EUROPE: 2D MATERIALS MARKET, BY COUNTRY, 2018-2032 (IN KILOTONS)

TABLE 27. EUROPE: 2D MATERIALS MARKET, BY MATERIAL, 2018-2032 (USD MILLION)

TABLE 28. EUROPE: 2D MATERIALS MARKET, BY MATERIAL, 2018-2032 (IN KILOTONS)

TABLE 29. EUROPE: 2D MATERIALS MARKET, BY APPLICATION, 2018-2032 (USD MILLION)

TABLE 30. EUROPE: 2D MATERIALS MARKET, BY APPLICATION, 2018-2032 (IN KILOTONS)

TABLE 31. GERMANY: 2D MATERIALS MARKET, BY MATERIAL, 2018-2032 (USD MILLION)

TABLE 32. GERMANY: 2D MATERIALS MARKET, BY MATERIAL, 2018-2032 (IN KILOTONS)

TABLE 33. GERMANY: 2D MATERIALS MARKET, BY APPLICATION, 2018-2032 (USD MILLION)

TABLE 34. GERMANY: 2D MATERIALS MARKET, BY APPLICATION, 2018-2032 (IN KILOTONS)

TABLE 35. FRANCE: 2D MATERIALS MARKET, BY MATERIAL, 2018-2032 (USD MILLION)

TABLE 36. FRANCE: 2D MATERIALS MARKET, BY MATERIAL, 2018-2032 (IN KILOTONS)

TABLE 37. FRANCE: 2D MATERIALS MARKET, BY APPLICATION, 2018-2032 (USD MILLION)

TABLE 38. FRANCE: 2D MATERIALS MARKET, BY APPLICATION, 2018-2032 (IN KILOTONS)

TABLE 39. UK: 2D MATERIALS MARKET, BY MATERIAL, 2018-2032 (USD MILLION)

TABLE 40. UK: 2D MATERIALS MARKET, BY MATERIAL, 2018-2032 (IN KILOTONS)

TABLE 41. UK: 2D MATERIALS MARKET, BY APPLICATION, 2018-2032 (USD MILLION)

TABLE 42. UK: 2D MATERIALS MARKET, BY APPLICATION, 2018-2032 (IN KILOTONS)

TABLE 43. SPAIN: 2D MATERIALS MARKET, BY MATERIAL, 2018-2032 (USD MILLION)

TABLE 44. SPAIN: 2D MATERIALS MARKET, BY MATERIAL, 2018-2032 (IN KILOTONS)

TABLE 45. SPAIN: 2D MATERIALS MARKET, BY APPLICATION, 2018-2032 (USD MILLION)

TABLE 46. SPAIN: 2D MATERIALS MARKET, BY APPLICATION, 2018-2032 (IN KILOTONS)

TABLE 47. ITALY: 2D MATERIALS MARKET, BY MATERIAL, 2018-2032 (USD MILLION)

TABLE 48. ITALY: 2D MATERIALS MARKET, BY MATERIAL, 2018-2032 (IN KILOTONS)

TABLE 49. ITALY: 2D MATERIALS MARKET, BY APPLICATION, 2018-2032 (USD MILLION)

TABLE 50. ITALY: 2D MATERIALS MARKET, BY APPLICATION, 2018-2032 (IN KILOTONS)

TABLE 51. REST OF EUROPE: 2D MATERIALS MARKET, BY COUNTRY, 2018-2032 (USD MILLION)

TABLE 52. REST OF EUROPE: 2D MATERIALS MARKET, BY COUNTRY, 2018-2032 (IN KILOTONS)

TABLE 53. REST OF EUROPE: 2D MATERIALS MARKET, BY MATERIAL, 2018-2032 (USD MILLION)

TABLE 54. REST OF EUROPE: 2D MATERIALS MARKET, BY MATERIAL, 2018-2032 (IN KILOTONS)

TABLE 55. REST OF EUROPE: 2D MATERIALS MARKET, BY APPLICATION, 2018-2032 (USD MILLION)

TABLE 56. REST OF EUROPE: 2D MATERIALS MARKET, BY APPLICATION, 2018-2032 (IN KILOTONS)

TABLE 57. ASIA PACIFIC: 2D MATERIALS MARKET, BY COUNTRY, 2018-2032 (USD MILLION)

TABLE 58. ASIA PACIFIC: 2D MATERIALS MARKET, BY COUNTRY, 2018-2032 (IN KILOTONS)

TABLE 59. ASIA PACIFIC: 2D MATERIALS MARKET, BY MATERIAL, 2018-2032 (USD MILLION)

TABLE 60. ASIA PACIFIC: 2D MATERIALS MARKET, BY MATERIAL, 2018-2032 (IN KILOTONS)

TABLE 61. ASIA PACIFIC: 2D MATERIALS MARKET, BY APPLICATION, 2018-2032 (USD MILLION)

TABLE 62. ASIA PACIFIC: 2D MATERIALS MARKET, BY APPLICATION, 2018-2032 (IN KILOTONS)

TABLE 63. CHINA: 2D MATERIALS MARKET, BY MATERIAL, 2018-2032 (USD MILLION)

TABLE 64. CHINA: 2D MATERIALS MARKET, BY MATERIAL, 2018-2032 (IN KILOTONS)

TABLE 65. CHINA: 2D MATERIALS MARKET, BY APPLICATION, 2018-2032 (USD MILLION)

TABLE 66. CHINA: 2D MATERIALS MARKET, BY APPLICATION, 2018-2032 (IN KILOTONS)

TABLE 67. INDIA: 2D MATERIALS MARKET, BY MATERIAL, 2018-2032 (USD MILLION)

TABLE 68. INDIA: 2D MATERIALS MARKET, BY MATERIAL, 2018-2032 (IN KILOTONS)

TABLE 69. INDIA: 2D MATERIALS MARKET, BY APPLICATION, 2018-2032 (USD MILLION)

TABLE 70. INDIA: 2D MATERIALS MARKET, BY APPLICATION, 2018-2032 (IN KILOTONS)

TABLE 71. JAPAN: 2D MATERIALS MARKET, BY MATERIAL, 2018-2032 (USD MILLION)

TABLE 72. JAPAN: 2D MATERIALS MARKET, BY MATERIAL, 2018-2032 (IN KILOTONS)

TABLE 73. JAPAN: 2D MATERIALS MARKET, BY APPLICATION, 2018-2032 (USD MILLION)

TABLE 74. JAPAN: 2D MATERIALS MARKET, BY APPLICATION, 2018-2032 (IN KILOTONS)

TABLE 75. SOUTH KOREA: 2D MATERIALS MARKET, BY MATERIAL, 2018-2032 (USD MILLION)

TABLE 76. SOUTH KOREA: 2D MATERIALS MARKET, BY MATERIAL, 2018-2032 (IN KILOTONS)

TABLE 77. SOUTH KOREA: 2D MATERIALS MARKET, BY APPLICATION, 2018-2032 (USD MILLION)

TABLE 78. SOUTH KOREA: 2D MATERIALS MARKET, BY APPLICATION, 2018-2032 (IN KILOTONS)

TABLE 79. REST OF ASIA PACIFIC: 2D MATERIALS MARKET, BY COUNTRY, 2018-2032 (USD MILLION)

TABLE 80. REST OF ASIA PACIFIC: 2D MATERIALS MARKET, BY COUNTRY, 2018-2032 (IN KILOTONS)

TABLE 81. REST OF ASIA PACIFIC: 2D MATERIALS MARKET, BY MATERIAL, 2018-2032 (USD MILLION)

TABLE 82. REST OF ASIA PACIFIC: 2D MATERIALS MARKET, BY MATERIAL, 2018-2032 (IN KILOTONS)

TABLE 83. REST OF ASIA PACIFIC: 2D MATERIALS MARKET, BY APPLICATION, 2018-2032 (USD MILLION)

TABLE 84. REST OF ASIA PACIFIC: 2D MATERIALS MARKET, BY APPLICATION, 2018-2032 (IN KILOTONS)

TABLE 85. MIDDLE EAST & AFRICA: 2D MATERIALS MARKET, BY COUNTRY, 2018-2032 (USD MILLION)

TABLE 86. MIDDLE EAST & AFRICA: 2D MATERIALS MARKET, BY COUNTRY, 2018-2032 (IN KILOTONS)

TABLE 87. MIDDLE EAST & AFRICA: 2D MATERIALS MARKET, BY MATERIAL, 2018-2032 (USD MILLION)

TABLE 88. MIDDLE EAST & AFRICA: 2D MATERIALS MARKET, BY MATERIAL, 2018-2032 (IN KILOTONS)

TABLE 89. MIDDLE EAST & AFRICA: 2D MATERIALS MARKET, BY APPLICATION, 2018-2032 (USD MILLION)

TABLE 90. MIDDLE EAST & AFRICA: 2D MATERIALS MARKET, BY APPLICATION, 2018-2032 (IN KILOTONS)

TABLE 91. GCC COUNTRIES: 2D MATERIALS MARKET, BY MATERIAL, 2018-2032 (USD MILLION)

TABLE 92. GCC COUNTRIES: 2D MATERIALS MARKET, BY MATERIAL, 2018-2032 (IN KILOTONS)

TABLE 93. GCC COUNTRIES: 2D MATERIALS MARKET, BY APPLICATION, 2018-2032 (USD MILLION)

TABLE 94. GCC COUNTRIES: 2D MATERIALS MARKET, BY APPLICATION, 2018-2032 (IN KILOTONS)

TABLE 95. SOUTH AFRICA: 2D MATERIALS MARKET, BY MATERIAL, 2018-2032 (USD MILLION)

TABLE 96. SOUTH AFRICA: 2D MATERIALS MARKET, BY MATERIAL, 2018-2032 (IN KILOTONS)

TABLE 97. SOUTH AFRICA: 2D MATERIALS MARKET, BY APPLICATION, 2018-2032 (USD MILLION)

TABLE 98. SOUTH AFRICA: 2D MATERIALS MARKET, BY APPLICATION, 2018-2032 (IN KILOTONS)

TABLE 99. REST OF MIDDLE EAST & AFRICA: 2D MATERIALS MARKET, BY COUNTRY, 2018-2032 (USD MILLION)

TABLE 100. REST OF MIDDLE EAST & AFRICA: 2D MATERIALS MARKET, BY COUNTRY, 2018-2032 (IN KILOTONS)

TABLE 101. REST OF MIDDLE EAST & AFRICA: 2D MATERIALS MARKET, BY MATERIAL, 2018-2032 (USD MILLION)

TABLE 102. REST OF MIDDLE EAST & AFRICA: 2D MATERIALS MARKET, BY MATERIAL, 2018-2032 (IN KILOTONS)

TABLE 103. REST OF MIDDLE EAST & AFRICA: 2D MATERIALS MARKET, BY APPLICATION, 2018-2032 (USD MILLION)

TABLE 104. REST OF MIDDLE EAST & AFRICA: 2D MATERIALS MARKET, BY APPLICATION, 2018-2032 (IN KILOTONS)

TABLE 105. SOUTH AMERICA: 2D MATERIALS MARKET, BY COUNTRY, 2018-2032 (USD MILLION)

TABLE 106. SOUTH AMERICA: 2D MATERIALS MARKET, BY COUNTRY, 2018-2032 (IN KILOTONS)

TABLE 107. SOUTH AMERICA: 2D MATERIALS MARKET, BY MATERIAL, 2018-2032 (USD MILLION)

TABLE 108. SOUTH AMERICA: 2D MATERIALS MARKET, BY MATERIAL, 2018-2032 (IN KILOTONS)

TABLE 109. SOUTH AMERICA: 2D MATERIALS MARKET, BY APPLICATION, 2018-2032 (USD MILLION)

TABLE 110. SOUTH AMERICA: 2D MATERIALS MARKET, BY APPLICATION, 2018-2032 (IN KILOTONS)

TABLE 111. BRAZIL: 2D MATERIALS MARKET, BY MATERIAL, 2018-2032 (USD MILLION)

TABLE 112. BRAZIL: 2D MATERIALS MARKET, BY MATERIAL, 2018-2032 (IN KILOTONS)

TABLE 113. BRAZIL: 2D MATERIALS MARKET, BY APPLICATION, 2018-2032 (USD MILLION)

TABLE 114. BRAZIL: 2D MATERIALS MARKET, BY APPLICATION, 2018-2032 (IN KILOTONS)

TABLE 115. ARGENTINA: 2D MATERIALS MARKET, BY MATERIAL, 2018-2032 (USD MILLION)

TABLE 116. ARGENTINA: 2D MATERIALS MARKET, BY MATERIAL, 2018-2032 (IN KILOTONS)

TABLE 117. ARGENTINA: 2D MATERIALS MARKET, BY APPLICATION, 2018-2032 (USD MILLION)

TABLE 118. ARGENTINA: 2D MATERIALS MARKET, BY APPLICATION, 2018-2032 (IN KILOTONS)

TABLE 119. REST OF SOUTH AMERICA: 2D MATERIALS MARKET, BY COUNTRY, 2018-2032 (USD MILLION)

TABLE 120. REST OF SOUTH AMERICA: 2D MATERIALS MARKET, BY COUNTRY, 2018-2032 (IN KILOTONS)

TABLE 121. REST OF SOUTH AMERICA: 2D MATERIALS MARKET, BY MATERIAL, 2018-2032 (USD MILLION)

TABLE 122. REST OF SOUTH AMERICA: 2D MATERIALS MARKET, BY MATERIAL, 2018-2032 (IN KILOTONS)

TABLE 123. REST OF SOUTH AMERICA: 2D MATERIALS MARKET, BY APPLICATION, 2018-2032 (USD MILLION)

TABLE 124. REST OF SOUTH AMERICA: 2D MATERIALS MARKET, BY APPLICATION, 2018-2032 (IN KILOTONS)

LIST OF FIGURES

FIGURE 1. MARKET SYNOPSIS

FIGURE 2. MARKET ATTRACTIVENESS ANALYSIS: GLOBAL 2D MATERIALS MARKET

FIGURE 3. GLOBAL 2D MATERIALS MARKET ANALYSIS BY MATERIAL

FIGURE 4. GLOBAL 2D MATERIALS MARKET ANALYSIS BY APPLICATION

FIGURE 5. GLOBAL 2D MATERIALS MARKET ANALYSIS BY REGION

FIGURE 6. GLOBAL 2D MATERIALS MARKET: MARKET STRUCTURE

FIGURE 7. KEY BUYING CRITERIA OF 2D MATERIALS

FIGURE 8. RESEARCH PROCESS OF MRFR

FIGURE 9. NORTH AMERICA MARKET SIZE & MARKET SHARE BY COUNTRY (2024 VS 2032)

FIGURE 10. EUROPE MARKET SIZE & MARKET SHARE BY COUNTRY (2024 VS 2032)

FIGURE 11. ASIA-PACIFIC & MARKET SHARE BY COUNTRY (2024 VS 2032)

FIGURE 12. MIDDLE EAST & AFRICA MARKET SIZE & MARKET SHARE BY COUNTRY (2024 VS 2032)

FIGURE 13. SOUTH AMERICA MARKET SIZE & MARKET SHARE BY COUNTRY (2024 VS 2032)

FIGURE 14. DROC ANALYSIS OF GLOBAL 2D MATERIALS MARKET

FIGURE 15. DRIVERS IMPACT ANALYSIS: 2D MATERIALS MARKET

FIGURE 16. RESTRAINTS IMPACT ANALYSIS: 2D MATERIALS MARKET

FIGURE 17. SUPPLY / VALUE CHAIN: GLOBAL 2D MATERIALS MARKET

FIGURE 18. GLOBAL 2D MATERIALS MARKET, BY MATERIAL, 2023 (% SHARE)

FIGURE 19. GLOBAL 2D MATERIALS MARKET, BY MATERIAL, 2024 TO 2032 (USD MILLION)

FIGURE 20. GLOBAL 2D MATERIALS MARKET, BY MATERIAL, 2024 TO 2032 (IN KILOTONS)

FIGURE 21. GLOBAL 2D MATERIALS MARKET, BY APPLICATION, 2023 (% SHARE)

FIGURE 22. GLOBAL 2D MATERIALS MARKET, BY APPLICATION, 2024 TO 2032 (USD MILLION)

FIGURE 23. GLOBAL 2D MATERIALS MARKET, BY APPLICATION, 2024 TO 2032 (IN KILOTONS)

Purchase Option
Single User $ 4,950
Multiuser License $ 5,950
Enterprise User $ 7,250
Compare Licenses
Tailored for You
  • Dedicated Research on any specifics segment or region.
  • Focused Research on specific players in the market.
  • Custom Report based only on your requirements.
  • Flexibility to add or subtract any chapter in the study.
  • Historic data from 2014 and forecasts outlook till 2040.
  • Flexibility of providing data/insights in formats (PDF, PPT, Excel).
  • Provide cross segmentation in applicable scenario/markets.