Segmentation du marché de l'ingénierie logicielle
Perspectives d'application de l'ingénierie logicielle (milliards USD, 2018-2030)
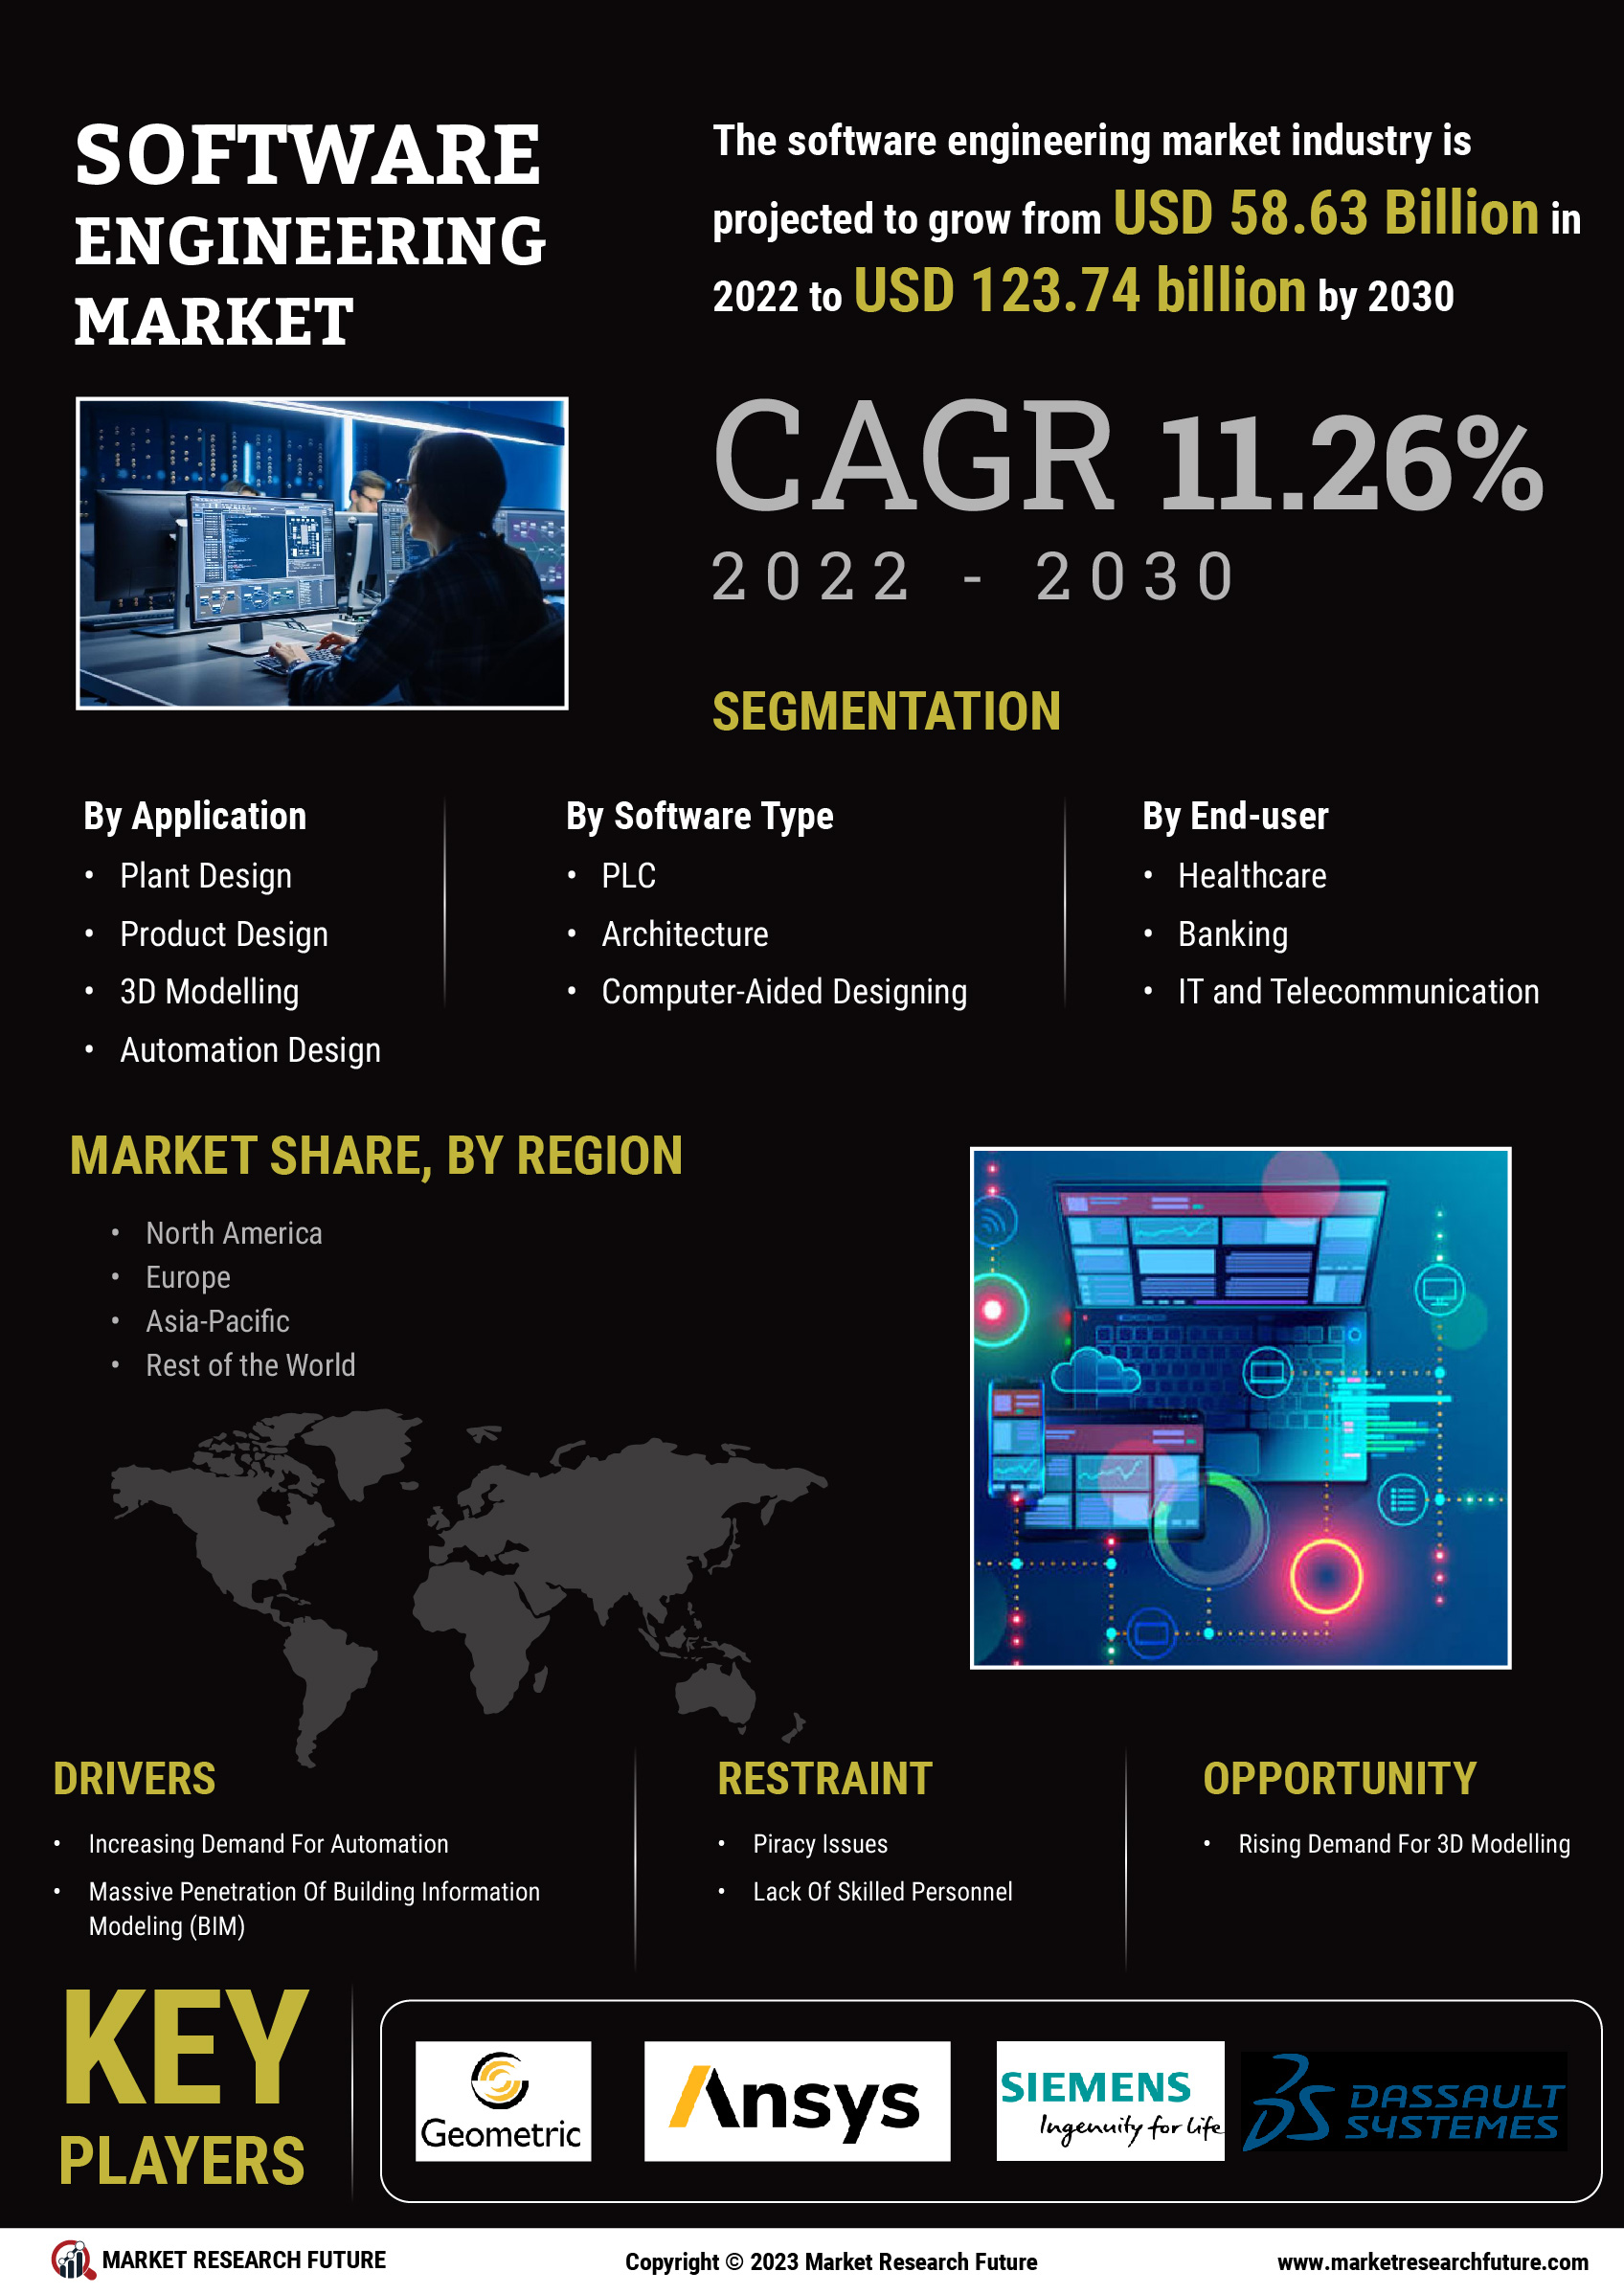
Conception d'usine
Conception de produit
Modélisation 3D
Conception d'automatisation
Perspectives de type de logiciel d'ingénierie logicielle (milliards USD, 2018-2030)
PLC
Ingénierie assistée par ordinateur
Ingénierie et construction
Architecture
Automatisation de la conception électronique
Fabrication assistée par ordinateur
Conception assistée par ordinateur
Perspectives des utilisateurs finaux de l'ingénierie logicielle (milliards USD, 2018-2030)
Santé
Banque
Aérospatiale
Pétrole et gaz
IT et télécommunications
Automobile
Défense
Perspectives régionales de l'ingénierie logicielle (milliards USD, 2018-2030)
Perspectives de l'Amérique du Nord (milliards USD, 2018-2030)
Perspectives d'application de l'ingénierie logicielle (milliards USD, 2018-2030)
Conception d'usine
Conception de produit
Modélisation 3D
Conception d'automatisation
Perspectives de type de logiciel d'ingénierie logicielle (milliards USD, 2018-2030)
PLC
Ingénierie assistée par ordinateur
Ingénierie et construction
Architecture
Automatisation de la conception électronique
Fabrication assistée par ordinateur
Conception assistée par ordinateur
Perspectives des utilisateurs finaux de l'ingénierie logicielle (milliards USD, 2018-2030)
Santé
Banque
Aérospatiale
Pétrole et gaz
IT et télécommunications
Automobile
Défense
Perspectives des États-Unis (milliards USD, 2018-2030)
Perspectives d'application de l'ingénierie logicielle (milliards USD, 2018-2030)
Conception d'usine
Conception de produit
Modélisation 3D
Conception d'automatisation
Perspectives de type de logiciel d'ingénierie logicielle (milliards USD, 2018-2030)
PLC
Ingénierie assistée par ordinateur
Ingénierie et construction
Architecture
Automatisation de la conception électronique
Fabrication assistée par ordinateur
Conception assistée par ordinateur
Perspectives des utilisateurs finaux de l'ingénierie logicielle (milliards USD, 2018-2030)
Santé
Banque
Aérospatiale
Pétrole et gaz
IT et télécommunications
Automobile
Défense
Perspectives du Canada (milliards USD, 2018-2030)
Perspectives d'application de l'ingénierie logicielle (milliards USD, 2018-2030)
Conception d'usine
Conception de produit
Modélisation 3D
Conception d'automatisation
Perspectives de type de logiciel d'ingénierie logicielle (milliards USD, 2018-2030)
PLC
Ingénierie assistée par ordinateur
Ingénierie et construction
Architecture
Automatisation de la conception électronique
Fabrication assistée par ordinateur
Conception assistée par ordinateur
Perspectives des utilisateurs finaux de l'ingénierie logicielle (milliards USD, 2018-2030)
Santé
Banque
Aérospatiale
Pétrole et gaz
IT et télécommunications
Automobile
Défense
Perspectives de l'Europe (milliards USD, 2018-2030)
Perspectives d'application de l'ingénierie logicielle (milliards USD, 2018-2030)
Conception d'usine
Conception de produit
Modélisation 3D
Conception d'automatisation
Perspectives de type de logiciel d'ingénierie logicielle (milliards USD, 2018-2030)
PLC
Ingénierie assistée par ordinateur
Ingénierie et construction
Architecture
Automatisation de la conception électronique
Fabrication assistée par ordinateur
Conception assistée par ordinateur
Perspectives des utilisateurs finaux de l'ingénierie logicielle (milliards USD, 2018-2030)
Santé
Banque
Aérospatiale
Pétrole et gaz
IT et télécommunications
Automobile
Défense
Perspectives de l'Allemagne (milliards USD, 2018-2030)
Perspectives d'application de l'ingénierie logicielle (milliards USD, 2018-2030)
Conception d'usine
Conception de produit
Modélisation 3D
Conception d'automatisation
Perspectives de type de logiciel d'ingénierie logicielle (milliards USD, 2018-2030)
PLC
Ingénierie assistée par ordinateur
Ingénierie et construction
Architecture
Automatisation de la conception électronique
Fabrication assistée par ordinateur
Conception assistée par ordinateur
Perspectives des utilisateurs finaux de l'ingénierie logicielle (milliards USD, 2018-2030)
Santé
Banque
Aérospatiale
Pétrole et gaz
IT et télécommunications
Automobile
Défense
Perspectives de la France (milliards USD, 2018-2030)
Perspectives d'application de l'ingénierie logicielle (milliards USD, 2018-2030)
Conception d'usine
Conception de produit
Modélisation 3D
Conception d'automatisation
Perspectives de type de logiciel d'ingénierie logicielle (milliards USD, 2018-2030)
PLC
Ingénierie assistée par ordinateur
Ingénierie et construction
Architecture
Automatisation de la conception électronique
Fabrication assistée par ordinateur
Conception assistée par ordinateur
Perspectives des utilisateurs finaux de l'ingénierie logicielle (milliards USD, 2018-2030)
Santé
Banque
Aérospatiale
Pétrole et gaz
IT et télécommunications
Automobile
Défense
Perspectives du Royaume-Uni (milliards USD, 2018-2030)
Perspectives d'application de l'ingénierie logicielle (milliards USD, 2018-2030)
Conception d'usine
Conception de produit
Modélisation 3D
Conception d'automatisation
Perspectives de type de logiciel d'ingénierie logicielle (milliards USD, 2018-2030)
PLC
Ingénierie assistée par ordinateur
Ingénierie et construction
Architecture
Automatisation de la conception électronique
Fabrication assistée par ordinateur
Conception assistée par ordinateur
Perspectives des utilisateurs finaux de l'ingénierie logicielle (milliards USD, 2018-2030)
Santé
Banque
Aérospatiale
Pétrole et gaz
IT et télécommunications
Automobile
Défense
Perspectives de l'Italie (milliards USD, 2018-2030)
Perspectives d'application de l'ingénierie logicielle (milliards USD, 2018-2030)
Conception d'usine
Conception de produit
Modélisation 3D
Conception d'automatisation
Perspectives de type de logiciel d'ingénierie logicielle (milliards USD, 2018-2030)
PLC
Ingénierie assistée par ordinateur
Ingénierie et construction
Architecture
Automatisation de la conception électronique
Fabrication assistée par ordinateur
Conception assistée par ordinateur
Perspectives des utilisateurs finaux de l'ingénierie logicielle (milliards USD, 2018-2030)
Santé
Banque
Aérospatiale
Pétrole et gaz
IT et télécommunications
Automobile
Défense
Perspectives de l'Espagne (milliards USD, 2018-2030)
Perspectives d'application de l'ingénierie logicielle (milliards USD, 2018-2030)
Conception d'usine
Conception de produit
Modélisation 3D
Conception d'automatisation
Perspectives de type de logiciel d'ingénierie logicielle (milliards USD, 2018-2030)
PLC
Ingénierie assistée par ordinateur
Ingénierie et construction
Architecture
Automatisation de la conception électronique
Fabrication assistée par ordinateur
Conception assistée par ordinateur
Perspectives des utilisateurs finaux de l'ingénierie logicielle (milliards USD, 2018-2030)
Santé
Banque
Aérospatiale
Pétrole et gaz
IT et télécommunications
Automobile
Défense
Perspectives du reste de l'Europe (milliards USD, 2018-2030)
Perspectives d'application de l'ingénierie logicielle (milliards USD, 2018-2030)
Conception d'usine
Conception de produit
Modélisation 3D
Conception d'automatisation
Perspectives de type de logiciel d'ingénierie logicielle (milliards USD, 2018-2030)
PLC
Ingénierie assistée par ordinateur
Ingénierie et construction
Architecture
Automatisation de la conception électronique
Fabrication assistée par ordinateur
Conception assistée par ordinateur
Perspectives des utilisateurs finaux de l'ingénierie logicielle (milliards USD, 2018-2030)
Santé
Banque
Aérospatiale
Pétrole et gaz
IT et télécommunications
Automobile
Défense
Perspectives de la région Asie-Pacifique (milliards USD, 2018-2030)
Perspectives d'application de l'ingénierie logicielle (milliards USD, 2018-2030)
Conception d'usine
Conception de produit
Modélisation 3D
Conception d'automatisation
Perspectives de type de logiciel d'ingénierie logicielle (milliards USD, 2018-2030)
PLC
Ingénierie assistée par ordinateur
Ingénierie et construction
Architecture
Automatisation de la conception électronique
Fabrication assistée par ordinateur
Conception assistée par ordinateur
Perspectives des utilisateurs finaux de l'ingénierie logicielle (milliards USD, 2018-2030)
Santé
Banque
Aérospatiale
Pétrole et gaz
IT et télécommunications
Automobile
Défense
Perspectives de la Chine (milliards USD, 2018-2030)
Perspectives d'application de l'ingénierie logicielle (milliards USD, 2018-2030)
Conception d'usine
Conception de produit
Modélisation 3D
Conception d'automatisation
Perspectives de type de logiciel d'ingénierie logicielle (milliards USD, 2018-2030)
PLC
Ingénierie assistée par ordinateur
Ingénierie et construction
Architecture
Automatisation de la conception électronique
Fabrication assistée par ordinateur
Conception assistée par ordinateur
Perspectives des utilisateurs finaux de l'ingénierie logicielle (milliards USD, 2018-2030)
Santé
Banque
Aérospatiale
Pétrole et gaz
IT et télécommunications
Automobile
Défense
Perspectives du Japon (milliards USD, 2018-2030)
Perspectives d'application de l'ingénierie logicielle (milliards USD, 2018-2030)
Conception d'usine
Conception de produit
Modélisation 3D
Conception d'automatisation
Perspectives de type de logiciel d'ingénierie logicielle (milliards USD, 2018-2030)
PLC
Ingénierie assistée par ordinateur
Ingénierie et construction
Architecture
Automatisation de la conception électronique
Fabrication assistée par ordinateur
Conception assistée par ordinateur
Perspectives des utilisateurs finaux de l'ingénierie logicielle (milliards USD, 2018-2030)
Santé
Banque
Aérospatiale
Pétrole et gaz
IT et télécommunications
Automobile
Défense
Perspectives de l'Inde (milliards USD, 2018-2030)
Perspectives d'application de l'ingénierie logicielle (milliards USD, 2018-2030)
Conception d'usine
Conception de produit
Modélisation 3D
Conception d'automatisation
Perspectives de type de logiciel d'ingénierie logicielle (milliards USD, 2018-2030)
PLC
Ingénierie assistée par ordinateur
Ingénierie et construction
Architecture
Automatisation de la conception électronique
Fabrication assistée par ordinateur
Conception assistée par ordinateur
Perspectives des utilisateurs finaux de l'ingénierie logicielle (milliards USD, 2018-2030)
Santé
Banque
Aérospatiale
Pétrole et gaz
IT et télécommunications
Automobile
Défense
Perspectives de l'Australie (milliards USD, 2018-2030)
Perspectives d'application de l'ingénierie logicielle (milliards USD, 2018-2030)
Conception d'usine
Conception de produit
Modélisation 3D
Conception d'automatisation
Perspectives de type de logiciel d'ingénierie logicielle (milliards USD, 2018-2030)
PLC
Ingénierie assistée par ordinateur
Ingénierie et construction
Architecture
Automatisation de la conception électronique
Fabrication assistée par ordinateur
Conception assistée par ordinateur
Perspectives des utilisateurs finaux de l'ingénierie logicielle (milliards USD, 2018-2030)
Santé
Banque
Aérospatiale
Pétrole et gaz
IT et télécommunications
Automobile
Défense
Perspectives du reste de la région Asie-Pacifique (milliards USD, 2018-2030)
Perspectives d'application de l'ingénierie logicielle (milliards USD, 2018-2030)
Conception d'usine
Conception de produit
Modélisation 3D
Conception d'automatisation
Perspectives de type de logiciel d'ingénierie logicielle (milliards USD, 2018-2030)
PLC
Ingénierie assistée par ordinateur
Ingénierie et construction
Architecture
Automatisation de la conception électronique
Fabrication assistée par ordinateur
Conception assistée par ordinateur
Perspectives des utilisateurs finaux de l'ingénierie logicielle (milliards USD, 2018-2030)
Santé
Banque
Aérospatiale
Pétrole et gaz
IT et télécommunications
Automobile
Défense
Perspectives du reste du monde (milliards USD, 2018-2030)
Perspectives d'application de l'ingénierie logicielle (milliards USD, 2018-2030)
Conception d'usine
Conception de produit
Modélisation 3D
Conception d'automatisation
Perspectives de type de logiciel d'ingénierie logicielle (milliards USD, 2018-2030)
PLC
Ingénierie assistée par ordinateur
Ingénierie et construction
Architecture
Automatisation de la conception électronique
Fabrication assistée par ordinateur
Conception assistée par ordinateur
Perspectives des utilisateurs finaux de l'ingénierie logicielle (milliards USD, 2018-2030)
Santé
Banque
Aérospatiale
Pétrole et gaz
IT et télécommunications
Automobile
Défense