Request Free Sample ×

Kindly complete the form below to receive a free sample of this Report

* Please use a valid business email

Leading companies partner with us for data-driven Insights

clients tt-cursor
Hero Background

Marché Power By The Hour

ID: MRFR/AD/31491-HCR
128 Pages
Triveni Bhoyar
Last Updated: May 15, 2026

Rapport d'étude de marché Power by the Hour par type de service (Service de maintenance, Service de réparation, Support opérationnel, Services de formation), par type d'équipement (Moteur à combustion interne, Turbine à gaz, Turbine à vapeur), par secteur d'utilisation finale (Aérospatial, Maritime, Industriel, Production d'énergie), par modèle d'abonnement (Modèle à coût fixe, Modèle à coût variable, Modèle à coût mixte) et par région (Amérique du Nord, Europe, Amérique du Sud, Asie-Pacifique, Moyen-Orient et Afrique) - Prévisions jusqu'en 2035.

Partager
Download PDF ×

We do not share your information with anyone. However, we may send you emails based on your report interest from time to time. You may contact us at any time to opt-out.

  1. TABLE DES MATIÈRES
  2. 1. RÉSUMÉ EXÉCUTIF
  3. 1.1. Aperçu du marché
  4. 1.2. Principales conclusions
  5. 1.3. Segmentation du marché
  6. 1.4. Paysage concurrentiel
  7. 1.5. Défis et opportunités
  8. 1.6. Perspectives d'avenir
  9. 2. INTRODUCTION AU MARCHÉ
  10. 2.1. Définition
  11. 2.2. Portée de l'étude
  12. 2.2.1. Objectif de la recherche
  13. 2.2.2. Hypothèse
  14. 2.2.3. Limitations
  15. 3. MÉTHODOLOGIE DE RECHERCHE
  16. 3.1. Aperçu
  17. 3.2. Exploration de données
  18. 3.3. Recherche secondaire
  19. 3.4. Recherche primaire
  20. 3.4.1. Interviews primaires et processus de collecte d'informations
  21. 3.4.2. Répartition des répondants principaux
  22. 3.5. Modèle de prévision
  23. 3.6. Estimation de la taille du marché
  24. 3.6.1. Approche ascendante
  25. 3.6.2. Approche descendante
  26. 3.7. Triangulation des données
  27. 3.8. Validation
  28. 4. DYNAMIQUE DU MARCHÉ
  29. 4.1. Aperçu
  30. 4.2. Facteurs moteurs
  31. 4.3. Contraintes
  32. 4.4. Opportunités
  33. 5. ANALYSE DES FACTEURS DU MARCHÉ
  34. 5.1. Analyse de la chaîne de valeur
  35. 5.2. Analyse des cinq forces de Porter
  36. 5.2.1. Pouvoir de négociation des fournisseurs
  37. 5.2.2. Pouvoir de négociation des acheteurs
  38. 5.2.3. Menace des nouveaux entrants
  39. 5.2.4. Menace des substituts
  40. 5.2.5. Intensité de la rivalité
  41. 5.3. Analyse de l'impact du COVID-19
  42. 5.3.1. Analyse de l'impact sur le marché
  43. 5.3.2. Impact régional
  44. 5.3.3. Analyse des opportunités et des menaces
  45. 6. MARCHÉ DE LA PUISSANCE À L'HEURE, PAR TYPE DE SERVICE (MILLIARDS USD)
  46. 6.1. Service de maintenance
  47. 6.2. Service de réparation
  48. 6.3. Support opérationnel
  49. 6.4. Services de formation
  50. 7. MARCHÉ DE LA PUISSANCE À L'HEURE, PAR TYPE D'ÉQUIPEMENT (MILLIARDS USD)
  51. 7.1. Moteur à combustion interne
  52. 7.2. Turbine à gaz
  53. 7.3. Turbine à vapeur
  54. 8. MARCHÉ DE LA PUISSANCE À L'HEURE, PAR INDUSTRIE UTILISATRICE FINALE (MILLIARDS USD)
  55. 8.1. Aérospatiale
  56. 8.2. Maritime
  57. 8.3. Industriel
  58. 8.4. Production d'énergie
  59. 9. MARCHÉ DE LA PUISSANCE À L'HEURE, PAR MODÈLE D'ABONNEMENT (MILLIARDS USD)
  60. 9.1. Modèle de coût fixe
  61. 9.2. Modèle de coût variable
  62. 9.3. Modèle de coût mixte
  63. 10. MARCHÉ DE LA PUISSANCE À L'HEURE, PAR RÉGION (MILLIARDS USD)
  64. 10.1. Amérique du Nord
  65. 10.1.1. États-Unis
  66. 10.1.2. Canada
  67. 10.2. Europe
  68. 10.2.1. Allemagne
  69. 10.2.2. Royaume-Uni
  70. 10.2.3. France
  71. 10.2.4. Russie
  72. 10.2.5. Italie
  73. 10.2.6. Espagne
  74. 10.2.7. Reste de l'Europe
  75. 10.3. APAC
  76. 10.3.1. Chine
  77. 10.3.2. Inde
  78. 10.3.3. Japon
  79. 10.3.4. Corée du Sud
  80. 10.3.5. Malaisie
  81. 10.3.6. Thaïlande
  82. 10.3.7. Indonésie
  83. 10.3.8. Reste de l'APAC
  84. 10.4. Amérique du Sud
  85. 10.4.1. Brésil
  86. 10.4.2. Mexique
  87. 10.4.3. Argentine
  88. 10.4.4. Reste de l'Amérique du Sud
  89. 10.5. MEA
  90. 10.5.1. Pays du CCG
  91. 10.5.2. Afrique du Sud
  92. 10.5.3. Reste de la MEA
  93. 11. PAYSAGE CONCURRENTIEL
  94. 11.1. Aperçu
  95. 11.2. Analyse concurrentielle
  96. 11.3. Analyse de la part de marché
  97. 11.4. Principale stratégie de croissance sur le marché de la puissance à l'heure
  98. 11.5. Évaluation comparative des concurrents
  99. 11.6. Acteurs principaux en termes de nombre de développements sur le marché de la puissance à l'heure
  100. 11.7. Principaux développements et stratégies de croissance
  101. 11.7.1. Lancement de nouveaux produits / Déploiement de services
  102. 11.7.2. Fusions et acquisitions
  103. 11.7.3. Coentreprises
  104. 11.8. Matrice financière des principaux acteurs
  105. 11.8.1. Ventes et résultat d'exploitation
  106. 11.8.2. Dépenses de R&D des principaux acteurs. 2023
  107. 12. PROFILS D'ENTREPRISES
  108. 12.1. Safran
  109. 12.1.1. Aperçu financier
  110. 12.1.2. Produits offerts
  111. 12.1.3. Principaux développements
  112. 12.1.4. Analyse SWOT
  113. 12.1.5. Stratégies clés
  114. 12.2. Babcock International
  115. 12.2.1. Aperçu financier
  116. 12.2.2. Produits offerts
  117. 12.2.3. Principaux développements
  118. 12.2.4. Analyse SWOT
  119. 12.2.5. Stratégies clés
  120. 12.3. Leonardo
  121. 12.3.1. Aperçu financier
  122. 12.3.2. Produits offerts
  123. 12.3.3. Principaux développements
  124. 12.3.4. Analyse SWOT
  125. 12.3.5. Stratégies clés
  126. 12.4. Honeywell
  127. 12.4.1. Aperçu financier
  128. 12.4.2. Produits offerts
  129. 12.4.3. Principaux développements
  130. 12.4.4. Analyse SWOT
  131. 12.4.5. Stratégies clés
  132. 12.5. RollsRoyce
  133. 12.5.1. Aperçu financier
  134. 12.5.2. Produits offerts
  135. 12.5.3. Principaux développements
  136. 12.5.4. Analyse SWOT
  137. 12.5.5. Stratégies clés
  138. 12.6. Airbus
  139. 12.6.1. Aperçu financier
  140. 12.6.2. Produits offerts
  141. 12.6.3. Principaux développements
  142. 12.6.4. Analyse SWOT
  143. 12.6.5. Stratégies clés
  144. 12.7. Siemens
  145. 12.7.1. Aperçu financier
  146. 12.7.2. Produits offerts
  147. 12.7.3. Principaux développements
  148. 12.7.4. Analyse SWOT
  149. 12.7.5. Stratégies clés
  150. 12.8. General Electric
  151. 12.8.1. Aperçu financier
  152. 12.8.2. Produits offerts
  153. 12.8.3. Principaux développements
  154. 12.8.4. Analyse SWOT
  155. 12.8.5. Stratégies clés
  156. 12.9. Pratt and Whitney
  157. 12.9.1. Aperçu financier
  158. 12.9.2. Produits offerts
  159. 12.9.3. Principaux développements
  160. 12.9.4. Analyse SWOT
  161. 12.9.5. Stratégies clés
  162. 12.10. Mitsubishi Heavy Industries
  163. 12.10.1. Aperçu financier
  164. 12.10.2. Produits offerts
  165. 12.10.3. Principaux développements
  166. 12.10.4. Analyse SWOT
  167. 12.10.5. Stratégies clés
  168. 12.11. Boeing
  169. 12.11.1. Aperçu financier
  170. 12.11.2. Produits offerts
  171. 12.11.3. Principaux développements
  172. 12.11.4. Analyse SWOT
  173. 12.11.5. Stratégies clés
  174. 12.12. Kawasaki Heavy Industries
  175. 12.12.1. Aperçu financier
  176. 12.12.2. Produits offerts
  177. 12.12.3. Principaux développements
  178. 12.12.4. Analyse SWOT
  179. 12.12.5. Stratégies clés
  180. 12.13. MTU Aero Engines
  181. 12.13.1. Aperçu financier
  182. 12.13.2. Produits offerts
  183. 12.13.3. Principaux développements
  184. 12.13.4. Analyse SWOT
  185. 12.13.5. Stratégies clés
  186. 12.14. Sulzer
  187. 12.14.1. Aperçu financier
  188. 12.14.2. Produits offerts
  189. 12.14.3. Principaux développements
  190. 12.14.4. Analyse SWOT
  191. 12.14.5. Stratégies clés
  192. 12.15. United Technologies
  193. 12.15.1. Aperçu financier
  194. 12.15.2. Produits offerts
  195. 12.15.3. Principaux développements
  196. 12.15.4. Analyse SWOT
  197. 12.15.5. Stratégies clés
  198. 13. ANNEXE
  199. 13.1. Références
  200. 13.2. Rapports connexes
  201. LISTE DES TABLEAUX
  202. TABLEAU 1. LISTE DES HYPOTHÈSES
  203. TABLEAU 2. ESTIMATIONS ET PRÉVISIONS DE LA TAILLE DU MARCHÉ DE LA PUISSANCE À L'HEURE EN AMÉRIQUE DU NORD, PAR TYPE DE SERVICE, 2019-2032 (MILLIARDS USD)
  204. TABLEAU 3. ESTIMATIONS ET PRÉVISIONS DE LA TAILLE DU MARCHÉ DE LA PUISSANCE À L'HEURE EN AMÉRIQUE DU NORD, PAR TYPE D'ÉQUIPEMENT, 2019-2032 (MILLIARDS USD)
  205. TABLEAU 4. ESTIMATIONS ET PRÉVISIONS DE LA TAILLE DU MARCHÉ DE LA PUISSANCE À L'HEURE EN AMÉRIQUE DU NORD, PAR INDUSTRIE UTILISATRICE FINALE, 2019-2032 (MILLIARDS USD)
  206. TABLEAU 5. ESTIMATIONS ET PRÉVISIONS DE LA TAILLE DU MARCHÉ DE LA PUISSANCE À L'HEURE EN AMÉRIQUE DU NORD, PAR MODÈLE D'ABONNEMENT, 2019-2032 (MILLIARDS USD)
  207. TABLEAU 6. ESTIMATIONS ET PRÉVISIONS DE LA TAILLE DU MARCHÉ DE LA PUISSANCE À L'HEURE EN AMÉRIQUE DU NORD, PAR RÉGION, 2019-2032 (MILLIARDS USD)
  208. TABLEAU 7. ESTIMATIONS ET PRÉVISIONS DE LA TAILLE DU MARCHÉ DE LA PUISSANCE À L'HEURE AUX ÉTATS-UNIS, PAR TYPE DE SERVICE, 2019-2032 (MILLIARDS USD)
  209. TABLEAU 8. ESTIMATIONS ET PRÉVISIONS DE LA TAILLE DU MARCHÉ DE LA PUISSANCE À L'HEURE AUX ÉTATS-UNIS, PAR TYPE D'ÉQUIPEMENT, 2019-2032 (MILLIARDS USD)
  210. TABLEAU 9. ESTIMATIONS ET PRÉVISIONS DE LA TAILLE DU MARCHÉ DE LA PUISSANCE À L'HEURE AUX ÉTATS-UNIS, PAR INDUSTRIE UTILISATRICE FINALE, 2019-2032 (MILLIARDS USD)
  211. TABLEAU 10. ESTIMATIONS ET PRÉVISIONS DE LA TAILLE DU MARCHÉ DE LA PUISSANCE À L'HEURE AUX ÉTATS-UNIS, PAR MODÈLE D'ABONNEMENT, 2019-2032 (MILLIARDS USD)
  212. TABLEAU 11. ESTIMATIONS ET PRÉVISIONS DE LA TAILLE DU MARCHÉ DE LA PUISSANCE À L'HEURE AUX ÉTATS-UNIS, PAR RÉGION, 2019-2032 (MILLIARDS USD)
  213. TABLEAU 12. ESTIMATIONS ET PRÉVISIONS DE LA TAILLE DU MARCHÉ DE LA PUISSANCE À L'HEURE AU CANADA, PAR TYPE DE SERVICE, 2019-2032 (MILLIARDS USD)
  214. TABLEAU 13. ESTIMATIONS ET PRÉVISIONS DE LA TAILLE DU MARCHÉ DE LA PUISSANCE À L'HEURE AU CANADA, PAR TYPE D'ÉQUIPEMENT, 2019-2032 (MILLIARDS USD)
  215. TABLEAU 14. ESTIMATIONS ET PRÉVISIONS DE LA TAILLE DU MARCHÉ DE LA PUISSANCE À L'HEURE AU CANADA, PAR INDUSTRIE UTILISATRICE FINALE, 2019-2032 (MILLIARDS USD)
  216. TABLEAU 15. ESTIMATIONS ET PRÉVISIONS DE LA TAILLE DU MARCHÉ DE LA PUISSANCE À L'HEURE AU CANADA, PAR MODÈLE D'ABONNEMENT, 2019-2032 (MILLIARDS USD)
  217. TABLEAU 16. ESTIMATIONS ET PRÉVISIONS DE LA TAILLE DU MARCHÉ DE LA PUISSANCE À L'HEURE AU CANADA, PAR RÉGION, 2019-2032 (MILLIARDS USD)
  218. TABLEAU 17. ESTIMATIONS ET PRÉVISIONS DE LA TAILLE DU MARCHÉ DE LA PUISSANCE À L'HEURE EN EUROPE, PAR TYPE DE SERVICE, 2019-2032 (MILLIARDS USD)
  219. TABLEAU 18. ESTIMATIONS ET PRÉVISIONS DE LA TAILLE DU MARCHÉ DE LA PUISSANCE À L'HEURE EN EUROPE, PAR TYPE D'ÉQUIPEMENT, 2019-2032 (MILLIARDS USD)
  220. TABLEAU 19. ESTIMATIONS ET PRÉVISIONS DE LA TAILLE DU MARCHÉ DE LA PUISSANCE À L'HEURE EN EUROPE, PAR INDUSTRIE UTILISATRICE FINALE, 2019-2032 (MILLIARDS USD)
  221. TABLEAU 20. ESTIMATIONS ET PRÉVISIONS DE LA TAILLE DU MARCHÉ DE LA PUISSANCE À L'HEURE EN EUROPE, PAR MODÈLE D'ABONNEMENT, 2019-2032 (MILLIARDS USD)
  222. TABLEAU 21. ESTIMATIONS ET PRÉVISIONS DE LA TAILLE DU MARCHÉ DE LA PUISSANCE À L'HEURE EN EUROPE, PAR RÉGION, 2019-2032 (MILLIARDS USD)
  223. TABLEAU 22. ESTIMATIONS ET PRÉVISIONS DE LA TAILLE DU MARCHÉ DE LA PUISSANCE À L'HEURE EN ALLEMAGNE, PAR TYPE DE SERVICE, 2019-2032 (MILLIARDS USD)
  224. TABLEAU 23. ESTIMATIONS ET PRÉVISIONS DE LA TAILLE DU MARCHÉ DE LA PUISSANCE À L'HEURE EN ALLEMAGNE, PAR TYPE D'ÉQUIPEMENT, 2019-2032 (MILLIARDS USD)
  225. TABLEAU 24. ESTIMATIONS ET PRÉVISIONS DE LA TAILLE DU MARCHÉ DE LA PUISSANCE À L'HEURE EN ALLEMAGNE, PAR INDUSTRIE UTILISATRICE FINALE, 2019-2032 (MILLIARDS USD)
  226. TABLEAU 25. ESTIMATIONS ET PRÉVISIONS DE LA TAILLE DU MARCHÉ DE LA PUISSANCE À L'HEURE EN ALLEMAGNE, PAR MODÈLE D'ABONNEMENT, 2019-2032 (MILLIARDS USD)
  227. TABLEAU 26. ESTIMATIONS ET PRÉVISIONS DE LA TAILLE DU MARCHÉ DE LA PUISSANCE À L'HEURE EN ALLEMAGNE, PAR RÉGION, 2019-2032 (MILLIARDS USD)
  228. TABLEAU 27. ESTIMATIONS ET PRÉVISIONS DE LA TAILLE DU MARCHÉ DE LA PUISSANCE À L'HEURE AU ROYAUME-UNI, PAR TYPE DE SERVICE, 2019-2032 (MILLIARDS USD)
  229. TABLEAU 28. ESTIMATIONS ET PRÉVISIONS DE LA TAILLE DU MARCHÉ DE LA PUISSANCE À L'HEURE AU ROYAUME-UNI, PAR TYPE D'ÉQUIPEMENT, 2019-2032 (MILLIARDS USD)
  230. TABLEAU 29. ESTIMATIONS ET PRÉVISIONS DE LA TAILLE DU MARCHÉ DE LA PUISSANCE À L'HEURE AU ROYAUME-UNI, PAR INDUSTRIE UTILISATRICE FINALE, 2019-2032 (MILLIARDS USD)
  231. TABLEAU 30. ESTIMATIONS ET PRÉVISIONS DE LA TAILLE DU MARCHÉ DE LA PUISSANCE À L'HEURE AU ROYAUME-UNI, PAR MODÈLE D'ABONNEMENT, 2019-2032 (MILLIARDS USD)
  232. TABLEAU 31. ESTIMATIONS ET PRÉVISIONS DE LA TAILLE DU MARCHÉ DE LA PUISSANCE À L'HEURE AU ROYAUME-UNI, PAR RÉGION, 2019-2032 (MILLIARDS USD)
  233. TABLEAU 32. ESTIMATIONS ET PRÉVISIONS DE LA TAILLE DU MARCHÉ DE LA PUISSANCE À L'HEURE EN FRANCE, PAR TYPE DE SERVICE, 2019-2032 (MILLIARDS USD)
  234. TABLEAU 33. ESTIMATIONS ET PRÉVISIONS DE LA TAILLE DU MARCHÉ DE LA PUISSANCE À L'HEURE EN FRANCE, PAR TYPE D'ÉQUIPEMENT, 2019-2032 (MILLIARDS USD)
  235. TABLEAU 34. ESTIMATIONS ET PRÉVISIONS DE LA TAILLE DU MARCHÉ DE LA PUISSANCE À L'HEURE EN FRANCE, PAR INDUSTRIE UTILISATRICE FINALE, 2019-2032 (MILLIARDS USD)
  236. TABLEAU 35. ESTIMATIONS ET PRÉVISIONS DE LA TAILLE DU MARCHÉ DE LA PUISSANCE À L'HEURE EN FRANCE, PAR MODÈLE D'ABONNEMENT, 2019-2032 (MILLIARDS USD)
  237. TABLEAU 36. ESTIMATIONS ET PRÉVISIONS DE LA TAILLE DU MARCHÉ DE LA PUISSANCE À L'HEURE EN FRANCE, PAR RÉGION, 2019-2032 (MILLIARDS USD)
  238. TABLEAU 37. ESTIMATIONS ET PRÉVISIONS DE LA TAILLE DU MARCHÉ DE LA PUISSANCE À L'HEURE EN RUSSIE, PAR TYPE DE SERVICE, 2019-2032 (MILLIARDS USD)
  239. TABLEAU 38. ESTIMATIONS ET PRÉVISIONS DE LA TAILLE DU MARCHÉ DE LA PUISSANCE À L'HEURE EN RUSSIE, PAR TYPE D'ÉQUIPEMENT, 2019-2032 (MILLIARDS USD)
  240. TABLEAU 39. ESTIMATIONS ET PRÉVISIONS DE LA TAILLE DU MARCHÉ DE LA PUISSANCE À L'HEURE EN RUSSIE, PAR INDUSTRIE UTILISATRICE FINALE, 2019-2032 (MILLIARDS USD)
  241. TABLEAU 40. ESTIMATIONS ET PRÉVISIONS DE LA TAILLE DU MARCHÉ DE LA PUISSANCE À L'HEURE EN RUSSIE, PAR MODÈLE D'ABONNEMENT, 2019-2032 (MILLIARDS USD)
  242. TABLEAU 41. ESTIMATIONS ET PRÉVISIONS DE LA TAILLE DU MARCHÉ DE LA PUISSANCE À L'HEURE EN RUSSIE, PAR RÉGION, 2019-2032 (MILLIARDS USD)
  243. TABLEAU 42. ESTIMATIONS ET PRÉVISIONS DE LA TAILLE DU MARCHÉ DE LA PUISSANCE À L'HEURE EN ITALIE, PAR TYPE DE SERVICE, 2019-2032 (MILLIARDS USD)
  244. TABLEAU 43. ESTIMATIONS ET PRÉVISIONS DE LA TAILLE DU MARCHÉ DE LA PUISSANCE À L'HEURE EN ITALIE, PAR TYPE D'ÉQUIPEMENT, 2019-2032 (MILLIARDS USD)
  245. TABLEAU 44. ESTIMATIONS ET PRÉVISIONS DE LA TAILLE DU MARCHÉ DE LA PUISSANCE À L'HEURE EN ITALIE, PAR INDUSTRIE UTILISATRICE FINALE, 2019-2032 (MILLIARDS USD)
  246. TABLEAU 45. ESTIMATIONS ET PRÉVISIONS DE LA TAILLE DU MARCHÉ DE LA PUISSANCE À L'HEURE EN ITALIE, PAR MODÈLE D'ABONNEMENT, 2019-2032 (MILLIARDS USD)
  247. TABLEAU 46. ESTIMATIONS ET PRÉVISIONS DE LA TAILLE DU MARCHÉ DE LA PUISSANCE À L'HEURE EN ITALIE, PAR RÉGION, 2019-2032 (MILLIARDS USD)
  248. TABLEAU 47. ESTIMATIONS ET PRÉVISIONS DE LA TAILLE DU MARCHÉ DE LA PUISSANCE À L'HEURE EN ESPAGNE, PAR TYPE DE SERVICE, 2019-2032 (MILLIARDS USD)
  249. TABLEAU 48. ESTIMATIONS ET PRÉVISIONS DE LA TAILLE DU MARCHÉ DE LA PUISSANCE À L'HEURE EN ESPAGNE, PAR TYPE D'ÉQUIPEMENT, 2019-2032 (MILLIARDS USD)
  250. TABLEAU 49. ESTIMATIONS ET PRÉVISIONS DE LA TAILLE DU MARCHÉ DE LA PUISSANCE À L'HEURE EN ESPAGNE, PAR INDUSTRIE UTILISATRICE FINALE, 2019-2032 (MILLIARDS USD)
  251. TABLEAU 50. ESTIMATIONS ET PRÉVISIONS DE LA TAILLE DU MARCHÉ DE LA PUISSANCE À L'HEURE EN ESPAGNE, PAR MODÈLE D'ABONNEMENT, 2019-2032 (MILLIARDS USD)
  252. TABLEAU 51. ESTIMATIONS ET PRÉVISIONS DE LA TAILLE DU MARCHÉ DE LA PUISSANCE À L'HEURE EN ESPAGNE, PAR RÉGION, 2019-2032 (MILLIARDS USD)
  253. TABLEAU 52. ESTIMATIONS ET PRÉVISIONS DE LA TAILLE DU MARCHÉ DE LA PUISSANCE À L'HEURE DANS LE RESTE DE L'EUROPE, PAR TYPE DE SERVICE, 2019-2032 (MILLIARDS USD)
  254. TABLEAU 53. ESTIMATIONS ET PRÉVISIONS DE LA TAILLE DU MARCHÉ DE LA PUISSANCE À L'HEURE DANS LE RESTE DE L'EUROPE, PAR TYPE D'ÉQUIPEMENT, 2019-2032 (MILLIARDS USD)
  255. TABLEAU 54. ESTIMATIONS ET PRÉVISIONS DE LA TAILLE DU MARCHÉ DE LA PUISSANCE À L'HEURE DANS LE RESTE DE L'EUROPE, PAR INDUSTRIE UTILISATRICE FINALE, 2019-2032 (MILLIARDS USD)
  256. TABLEAU 55. ESTIMATIONS ET PRÉVISIONS DE LA TAILLE DU MARCHÉ DE LA PUISSANCE À L'HEURE DANS LE RESTE DE L'EUROPE, PAR MODÈLE D'ABONNEMENT, 2019-2032 (MILLIARDS USD)
  257. TABLEAU 56. ESTIMATIONS ET PRÉVISIONS DE LA TAILLE DU MARCHÉ DE LA PUISSANCE À L'HEURE DANS LE RESTE DE L'EUROPE, PAR RÉGION, 2019-2032 (MILLIARDS USD)
  258. TABLEAU 57. ESTIMATIONS ET PRÉVISIONS DE LA TAILLE DU MARCHÉ DE LA PUISSANCE À L'HEURE EN APAC, PAR TYPE DE SERVICE, 2019-2032 (MILLIARDS USD)
  259. TABLEAU 58. ESTIMATIONS ET PRÉVISIONS DE LA TAILLE DU MARCHÉ DE LA PUISSANCE À L'HEURE EN APAC, PAR TYPE D'ÉQUIPEMENT, 2019-2032 (MILLIARDS USD)
  260. TABLEAU 59. ESTIMATIONS ET PRÉVISIONS DE LA TAILLE DU MARCHÉ DE LA PUISSANCE À L'HEURE EN APAC, PAR INDUSTRIE UTILISATRICE FINALE, 2019-2032 (MILLIARDS USD)
  261. TABLEAU 60. ESTIMATIONS ET PRÉVISIONS DE LA TAILLE DU MARCHÉ DE LA PUISSANCE À L'HEURE EN APAC, PAR MODÈLE D'ABONNEMENT, 2019-2032 (MILLIARDS USD)
  262. TABLEAU 61. ESTIMATIONS ET PRÉVISIONS DE LA TAILLE DU MARCHÉ DE LA PUISSANCE À L'HEURE EN APAC, PAR RÉGION, 2019-2032 (MILLIARDS USD)
  263. TABLEAU 62. ESTIMATIONS ET PRÉVISIONS DE LA TAILLE DU MARCHÉ DE LA PUISSANCE À L'HEURE EN CHINE, PAR TYPE DE SERVICE, 2019-2032 (MILLIARDS USD)
  264. TABLEAU 63. ESTIMATIONS ET PRÉVISIONS DE LA TAILLE DU MARCHÉ DE LA PUISSANCE À L'HEURE EN CHINE, PAR TYPE D'ÉQUIPEMENT, 2019-2032 (MILLIARDS USD)
  265. TABLEAU 64. ESTIMATIONS ET PRÉVISIONS DE LA TAILLE DU MARCHÉ DE LA PUISSANCE À L'HEURE EN CHINE, PAR INDUSTRIE UTILISATRICE FINALE, 2019-2032 (MILLIARDS USD)
  266. TABLEAU 65. ESTIMATIONS ET PRÉVISIONS DE LA TAILLE DU MARCHÉ DE LA PUISSANCE À L'HEURE EN CHINE, PAR MODÈLE D'ABONNEMENT, 2019-2032 (MILLIARDS USD)
  267. TABLEAU 66. ESTIMATIONS ET PRÉVISIONS DE LA TAILLE DU MARCHÉ DE LA PUISSANCE À L'HEURE EN CHINE, PAR RÉGION, 2019-2032 (MILLIARDS USD)
  268. TABLEAU 67. ESTIMATIONS ET PRÉVISIONS DE LA TAILLE DU MARCHÉ DE LA PUISSANCE À L'HEURE EN INDE, PAR TYPE DE SERVICE, 2019-2032 (MILLIARDS USD)
  269. TABLEAU 68. ESTIMATIONS ET PRÉVISIONS DE LA TAILLE DU MARCHÉ DE LA PUISSANCE À L'HEURE EN INDE, PAR TYPE D'ÉQUIPEMENT, 2019-2032 (MILLIARDS USD)
  270. TABLEAU 69. ESTIMATIONS ET PRÉVISIONS DE LA TAILLE DU MARCHÉ DE LA PUISSANCE À L'HEURE EN INDE, PAR INDUSTRIE UTILISATRICE FINALE, 2019-2032 (MILLIARDS USD)
  271. TABLEAU 70. ESTIMATIONS ET PRÉVISIONS DE LA TAILLE DU MARCHÉ DE LA PUISSANCE À L'HEURE EN INDE, PAR MODÈLE D'ABONNEMENT, 2019-2032 (MILLIARDS USD)
  272. TABLEAU 71. ESTIMATIONS ET PRÉVISIONS DE LA TAILLE DU MARCHÉ DE LA PUISSANCE À L'HEURE EN INDE, PAR RÉGION, 2019-2032 (MILLIARDS USD)
  273. TABLEAU 72. ESTIMATIONS ET PRÉVISIONS DE LA TAILLE DU MARCHÉ DE LA PUISSANCE À L'HEURE AU JAPON, PAR TYPE DE SERVICE, 2019-2032 (MILLIARDS USD)
  274. TABLEAU 73. ESTIMATIONS ET PRÉVISIONS DE LA TAILLE DU MARCHÉ DE LA PUISSANCE À L'HEURE AU JAPON, PAR TYPE D'ÉQUIPEMENT, 2019-2032 (MILLIARDS USD)
  275. TABLEAU 74. ESTIMATIONS ET PRÉVISIONS DE LA TAILLE DU MARCHÉ DE LA PUISSANCE À L'HEURE AU JAPON, PAR INDUSTRIE UTILISATRICE FINALE, 2019-2032 (MILLIARDS USD)
  276. TABLEAU 75. ESTIMATIONS ET PRÉVISIONS DE LA TAILLE DU MARCHÉ DE LA PUISSANCE À L'HEURE AU JAPON, PAR MODÈLE D'ABONNEMENT, 2019-2032 (MILLIARDS USD)
  277. TABLEAU 76. ESTIMATIONS ET PRÉVISIONS DE LA TAILLE DU MARCHÉ DE LA PUISSANCE À L'HEURE AU JAPON, PAR RÉGION, 2019-2032 (MILLIARDS USD)
  278. TABLEAU 77. ESTIMATIONS ET PRÉVISIONS DE LA TAILLE DU MARCHÉ DE LA PUISSANCE À L'HEURE EN CORÉE DU SUD, PAR TYPE DE SERVICE, 2019-2032 (MILLIARDS USD)
  279. TABLEAU 78. ESTIMATIONS ET PRÉVISIONS DE LA TAILLE DU MARCHÉ DE LA PUISSANCE À L'HEURE EN CORÉE DU SUD, PAR TYPE D'ÉQUIPEMENT, 2019-2032 (MILLIARDS USD)
  280. TABLEAU 79. ESTIMATIONS ET PRÉVISIONS DE LA TAILLE DU MARCHÉ DE LA PUISSANCE À L'HEURE EN CORÉE DU SUD, PAR INDUSTRIE UTILISATRICE FINALE, 2019-2032 (MILLIARDS USD)
  281. TABLEAU 80. ESTIMATIONS ET PRÉVISIONS DE LA TAILLE DU MARCHÉ DE LA PUISSANCE À L'HEURE EN CORÉE DU SUD, PAR MODÈLE D'ABONNEMENT, 2019-2032 (MILLIARDS USD)
  282. TABLEAU 81. ESTIMATIONS ET PRÉVISIONS DE LA TAILLE DU MARCHÉ DE LA PUISSANCE À L'HEURE EN CORÉE DU SUD, PAR RÉGION, 2019-2032 (MILLIARDS USD)
  283. TABLEAU 82. ESTIMATIONS ET PRÉVISIONS DE LA TAILLE DU MARCHÉ DE LA PUISSANCE À L'HEURE EN MALAYSIE, PAR TYPE DE SERVICE, 2019-2032 (MILLIARDS USD)
  284. TABLEAU 83. ESTIMATIONS ET PRÉVISIONS DE LA TAILLE DU MARCHÉ DE LA PUISSANCE À L'HEURE EN MALAYSIE, PAR TYPE D'ÉQUIPEMENT, 2019-2032 (MILLIARDS USD)
  285. TABLEAU 84. ESTIMATIONS ET PRÉVISIONS DE LA TAILLE DU MARCHÉ DE LA PUISSANCE À L'HEURE EN MALAYSIE, PAR INDUSTRIE UTILISATRICE FINALE, 2019-2032 (MILLIARDS USD)
  286. TABLEAU 85. ESTIMATIONS ET PRÉVISIONS DE LA TAILLE DU MARCHÉ DE LA PUISSANCE À L'HEURE EN MALAYSIE, PAR MODÈLE D'ABONNEMENT, 2019-2032 (MILLIARDS USD)
  287. TABLEAU 86. ESTIMATIONS ET PRÉVISIONS DE LA TAILLE DU MARCHÉ DE LA PUISSANCE À L'HEURE EN MALAYSIE, PAR RÉGION, 2019-2032 (MILLIARDS USD)
  288. TABLEAU 87. ESTIMATIONS ET PRÉVISIONS DE LA TAILLE DU MARCHÉ DE LA PUISSANCE À L'HEURE EN THAÏLANDE, PAR TYPE DE SERVICE, 2019-2032 (MILLIARDS USD)
  289. TABLEAU 88. ESTIMATIONS ET PRÉVISIONS DE LA TAILLE DU MARCHÉ DE LA PUISSANCE À L'HEURE EN THAÏLANDE, PAR TYPE D'ÉQUIPEMENT, 2019-2032 (MILLIARDS USD)
  290. TABLEAU 89. ESTIMATIONS ET PRÉVISIONS DE LA TAILLE DU MARCHÉ DE LA PUISSANCE À L'HEURE EN THAÏLANDE, PAR INDUSTRIE UTILISATRICE FINALE, 2019-2032 (MILLIARDS USD)
  291. TABLEAU 90. ESTIMATIONS ET PRÉVISIONS DE LA TAILLE DU MARCHÉ DE LA PUISSANCE À L'HEURE EN THAÏLANDE, PAR MODÈLE D'ABONNEMENT, 2019-2032 (MILLIARDS USD)
  292. TABLEAU 91. ESTIMATIONS ET PRÉVISIONS DE LA TAILLE DU MARCHÉ DE LA PUISSANCE À L'HEURE EN THAÏLANDE, PAR RÉGION, 2019-2032 (MILLIARDS USD)
  293. TABLEAU 92. ESTIMATIONS ET PRÉVISIONS DE LA TAILLE DU MARCHÉ DE LA PUISSANCE À L'HEURE EN INDONÉSIE, PAR TYPE DE SERVICE, 2019-2032 (MILLIARDS USD)
  294. TABLEAU 93. ESTIMATIONS ET PRÉVISIONS DE LA TAILLE DU MARCHÉ DE LA PUISSANCE À L'HEURE EN INDONÉSIE, PAR TYPE D'ÉQUIPEMENT, 2019-2032 (MILLIARDS USD)
  295. TABLEAU 94. ESTIMATIONS ET PRÉVISIONS DE LA TAILLE DU MARCHÉ DE LA PUISSANCE À L'HEURE EN INDONÉSIE, PAR INDUSTRIE UTILISATRICE FINALE, 2019-2032 (MILLIARDS USD)
  296. TABLEAU 95. ESTIMATIONS ET PRÉVISIONS DE LA TAILLE DU MARCHÉ DE LA PUISSANCE À L'HEURE EN INDONÉSIE, PAR MODÈLE D'ABONNEMENT, 2019-2032 (MILLIARDS USD)
  297. TABLEAU 96. ESTIMATIONS ET PRÉVISIONS DE LA TAILLE DU MARCHÉ DE LA PUISSANCE À L'HEURE EN INDONÉSIE, PAR RÉGION, 2019-2032 (MILLIARDS USD)
  298. TABLEAU 97. ESTIMATIONS ET PRÉVISIONS DE LA TAILLE DU MARCHÉ DE LA PUISSANCE À L'HEURE DANS LE RESTE DE L'APAC, PAR TYPE DE SERVICE, 2019-2032 (MILLIARDS USD)
  299. TABLEAU 98. ESTIMATIONS ET PRÉVISIONS DE LA TAILLE DU MARCHÉ DE LA PUISSANCE À L'HEURE DANS LE RESTE DE L'APAC, PAR TYPE D'ÉQUIPEMENT, 2019-2032 (MILLIARDS USD)
  300. TABLEAU 99. ESTIMATIONS ET PRÉVISIONS DE LA TAILLE DU MARCHÉ DE LA PUISSANCE À L'HEURE DANS LE RESTE DE L'APAC, PAR INDUSTRIE UTILISATRICE FINALE, 2019-2032 (MILLIARDS USD)
  301. TABLEAU 100. ESTIMATIONS ET PRÉVISIONS DE LA TAILLE DU MARCHÉ DE LA PUISSANCE À L'HEURE DANS LE RESTE DE L'APAC, PAR MODÈLE D'ABONNEMENT, 2019-2032 (MILLIARDS USD)
  302. TABLEAU 101. ESTIMATIONS ET PRÉVISIONS DE LA TAILLE DU MARCHÉ DE LA PUISSANCE À L'HEURE DANS LE RESTE DE L'APAC, PAR RÉGION, 2019-2032 (MILLIARDS USD)
  303. TABLEAU 102. ESTIMATIONS ET PRÉVISIONS DE LA TAILLE DU MARCHÉ DE LA PUISSANCE À L'HEURE EN AMÉRIQUE DU SUD, PAR TYPE DE SERVICE, 2019-2032 (MILLIARDS USD)
  304. TABLEAU 103. ESTIMATIONS ET PRÉVISIONS DE LA TAILLE DU MARCHÉ DE LA PUISSANCE À L'HEURE EN AMÉRIQUE DU SUD, PAR TYPE D'ÉQUIPEMENT, 2019-2032 (MILLIARDS USD)
  305. TABLEAU 104. ESTIMATIONS ET PRÉVISIONS DE LA TAILLE DU MARCHÉ DE LA PUISSANCE À L'HEURE EN AMÉRIQUE DU SUD, PAR INDUSTRIE UTILISATRICE FINALE, 2019-2032 (MILLIARDS USD)
  306. TABLEAU 105. ESTIMATIONS ET PRÉVISIONS DE LA TAILLE DU MARCHÉ DE LA PUISSANCE À L'HEURE EN AMÉRIQUE DU SUD, PAR MODÈLE D'ABONNEMENT, 2019-2032 (MILLIARDS USD)
  307. TABLEAU 106. ESTIMATIONS ET PRÉVISIONS DE LA TAILLE DU MARCHÉ DE LA PUISSANCE À L'HEURE EN AMÉRIQUE DU SUD, PAR RÉGION, 2019-2032 (MILLIARDS USD)
  308. TABLEAU 107. ESTIMATIONS ET PRÉVISIONS DE LA TAILLE DU MARCHÉ DE LA PUISSANCE À L'HEURE AU BRÉSIL, PAR TYPE DE SERVICE, 2019-2032 (MILLIARDS USD)
  309. TABLEAU 108. ESTIMATIONS ET PRÉVISIONS DE LA TAILLE DU MARCHÉ DE LA PUISSANCE À L'HEURE AU BRÉSIL, PAR TYPE D'ÉQUIPEMENT, 2019-2032 (MILLIARDS USD)
  310. TABLEAU 109. ESTIMATIONS ET PRÉVISIONS DE LA TAILLE DU MARCHÉ DE LA PUISSANCE À L'HEURE AU BRÉSIL, PAR INDUSTRIE UTILISATRICE FINALE, 2019-2032 (MILLIARDS USD)
  311. TABLEAU 110. ESTIMATIONS ET PRÉVISIONS DE LA TAILLE DU MARCHÉ DE LA PUISSANCE À L'HEURE AU BRÉSIL, PAR MODÈLE D'ABONNEMENT, 2019-2032 (MILLIARDS USD)
  312. TABLEAU 111. ESTIMATIONS ET PRÉVISIONS DE LA TAILLE DU MARCHÉ DE LA PUISSANCE À L'HEURE AU BRÉSIL, PAR RÉGION, 2019-2032 (MILLIARDS USD)
  313. TABLEAU 112. ESTIMATIONS ET PRÉVISIONS DE LA TAILLE DU MARCHÉ DE LA PUISSANCE À L'HEURE AU MEXIQUE, PAR TYPE DE SERVICE, 2019-2032 (MILLIARDS USD)
  314. TABLEAU 113. ESTIMATIONS ET PRÉVISIONS DE LA TAILLE DU MARCHÉ DE LA PUISSANCE À L'HEURE AU MEXIQUE, PAR TYPE D'ÉQUIPEMENT, 2019-2032 (MILLIARDS USD)
  315. TABLEAU 114. ESTIMATIONS ET PRÉVISIONS DE LA TAILLE DU MARCHÉ DE LA PUISSANCE À L'HEURE AU MEXIQUE, PAR INDUSTRIE UTILISATRICE FINALE, 2019-2032 (MILLIARDS USD)
  316. TABLEAU 115. ESTIMATIONS ET PRÉVISIONS DE LA TAILLE DU MARCHÉ DE LA PUISSANCE À L'HEURE AU MEXIQUE, PAR MODÈLE D'ABONNEMENT, 2019-2032 (MILLIARDS USD)
  317. TABLEAU 116. ESTIMATIONS ET PRÉVISIONS DE LA TAILLE DU MARCHÉ DE LA PUISSANCE À L'HEURE AU MEXIQUE, PAR RÉGION, 2019-2032 (MILLIARDS USD)
  318. TABLEAU 117. ESTIMATIONS ET PRÉVISIONS DE LA TAILLE DU MARCHÉ DE LA PUISSANCE À L'HEURE EN ARGENTINE, PAR TYPE DE SERVICE, 2019-2032 (MILLIARDS USD)
  319. TABLEAU 118. ESTIMATIONS ET PRÉVISIONS DE LA TAILLE DU MARCHÉ DE LA PUISSANCE À L'HEURE EN ARGENTINE, PAR TYPE D'ÉQUIPEMENT, 2019-2032 (MILLIARDS USD)
  320. TABLEAU 119. ESTIMATIONS ET PRÉVISIONS DE LA TAILLE DU MARCHÉ DE LA PUISSANCE À L'HEURE EN ARGENTINE, PAR INDUSTRIE UTILISATRICE FINALE, 2019-2032 (MILLIARDS USD)
  321. TABLEAU 120. ESTIMATIONS ET PRÉVISIONS DE LA TAILLE DU MARCHÉ DE LA PUISSANCE À L'HEURE EN ARGENTINE, PAR MODÈLE D'ABONNEMENT, 2019-2032 (MILLIARDS USD)
  322. TABLEAU 121. ESTIMATIONS ET PRÉVISIONS DE LA TAILLE DU MARCHÉ DE LA PUISSANCE À L'HEURE EN ARGENTINE, PAR RÉGION, 2019-2032 (MILLIARDS USD)
  323. TABLEAU 122. ESTIMATIONS ET PRÉVISIONS DE LA TAILLE DU MARCHÉ DE LA PUISSANCE À L'HEURE DANS LE RESTE DE L'AMÉRIQUE DU SUD, PAR TYPE DE SERVICE, 2019-2032 (MILLIARDS USD)
  324. TABLEAU 123. ESTIMATIONS ET PRÉVISIONS DE LA TAILLE DU MARCHÉ DE LA PUISSANCE À L'HEURE DANS LE RESTE DE L'AMÉRIQUE DU SUD, PAR TYPE D'ÉQUIPEMENT, 2019-2032 (MILLIARDS USD)
  325. TABLEAU 124. ESTIMATIONS ET PRÉVISIONS DE LA TAILLE DU MARCHÉ DE LA PUISSANCE À L'HEURE DANS LE RESTE DE L'AMÉRIQUE DU SUD, PAR INDUSTRIE UTILISATRICE FINALE, 2019-2032 (MILLIARDS USD)
  326. TABLEAU 125. ESTIMATIONS ET PRÉVISIONS DE LA TAILLE DU MARCHÉ DE LA PUISSANCE À L'HEURE DANS LE RESTE DE L'AMÉRIQUE DU SUD, PAR MODÈLE D'ABONNEMENT, 2019-2032 (MILLIARDS USD)
  327. TABLEAU 126. ESTIMATIONS ET PRÉVISIONS DE LA TAILLE DU MARCHÉ DE LA PUISSANCE À L'HEURE DANS LE RESTE DE L'AMÉRIQUE DU SUD, PAR RÉGION, 2019-2032 (MILLIARDS USD)
  328. TABLEAU 127. ESTIMATIONS ET PRÉVISIONS DE LA TAILLE DU MARCHÉ DE LA PUISSANCE À L'HEURE EN MEA, PAR TYPE DE SERVICE, 2019-2032 (MILLIARDS USD)
  329. TABLEAU 128. ESTIMATIONS ET PRÉVISIONS DE LA TAILLE DU MARCHÉ DE LA PUISSANCE À L'HEURE EN MEA, PAR TYPE D'ÉQUIPEMENT, 2019-2032 (MILLIARDS USD)
  330. TABLEAU 129. ESTIMATIONS ET PRÉVISIONS DE LA TAILLE DU MARCHÉ DE LA PUISSANCE À L'HEURE EN MEA, PAR INDUSTRIE UTILISATRICE FINALE, 2019-2032 (MILLIARDS USD)
  331. TABLEAU 130. ESTIMATIONS ET PRÉVISIONS DE LA TAILLE DU MARCHÉ DE LA PUISSANCE À L'HEURE EN MEA, PAR MODÈLE D'ABONNEMENT, 2019-2032 (MILLIARDS USD)
  332. TABLEAU 131. ESTIMATIONS ET PRÉVISIONS DE LA TAILLE DU MARCHÉ DE LA PUISSANCE À L'HEURE EN MEA, PAR RÉGION, 2019-2032 (MILLIARDS USD)
  333. TABLEAU 132. ESTIMATIONS ET PRÉVISIONS DE LA TAILLE DU MARCHÉ DE LA PUISSANCE À L'HEURE DANS LES PAYS DU CCG, PAR TYPE DE SERVICE, 2019-2032 (MILLIARDS USD)
  334. TABLEAU 133. ESTIMATIONS ET PRÉVISIONS DE LA TAILLE DU MARCHÉ DE LA PUISSANCE À L'HEURE DANS LES PAYS DU CCG, PAR TYPE D'ÉQUIPEMENT, 2019-2032 (MILLIARDS USD)
  335. TABLEAU 134. ESTIMATIONS ET PRÉVISIONS DE LA TAILLE DU MARCHÉ DE LA PUISSANCE À L'HEURE DANS LES PAYS DU CCG, PAR INDUSTRIE UTILISATRICE FINALE, 2019-2032 (MILLIARDS USD)
  336. TABLEAU 135. ESTIMATIONS ET PRÉVISIONS DE LA TAILLE DU MARCHÉ DE LA PUISSANCE À L'HEURE DANS LES PAYS DU CCG, PAR MODÈLE D'ABONNEMENT, 2019-2032 (MILLIARDS USD)
  337. TABLEAU 136. ESTIMATIONS ET PRÉVISIONS DE LA TAILLE DU MARCHÉ DE LA PUISSANCE À L'HEURE DANS LES PAYS DU CCG, PAR RÉGION, 2019-2032 (MILLIARDS USD)
  338. TABLEAU 137. ESTIMATIONS ET PRÉVISIONS DE LA TAILLE DU MARCHÉ DE LA PUISSANCE À L'HEURE EN AFRIQUE DU SUD, PAR TYPE DE SERVICE, 2019-2032 (MILLIARDS USD)
  339. TABLEAU 138. ESTIMATIONS ET PRÉVISIONS DE LA TAILLE DU MARCHÉ DE LA PUISSANCE À L'HEURE EN AFRIQUE DU SUD, PAR TYPE D'ÉQUIPEMENT, 2019-2032 (MILLIARDS USD)
  340. TABLEAU 139. ESTIMATIONS ET PRÉVISIONS DE LA TAILLE DU MARCHÉ DE LA PUISSANCE À L'HEURE EN AFRIQUE DU SUD, PAR INDUSTRIE UTILISATRICE FINALE, 2019-2032 (MILLIARDS USD)
  341. TABLEAU 140. ESTIMATIONS ET PRÉVISIONS DE LA TAILLE DU MARCHÉ DE LA PUISSANCE À L'HEURE EN AFRIQUE DU SUD, PAR MODÈLE D'ABONNEMENT, 2019-2032 (MILLIARDS USD)
  342. TABLEAU 141. ESTIMATIONS ET PRÉVISIONS DE LA TAILLE DU MARCHÉ DE LA PUISSANCE À L'HEURE EN AFRIQUE DU SUD, PAR RÉGION, 2019-2032 (MILLIARDS USD)
  343. TABLEAU 142. ESTIMATIONS ET PRÉVISIONS DE LA TAILLE DU MARCHÉ DE LA PUISSANCE À L'HEURE DANS LE RESTE DE LA MEA, PAR TYPE DE SERVICE, 2019-2032 (MILLIARDS USD)
  344. TABLEAU 143. ESTIMATIONS ET PRÉVISIONS DE LA TAILLE DU MARCHÉ DE LA PUISSANCE À L'HEURE DANS LE RESTE DE LA MEA, PAR TYPE D'ÉQUIPEMENT, 2019-2032 (MILLIARDS USD)
  345. TABLEAU 144. ESTIMATIONS ET PRÉVISIONS DE LA TAILLE DU MARCHÉ DE LA PUISSANCE À L'HEURE DANS LE RESTE DE LA MEA, PAR INDUSTRIE UTILISATRICE FINALE, 2019-2032 (MILLIARDS USD)
  346. TABLEAU 145. ESTIMATIONS ET PRÉVISIONS DE LA TAILLE DU MARCHÉ DE LA PUISSANCE À L'HEURE DANS LE RESTE DE LA MEA, PAR MODÈLE D'ABONNEMENT, 2019-2032 (MILLIARDS USD)
  347. TABLEAU 146. ESTIMATIONS ET PRÉVISIONS DE LA TAILLE DU MARCHÉ DE LA PUISSANCE À L'HEURE DANS LE RESTE DE LA MEA, PAR RÉGION, 2019-2032 (MILLIARDS USD)
  348. TABLEAU 147. LANCEMENT DE PRODUIT / DÉVELOPPEMENT DE PRODUIT / APPROBATION
  349. TABLEAU 148. ACQUISITION / PARTENARIAT
  350. LISTE DES FIGURES
  351. FIGURE 1. SYNOPSIS DU MARCHÉ
  352. FIGURE 2. ANALYSE DU MARCHÉ DE LA PUISSANCE À L'HEURE EN AMÉRIQUE DU NORD
  353. FIGURE 3. ANALYSE DU MARCHÉ DE LA PUISSANCE À L'HEURE AUX ÉTATS-UNIS PAR TYPE DE SERVICE
  354. FIGURE 4. ANALYSE DU MARCHÉ DE LA PUISSANCE À L'HEURE AUX ÉTATS-UNIS PAR TYPE D'ÉQUIPEMENT
  355. FIGURE 5. ANALYSE DU MARCHÉ DE LA PUISSANCE À L'HEURE AUX ÉTATS-UNIS PAR INDUSTRIE UTILISATRICE FINALE
  356. FIGURE 6. ANALYSE DU MARCHÉ DE LA PUISSANCE À L'HEURE AUX ÉTATS-UNIS PAR MODÈLE D'ABONNEMENT
  357. FIGURE 7. ANALYSE DU MARCHÉ DE LA PUISSANCE À L'HEURE AUX ÉTATS-UNIS PAR RÉGION
  358. FIGURE 8. ANALYSE DU MARCHÉ DE LA PUISSANCE À L'HEURE AU CANADA PAR TYPE DE SERVICE
  359. FIGURE 9. ANALYSE DU MARCHÉ DE LA PUISSANCE À L'HEURE AU CANADA PAR TYPE D'ÉQUIPEMENT
  360. FIGURE 10. ANALYSE DU MARCHÉ DE LA PUISSANCE À L'HEURE AU CANADA PAR INDUSTRIE UTILISATRICE FINALE
  361. FIGURE 11. ANALYSE DU MARCHÉ DE LA PUISSANCE À L'HEURE AU CANADA PAR MODÈLE D'ABONNEMENT
  362. FIGURE 12. ANALYSE DU MARCHÉ DE LA PUISSANCE À L'HEURE AU CANADA PAR RÉGION
  363. FIGURE 13. ANALYSE DU MARCHÉ DE LA PUISSANCE À L'HEURE EN EUROPE
  364. FIGURE 14. ANALYSE DU MARCHÉ DE LA PUISSANCE À L'HEURE EN ALLEMAGNE PAR TYPE DE SERVICE
  365. FIGURE 15. ANALYSE DU MARCHÉ DE LA PUISSANCE À L'HEURE EN ALLEMAGNE PAR TYPE D'ÉQUIPEMENT
  366. FIGURE 16. ANALYSE DU MARCHÉ DE LA PUISSANCE À L'HEURE EN ALLEMAGNE PAR INDUSTRIE UTILISATRICE FINALE
  367. FIGURE 17. ANALYSE DU MARCHÉ DE LA PUISSANCE À L'HEURE EN ALLEMAGNE PAR MODÈLE D'ABONNEMENT
  368. FIGURE 18. ANALYSE DU MARCHÉ DE LA PUISSANCE À L'HEURE EN ALLEMAGNE PAR RÉGION
  369. FIGURE 19. ANALYSE DU MARCHÉ DE LA PUISSANCE À L'HEURE AU ROYAUME-UNI PAR TYPE DE SERVICE
  370. FIGURE 20. ANALYSE DU MARCHÉ DE LA PUISSANCE À L'HEURE AU ROYAUME-UNI PAR TYPE D'ÉQUIPEMENT
  371. FIGURE 21. ANALYSE DU MARCHÉ DE LA PUISSANCE À L'HEURE AU ROYAUME-UNI PAR INDUSTRIE UTILISATRICE FINALE
  372. FIGURE 22. ANALYSE DU MARCHÉ DE LA PUISSANCE À L'HEURE AU ROYAUME-UNI PAR MODÈLE D'ABONNEMENT
  373. FIGURE 23. ANALYSE DU MARCHÉ DE LA PUISSANCE À L'HEURE AU ROYAUME-UNI PAR RÉGION
  374. FIGURE 24. ANALYSE DU MARCHÉ DE LA PUISSANCE À L'HEURE EN FRANCE PAR TYPE DE SERVICE
  375. FIGURE 25. ANALYSE DU MARCHÉ DE LA PUISSANCE À L'HEURE EN FRANCE PAR TYPE D'ÉQUIPEMENT
  376. FIGURE 26. ANALYSE DU MARCHÉ DE LA PUISSANCE À L'HEURE EN FRANCE PAR INDUSTRIE UTILISATRICE FINALE
  377. FIGURE 27. ANALYSE DU MARCHÉ DE LA PUISSANCE À L'HEURE EN FRANCE PAR MODÈLE D'ABONNEMENT
  378. FIGURE 28. ANALYSE DU MARCHÉ DE LA PUISSANCE À L'HEURE EN FRANCE PAR RÉGION
  379. FIGURE 29. ANALYSE DU MARCHÉ DE LA PUISSANCE À L'HEURE EN RUSSIE PAR TYPE DE SERVICE
  380. FIGURE 30. ANALYSE DU MARCHÉ DE LA PUISSANCE À L'HEURE EN RUSSIE PAR TYPE D'ÉQUIPEMENT
  381. FIGURE 31. ANALYSE DU MARCHÉ DE LA PUISSANCE À L'HEURE EN RUSSIE PAR INDUSTRIE UTILISATRICE FINALE
  382. FIGURE 32. ANALYSE DU MARCHÉ DE LA PUISSANCE À L'HEURE EN RUSSIE PAR MODÈLE D'ABONNEMENT
  383. FIGURE 33. ANALYSE DU MARCHÉ DE LA PUISSANCE À L'HEURE EN RUSSIE PAR RÉGION
  384. FIGURE 34. ANALYSE DU MARCHÉ DE LA PUISSANCE À L'HEURE EN ITALIE PAR TYPE DE SERVICE
  385. FIGURE 35. ANALYSE DU MARCHÉ DE LA PUISSANCE À L'HEURE EN ITALIE PAR TYPE D'ÉQUIPEMENT
  386. FIGURE 36. ANALYSE DU MARCHÉ DE LA PUISSANCE À L'HEURE EN ITALIE PAR INDUSTRIE UTILISATRICE FINALE
  387. FIGURE 37. ANALYSE DU MARCHÉ DE LA PUISSANCE À L'HEURE EN ITALIE PAR MODÈLE D'ABONNEMENT
  388. FIGURE 38. ANALYSE DU MARCHÉ DE LA PUISSANCE À L'HEURE EN ITALIE PAR RÉGION
  389. FIGURE 39. ANALYSE DU MARCHÉ DE LA PUISSANCE À L'HEURE EN ESPAGNE PAR TYPE DE SERVICE
  390. FIGURE 40. ANALYSE DU MARCHÉ DE LA PUISSANCE À L'HEURE EN ESPAGNE PAR TYPE D'ÉQUIPEMENT
  391. FIGURE 41. ANALYSE DU MARCHÉ DE LA PUISSANCE À L'HEURE EN ESPAGNE PAR INDUSTRIE UTILISATRICE FINALE
  392. FIGURE 42. ANALYSE DU MARCHÉ DE LA PUISSANCE À L'HEURE EN ESPAGNE PAR MODÈLE D'ABONNEMENT
  393. FIGURE 43. ANALYSE DU MARCHÉ DE LA PUISSANCE À L'HEURE EN ESPAGNE PAR RÉGION
  394. FIGURE 44. ANALYSE DU MARCHÉ DE LA PUISSANCE À L'HEURE DANS LE RESTE DE L'EUROPE PAR TYPE DE SERVICE
  395. FIGURE 45. ANALYSE DU MARCHÉ DE LA PUISSANCE À L'HEURE DANS LE RESTE DE L'EUROPE PAR TYPE D'ÉQUIPEMENT
  396. FIGURE 46. ANALYSE DU MARCHÉ DE LA PUISSANCE À L'HEURE DANS LE RESTE DE L'EUROPE PAR INDUSTRIE UTILISATRICE FINALE
  397. FIGURE 47. ANALYSE DU MARCHÉ DE LA PUISSANCE À L'HEURE DANS LE RESTE DE L'EUROPE PAR MODÈLE D'ABONNEMENT
  398. FIGURE 48. ANALYSE DU MARCHÉ DE LA PUISSANCE À L'HEURE DANS LE RESTE DE L'EUROPE PAR RÉGION
  399. FIGURE 49. ANALYSE DU MARCHÉ DE LA PUISSANCE À L'HEURE EN APAC
  400. FIGURE 50. ANALYSE DU MARCHÉ DE LA PUISSANCE À L'HEURE EN CHINE PAR TYPE DE SERVICE
  401. FIGURE 51. ANALYSE DU MARCHÉ DE LA PUISSANCE À L'HEURE EN CHINE PAR TYPE D'ÉQUIPEMENT
  402. FIGURE 52. ANALYSE DU MARCHÉ DE LA PUISSANCE À L'HEURE EN CHINE PAR INDUSTRIE UTILISATRICE FINALE
  403. FIGURE 53. ANALYSE DU MARCHÉ DE LA PUISSANCE À L'HEURE EN CHINE PAR MODÈLE D'ABONNEMENT
  404. FIGURE 54. ANALYSE DU MARCHÉ DE LA PUISSANCE À L'HEURE EN CHINE PAR RÉGION
  405. FIGURE 55. ANALYSE DU MARCHÉ DE LA PUISSANCE À L'HEURE EN INDE PAR TYPE DE SERVICE
  406. FIGURE 56. ANALYSE DU MARCHÉ DE LA PUISSANCE À L'HEURE EN INDE PAR TYPE D'ÉQUIPEMENT
  407. FIGURE 57. ANALYSE DU MARCHÉ DE LA PUISSANCE À L'HEURE EN INDE PAR INDUSTRIE UTILISATRICE FINALE
  408. FIGURE 58. ANALYSE DU MARCHÉ DE LA PUISSANCE À L'HEURE EN INDE PAR MODÈLE D'ABONNEMENT
  409. FIGURE 59. ANALYSE DU MARCHÉ DE LA PUISSANCE À L'HEURE EN INDE PAR RÉGION
  410. FIGURE 60. ANALYSE DU MARCHÉ DE LA PUISSANCE À L'HEURE AU JAPON PAR TYPE DE SERVICE
  411. FIGURE 61. ANALYSE DU MARCHÉ DE LA PUISSANCE À L'HEURE AU JAPON PAR TYPE D'ÉQUIPEMENT
  412. FIGURE 62. ANALYSE DU MARCHÉ DE LA PUISSANCE À L'HEURE AU JAPON PAR INDUSTRIE UTILISATRICE FINALE
  413. FIGURE 63. ANALYSE DU MARCHÉ DE LA PUISSANCE À L'HEURE AU JAPON PAR MODÈLE D'ABONNEMENT
  414. FIGURE 64. ANALYSE DU MARCHÉ DE LA PUISSANCE À L'HEURE AU JAPON PAR RÉGION
  415. FIGURE 65. ANALYSE DU MARCHÉ DE LA PUISSANCE À L'HEURE EN CORÉE DU SUD PAR TYPE DE SERVICE
  416. FIGURE 66. ANALYSE DU MARCHÉ DE LA PUISSANCE À L'HEURE EN CORÉE DU SUD PAR TYPE D'ÉQUIPEMENT
  417. FIGURE 67. ANALYSE DU MARCHÉ DE LA PUISSANCE À L'HEURE EN CORÉE DU SUD PAR INDUSTRIE UTILISATRICE FINALE
  418. FIGURE 68. ANALYSE DU MARCHÉ DE LA PUISSANCE À L'HEURE EN CORÉE DU SUD PAR MODÈLE D'ABONNEMENT
  419. FIGURE 69. ANALYSE DU MARCHÉ DE LA PUISSANCE À L'HEURE EN CORÉE DU SUD PAR RÉGION
  420. FIGURE 70. ANALYSE DU MARCHÉ DE LA PUISSANCE À L'HEURE EN MALAYSIE PAR TYPE DE SERVICE
  421. FIGURE 71. ANALYSE DU MARCHÉ DE LA PUISSANCE À L'HEURE EN MALAYSIE PAR TYPE D'ÉQUIPEMENT
  422. FIGURE 72. ANALYSE DU MARCHÉ DE LA PUISSANCE À L'HEURE EN MALAYSIE PAR INDUSTRIE UTILISATRICE FINALE
  423. FIGURE 73. ANALYSE DU MARCHÉ DE LA PUISSANCE À L'HEURE EN MALAYSIE PAR MODÈLE D'ABONNEMENT
  424. FIGURE 74. ANALYSE DU MARCHÉ DE LA PUISSANCE À L'HEURE EN MALAYSIE PAR RÉGION
  425. FIGURE 75. ANALYSE DU MARCHÉ DE LA PUISSANCE À L'HEURE EN THAÏLANDE PAR TYPE DE SERVICE
  426. FIGURE 76. ANALYSE DU MARCHÉ DE LA PUISSANCE À L'HEURE EN THAÏLANDE PAR TYPE D'ÉQUIPEMENT
  427. FIGURE 77. ANALYSE DU MARCHÉ DE LA PUISSANCE À L'HEURE EN THAÏLANDE PAR INDUSTRIE UTILISATRICE FINALE
  428. FIGURE 78. ANALYSE DU MARCHÉ DE LA PUISSANCE À L'HEURE EN THAÏLANDE PAR MODÈLE D'ABONNEMENT
  429. FIGURE 79. ANALYSE DU MARCHÉ DE LA PUISSANCE À L'HEURE EN THAÏLANDE PAR RÉGION
  430. FIGURE 80. ANALYSE DU MARCHÉ DE LA PUISSANCE À L'HEURE EN INDONÉSIE PAR TYPE DE SERVICE
  431. FIGURE 81. ANALYSE DU MARCHÉ DE LA PUISSANCE À L'HEURE EN INDONÉSIE PAR TYPE D'ÉQUIPEMENT
  432. FIGURE 82. ANALYSE DU MARCHÉ DE LA PUISSANCE À L'HEURE EN INDONÉSIE PAR INDUSTRIE UTILISATRICE FINALE
  433. FIGURE 83. ANALYSE DU MARCHÉ DE LA PUISSANCE À L'HEURE EN INDONÉSIE PAR MODÈLE D'ABONNEMENT
  434. FIGURE 84. ANALYSE DU MARCHÉ DE LA PUISSANCE À L'HEURE EN INDONÉSIE PAR RÉGION
  435. FIGURE 85. ANALYSE DU MARCHÉ DE LA PUISSANCE À L'HEURE DANS LE RESTE DE L'APAC PAR TYPE DE SERVICE
  436. FIGURE 86. ANALYSE DU MARCHÉ DE LA PUISSANCE À L'HEURE DANS LE RESTE DE L'APAC PAR TYPE D'ÉQUIPEMENT
  437. FIGURE 87. ANALYSE DU MARCHÉ DE LA PUISSANCE À L'HEURE DANS LE RESTE DE L'APAC PAR INDUSTRIE UTILISATRICE FINALE
  438. FIGURE 88. ANALYSE DU MARCHÉ DE LA PUISSANCE À L'HEURE DANS LE RESTE DE L'APAC PAR MODÈLE D'ABONNEMENT
  439. FIGURE 89. ANALYSE DU MARCHÉ DE LA PUISSANCE À L'HEURE DANS LE RESTE DE L'APAC PAR RÉGION
  440. FIGURE 90. ANALYSE DU MARCHÉ DE LA PUISSANCE À L'HEURE EN AMÉRIQUE DU SUD
  441. FIGURE 91. ANALYSE DU MARCHÉ DE LA PUISSANCE À L'HEURE AU BRÉSIL PAR TYPE DE SERVICE
  442. FIGURE 92. ANALYSE DU MARCHÉ DE LA PUISSANCE À L'HEURE AU BRÉSIL PAR TYPE D'ÉQUIPEMENT
  443. FIGURE 93. ANALYSE DU MARCHÉ DE LA PUISSANCE À L'HEURE AU BRÉSIL PAR INDUSTRIE UTILISATRICE FINALE
  444. FIGURE 94. ANALYSE DU MARCHÉ DE LA PUISSANCE À L'HEURE AU BRÉSIL PAR MODÈLE D'ABONNEMENT
  445. FIGURE 95. ANALYSE DU MARCHÉ DE LA PUISSANCE À L'HEURE AU BRÉSIL PAR RÉGION
  446. FIGURE 96. ANALYSE DU MARCHÉ DE LA PUISSANCE À L'HEURE AU MEXIQUE PAR TYPE DE SERVICE
  447. FIGURE 97. ANALYSE DU MARCHÉ DE LA PUISSANCE À L'HEURE AU MEXIQUE PAR TYPE D'ÉQUIPEMENT
  448. FIGURE 98. ANALYSE DU MARCHÉ DE LA PUISSANCE À L'HEURE AU MEXIQUE PAR INDUSTRIE UTILISATRICE FINALE

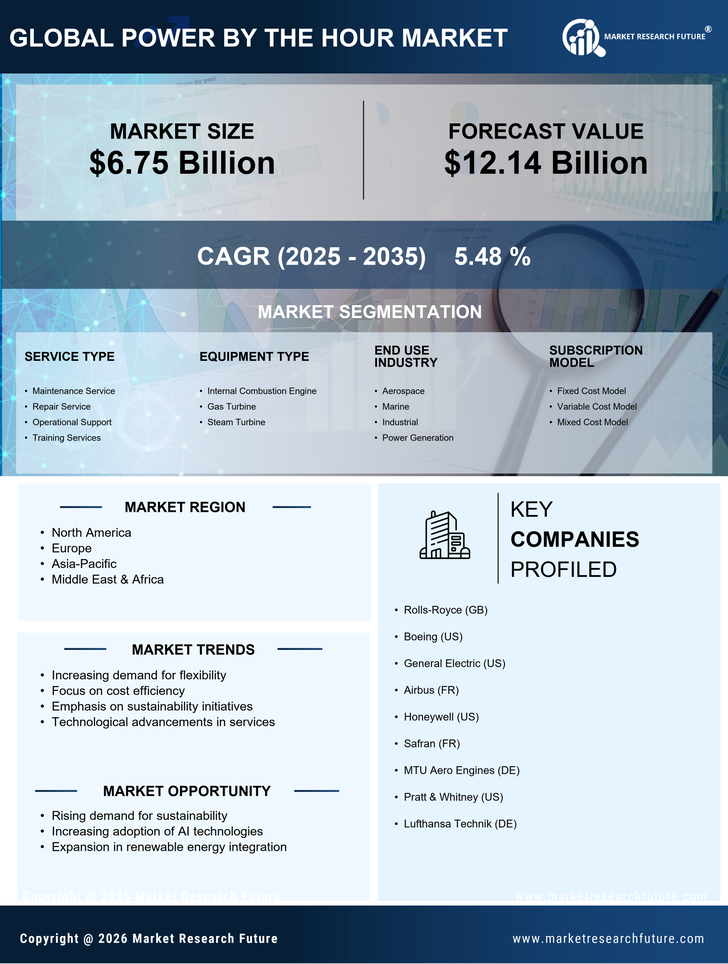
Marché Power by the Hour : Segmentation du marché

  • Marché Power by the Hour par type de service (milliards USD, 2019-2032)
    • Service de maintenance
    • Service de réparation
    • Soutien opérationnel
    • Services de formation

  • Marché Power by the Hour par type d'équipement (milliards USD, 2019-2032)
    • Moteur à combustion interne
    • Turbine à gaz
    • Turbine à vapeur

  • Marché Power by the Hour par secteur d'utilisation finale (milliards USD, 2019-2032)
    • Aéronautique
    • Maritime
    • Industriel
    • Production d'énergie

  • Marché Power by the Hour par modèle d'abonnement (milliards USD, 2019-2032)
    • Modèle à coût fixe
    • Modèle à coût variable
    • Modèle à coût mixte

  • Marché Power by the Hour par région (milliards USD, 2019-2032)
    • Amérique du Nord
    • Europe
    • Amérique du Sud
    • Asie-Pacifique
    • Moyen-Orient et Afrique

Perspectives régionales du marché Power by the Hour (milliards USD, 2019-2032)

  • Perspectives de l'Amérique du Nord (milliards USD, 2019-2032)
    • Marché Power by the Hour en Amérique du Nord par type de service
      • Service de maintenance
      • Service de réparation
      • Soutien opérationnel
      • Services de formation
    • Marché Power by the Hour en Amérique du Nord par type d'équipement
      • Moteur à combustion interne
      • Turbine à gaz
      • Turbine à vapeur
    • Marché Power by the Hour en Amérique du Nord par type d'industrie d'utilisation finale
      • Aéronautique
      • Maritime
      • Industriel
      • Production d'énergie
    • Marché Power by the Hour en Amérique du Nord par type de modèle d'abonnement
      • Modèle à coût fixe
      • Modèle à coût variable
      • Modèle à coût mixte
    • Marché Power by the Hour en Amérique du Nord par type régional
      • États-Unis
      • Canada
    • Perspectives des États-Unis (milliards USD, 2019-2032)
    • Marché Power by the Hour aux États-Unis par type de service
      • Service de maintenance
      • Service de réparation
      • Soutien opérationnel
      • Services de formation
    • Marché Power by the Hour aux États-Unis par type d'équipement
      • Moteur à combustion interne
      • Turbine à gaz
      • Turbine à vapeur
    • Marché Power by the Hour aux États-Unis par type d'industrie d'utilisation finale
      • Aéronautique
      • Maritime
      • Industriel
      • Production d'énergie
    • Marché Power by the Hour aux États-Unis par type de modèle d'abonnement
      • Modèle à coût fixe
      • Modèle à coût variable
      • Modèle à coût mixte
    • Perspectives du Canada (milliards USD, 2019-2032)
    • Marché Power by the Hour au Canada par type de service
      • Service de maintenance
      • Service de réparation
      • Soutien opérationnel
      • Services de formation
    • Marché Power by the Hour au Canada par type d'équipement
      • Moteur à combustion interne
      • Turbine à gaz
      • Turbine à vapeur
    • Marché Power by the Hour au Canada par type d'industrie d'utilisation finale
      • Aéronautique
      • Maritime
      • Industriel
      • Production d'énergie
    • Marché Power by the Hour au Canada par type de modèle d'abonnement
      • Modèle à coût fixe
      • Modèle à coût variable
      • Modèle à coût mixte
    • Perspectives de l'Europe (milliards USD, 2019-2032)
      • Marché Power by the Hour en Europe par type de service
        • Service de maintenance
        • Service de réparation
        • Soutien opérationnel
        • Services de formation
      • Marché Power by the Hour en Europe par type d'équipement
        • Moteur à combustion interne
        • Turbine à gaz
        • Turbine à vapeur
      • Marché Power by the Hour en Europe par type d'industrie d'utilisation finale
        • Aéronautique
        • Maritime
        • Industriel
        • Production d'énergie
      • Marché Power by the Hour en Europe par type de modèle d'abonnement
        • Modèle à coût fixe
        • Modèle à coût variable
        • Modèle à coût mixte
      • Marché Power by the Hour en Europe par type régional
        • Allemagne
        • Royaume-Uni
        • France
        • Russie
        • Italie
        • Espagne
        • Reste de l'Europe
      • Perspectives de l'Allemagne (milliards USD, 2019-2032)
      • Marché Power by the Hour en Allemagne par type de service
        • Service de maintenance
        • Service de réparation
        • Soutien opérationnel
        • Services de formation
      • Marché Power by the Hour en Allemagne par type d'équipement
        • Moteur à combustion interne
        • Turbine à gaz
        • Turbine à vapeur
      • Marché Power by the Hour en Allemagne par type d'industrie d'utilisation finale
        • Aéronautique
        • Maritime
        • Industriel
        • Production d'énergie
      • Marché Power by the Hour en Allemagne par type de modèle d'abonnement
        • Modèle à coût fixe
        • Modèle à coût variable
        • Modèle à coût mixte
      • Perspectives du Royaume-Uni (milliards USD, 2019-2032)
      • Marché Power by the Hour au Royaume-Uni par type de service
        • Service de maintenance
        • Service de réparation
        • Soutien opérationnel
        • Services de formation
      • Marché Power by the Hour au Royaume-Uni par type d'équipement
        • Moteur à combustion interne
        • Turbine à gaz
        • Turbine à vapeur
      • Marché Power by the Hour au Royaume-Uni par type d'industrie d'utilisation finale
        • Aéronautique
        • Maritime
        • Industriel
        • Production d'énergie
      • Marché Power by the Hour au Royaume-Uni par type de modèle d'abonnement
        • Modèle à coût fixe
        • Modèle à coût variable
        • Modèle à coût mixte
      • Perspectives de la France (milliards USD, 2019-2032)
      • Marché Power by the Hour en France par type de service
        • Service de maintenance
        • Service de réparation
        • Soutien opérationnel
        • Services de formation
      • Marché Power by the Hour en France par type d'équipement
        • Moteur à combustion interne
        • Turbine à gaz
        • Turbine à vapeur
      • Marché Power by the Hour en France par type d'industrie d'utilisation finale
        • Aéronautique
        • Maritime
        • Industriel
        • Production d'énergie
      • Marché Power by the Hour en France par type de modèle d'abonnement
        • Modèle à coût fixe
        • Modèle à coût variable
        • Modèle à coût mixte
      • Perspectives de la Russie (milliards USD, 2019-2032)
      • Marché Power by the Hour en Russie par type de service
        • Service de maintenance
        • Service de réparation
        • Soutien opérationnel
        • Services de formation
      • Marché Power by the Hour en Russie par type d'équipement
        • Moteur à combustion interne
        • Turbine à gaz
        • Turbine à vapeur
      • Marché Power by the Hour en Russie par type d'industrie d'utilisation finale
        • Aéronautique
        • Maritime
        • Industriel
        • Production d'énergie
      • Marché Power by the Hour en Russie par type de modèle d'abonnement
        • Modèle à coût fixe
        • Modèle à coût variable
        • Modèle à coût mixte
      • Perspectives de l'Italie (milliards USD, 2019-2032)
      • Marché Power by the Hour en Italie par type de service
        • Service de maintenance
        • Service de réparation
        • Soutien opérationnel
        • Services de formation
      • Marché Power by the Hour en Italie par type d'équipement
        • Moteur à combustion interne
        • Turbine à gaz
        • Turbine à vapeur
      • Marché Power by the Hour en Italie par type d'industrie d'utilisation finale
        • Aéronautique
        • Maritime
        • Industriel
        • Production d'énergie
      • Marché Power by the Hour en Italie par type de modèle d'abonnement
        • Modèle à coût fixe
        • Modèle à coût variable
        • Modèle à coût mixte
      • Perspectives de l'Espagne (milliards USD, 2019-2032)
      • Marché Power by the Hour en Espagne par type de service
        • Service de maintenance
        • Service de réparation
        • Soutien opérationnel
        • Services de formation
      • Marché Power by the Hour en Espagne par type d'équipement
        • Moteur à combustion interne
        • Turbine à gaz
        • Turbine à vapeur
      • Marché Power by the Hour en Espagne par type d'industrie d'utilisation finale
        • Aéronautique
        • Maritime
        • Industriel
        • Production d'énergie
      • Marché Power by the Hour en Espagne par type de modèle d'abonnement
        • Modèle à coût fixe
        • Modèle à coût variable
        • Modèle à coût mixte
      • Perspectives du reste de l'Europe (milliards USD, 2019-2032)
      • Marché Power by the Hour dans le reste de l'Europe par type de service
        • Service de maintenance
        • Service de réparation
        • Soutien opérationnel
        • Services de formation
      • Marché Power by the Hour dans le reste de l'Europe par type d'équipement
        • Moteur à combustion interne
        • Turbine à gaz
        • Turbine à vapeur
      • Marché Power by the Hour dans le reste de l'Europe par type d'industrie d'utilisation finale
        • Aéronautique
        • Maritime
        • Industriel
        • Production d'énergie
      • Marché Power by the Hour dans le reste de l'Europe par type de modèle d'abonnement
        • Modèle à coût fixe
        • Modèle à coût variable
        • Modèle à coût mixte
      • Perspectives de l'APAC (milliards USD, 2019-2032)
        • Marché Power by the Hour en APAC par type de service
          • Service de maintenance
          • Service de réparation
          • Soutien opérationnel
          • Services de formation
        • Marché Power by the Hour en APAC par type d'équipement
          • Moteur à combustion interne
          • Turbine à gaz
          • Turbine à vapeur
        • Marché Power by the Hour en APAC par type d'industrie d'utilisation finale
          • Aéronautique
          • Maritime
          • Industriel
          • Production d'énergie
        • Marché Power by the Hour en APAC par type de modèle d'abonnement
          • Modèle à coût fixe
          • Modèle à coût variable
          • Modèle à coût mixte
        • Marché Power by the Hour en APAC par type régional
          • Chine
          • Inde
          • Japon
          • Corée du Sud
          • Malaisie
          • Thaïlande
          • Indonésie
          • Reste de l'APAC
        • Perspectives de la Chine (milliards USD, 2019-2032)
        • Marché Power by the Hour en Chine par type de service
          • Service de maintenance
          • Service de réparation
          • Soutien opérationnel
          • Services de formation
        • Marché Power by the Hour en Chine par type d'équipement
          • Moteur à combustion interne
          • Turbine à gaz
          • Turbine à vapeur
        • Marché Power by the Hour en Chine par type d'industrie d'utilisation finale
          • Aéronautique
          • Maritime
          • Industriel
          • Production d'énergie
        • Marché Power by the Hour en Chine par type de modèle d'abonnement
          • Modèle à coût fixe
          • Modèle à coût variable
          • Modèle à coût mixte
        • Perspectives de l'Inde (milliards USD, 2019-2032)
        • Marché Power by the Hour en Inde par type de service
          • Service de maintenance
          • Service de réparation
          • Soutien opérationnel
          • Services de formation
        • Marché Power by the Hour en Inde par type d'équipement
          • Moteur à combustion interne
          • Turbine à gaz
          • Turbine à vapeur
        • Marché Power by the Hour en Inde par type d'industrie d'utilisation finale
          • Aéronautique
          • Maritime
          • Industriel
          • Production d'énergie
        • Marché Power by the Hour en Inde par type de modèle d'abonnement
          • Modèle à coût fixe
          • Modèle à coût variable
          • Modèle à coût mixte
        • Perspectives du Japon (milliards USD, 2019-2032)
        • Marché Power by the Hour au Japon par type de service
          • Service de maintenance
          • Service de réparation
          • Soutien opérationnel
          • Services de formation
        • Marché Power by the Hour au Japon par type d'équipement
          • Moteur à combustion interne
          • Turbine à gaz
          • Turbine à vapeur
        • Marché Power by the Hour au Japon par type d'industrie d'utilisation finale
          • Aéronautique
          • Maritime
          • Industriel
          • Production d'énergie
        • Marché Power by the Hour au Japon par type de modèle d'abonnement
          • Modèle à coût fixe
          • Modèle à coût variable
          • Modèle à coût mixte
        • Perspectives de la Corée du Sud (milliards USD, 2019-2032)
        • Marché Power by the Hour en Corée du Sud par type de service
          • Service de maintenance
          • Service de réparation
          • Soutien opérationnel
          • Services de formation
        • Marché Power by the Hour en Corée du Sud par type d'équipement
          • Moteur à combustion interne
          • Turbine à gaz
          • Turbine à vapeur
        • Marché Power by the Hour en Corée du Sud par type d'industrie d'utilisation finale
          • Aéronautique
          • Maritime
          • Industriel
          • Production d'énergie
        • Marché Power by the Hour en Corée du Sud par type de modèle d'abonnement
          • Modèle à coût fixe
          • Modèle à coût variable
          • Modèle à coût mixte
        • Perspectives de la Malaisie (milliards USD, 2019-2032)
        • Marché Power by the Hour en Malaisie par type de service
          • Service de maintenance
          • Service de réparation
          • Soutien opérationnel
          • Services de formation
        • Marché Power by the Hour en Malaisie par type d'équipement
          • Moteur à combustion interne
          • Turbine à gaz
          • Turbine à vapeur
        • Marché Power by the Hour en Malaisie par type d'industrie d'utilisation finale
          • Aéronautique
          • Maritime
          • Industriel
          • Production d'énergie
        • Marché Power by the Hour en Malaisie par type de modèle d'abonnement
          • Modèle à coût fixe
          • Modèle à coût variable
          • Modèle à coût mixte
        • Perspectives de la Thaïlande (milliards USD, 2019-2032)
        • Marché Power by the Hour en Thaïlande par type de service
          • Service de maintenance
          • Service de réparation
          • Soutien opérationnel
          • Services de formation
        • Marché Power by the Hour en Thaïlande par type d'équipement
          • Moteur à combustion interne
          • Turbine à gaz
          • Turbine à vapeur
        • Marché Power by the Hour en Thaïlande par type d'industrie d'utilisation finale
          • Aéronautique
          • Maritime
          • Industriel
          • Production d'énergie
        • Marché Power by the Hour en Thaïlande par type de modèle d'abonnement
          • Modèle à coût fixe
          • Modèle à coût variable
          • Modèle à coût mixte
        • Perspectives de l'Indonésie (milliards USD, 2019-2032)
        • Marché Power by the Hour en Indonésie par type de service
          • Service de maintenance
          • Service de réparation
          • Soutien opérationnel
          • Services de formation
        • Marché Power by the Hour en Indonésie par type d'équipement
          • Moteur à combustion interne
          • Turbine à gaz
          • Turbine à vapeur
        • Marché Power by the Hour en Indonésie par type d'industrie d'utilisation finale
          • Aéronautique
          • Maritime
          • Industriel
          • Production d'énergie
        • Marché Power by the Hour en Indonésie par type de modèle d'abonnement
          • Modèle à coût fixe
          • Modèle à coût variable
          • Modèle à coût mixte
        • Perspectives du reste de l'APAC (milliards USD, 2019-2032)
        • Marché Power by the Hour dans le reste de l'APAC par type de service
          • Service de maintenance
          • Service de réparation
          • Soutien opérationnel
          • Services de formation
        • Marché Power by the Hour dans le reste de l'APAC par type d'équipement
          • Moteur à combustion interne
          • Turbine à gaz
          • Turbine à vapeur
        • Marché Power by the Hour dans le reste de l'APAC par type d'industrie d'utilisation finale
          • Aéronautique
          • Maritime
          • Industriel
          • Production d'énergie
        • Marché Power by the Hour dans le reste de l'APAC par type de modèle d'abonnement
          • Modèle à coût fixe
          • Modèle à coût variable
          • Modèle à coût mixte
        • Perspectives de l'Amérique du Sud (milliards USD, 2019-2032)
          • Marché Power by the Hour en Amérique du Sud par type de service
            • Service de maintenance
            • Service de réparation
            • Soutien opérationnel
            • Services de formation
          • Marché Power by the Hour en Amérique du Sud par type d'équipement
            • Moteur à combustion interne
            • Turbine à gaz
            • Turbine à vapeur
          • Marché Power by the Hour en Amérique du Sud par type d'industrie d'utilisation finale
            • Aéronautique
            • Maritime
            • Industriel
            • Production d'énergie
          • Marché Power by the Hour en Amérique du Sud par type de modèle d'abonnement
            • Modèle à coût fixe
            • Modèle à coût variable
            • Modèle à coût mixte
          • Marché Power by the Hour en Amérique du Sud par type régional
            • Brésil
            • Mexique
            • Argentine
            • Reste de l'Amérique du Sud
          • Perspectives du Brésil (milliards USD, 2019-2032)
          • Marché Power by the Hour au Brésil par type de service
            • Service de maintenance
            • Service de réparation
            • Soutien opérationnel
            • Services de formation
          • Marché Power by the Hour au Brésil par type d'équipement
            • Moteur à combustion interne
            • Turbine à gaz
            • Turbine à vapeur
          • Marché Power by the Hour au Brésil par type d'industrie d'utilisation finale
            • Aéronautique
            • Maritime
            • Industriel
            • Production d'énergie
          • Marché Power by the Hour au Brésil par type de modèle d'abonnement
            • Modèle à coût fixe
            • Modèle à coût variable
            • Modèle à coût mixte
          • Perspectives du Mexique (milliards USD, 2019-2032)
          • Marché Power by the Hour au Mexique par type de service
            • Service de maintenance
            • Service de réparation
            • Soutien opérationnel
            • Services de formation
          • Marché Power by the Hour au Mexique par type d'équipement
            • Moteur à combustion interne
            • Turbine à gaz
            • Turbine à vapeur
          • Marché Power by the Hour au Mexique par type d'industrie d'utilisation finale
            • Aéronautique
            • Maritime
            • Industriel
            • Production d'énergie
          • Marché Power by the Hour au Mexique par type de modèle d'abonnement
            • Modèle à coût fixe
            • Modèle à coût variable
            • Modèle à coût mixte
          • Perspectives de l'Argentine (milliards USD, 2019-2032)
          • Marché Power by the Hour en Argentine par type de service
            • Service de maintenance
            • Service de réparation
            • Soutien opérationnel
            • Services de formation
          • Marché Power by the Hour en Argentine par type d'équipement
            • Moteur à combustion interne
            • Turbine à gaz
            • Turbine à vapeur
          • Marché Power by the Hour en Argentine par type d'industrie d'utilisation finale
            • Aéronautique
            • Maritime
            • Industriel
            • Production d'énergie
          • Marché Power by the Hour en Argentine par type de modèle d'abonnement
            • Modèle à coût fixe
            • Modèle à coût variable
            • Modèle à coût mixte
          • Perspectives du reste de l'Amérique du Sud (milliards USD, 2019-2032)
          • Marché Power by the Hour dans le reste de l'Amérique du Sud par type de service
            • Service de maintenance
            • Service de réparation
            • Soutien opérationnel
            • Services de formation
          • Marché Power by the Hour dans le reste de l'Amérique du Sud par type d'équipement
            • Moteur à combustion interne
            • Turbine à gaz
            • Turbine à vapeur
          • Marché Power by the Hour dans le reste de l'Amérique du Sud par type d'industrie d'utilisation finale
            • Aéronautique
            • Maritime
            • Industriel
            • Production d'énergie
          • Marché Power by the Hour dans le reste de l'Amérique du Sud par type de modèle d'abonnement
            • Modèle à coût fixe
            • Modèle à coût variable
            • Modèle à coût mixte
          • Perspectives de la MEA (milliards USD, 2019-2032)
            • Marché Power by the Hour dans la MEA par type de service
              • Service de maintenance
              • Service de réparation
              • Soutien opérationnel
              • Services de formation
            • Marché Power by the Hour dans la MEA par type d'équipement
              • Moteur à combustion interne
              • Turbine à gaz
              • Turbine à vapeur
            • Marché Power by the Hour dans la MEA par type d'industrie d'utilisation finale
              • Aéronautique
              • Maritime
              • Industriel
              • Production d'énergie
            • Marché Power by the Hour dans la MEA par type de modèle d'abonnement
              • Modèle à coût fixe
              • Modèle à coût variable
              • Modèle à coût mixte
            • Marché Power by the Hour dans la MEA par type régional
              • Pays du CCG
              • Afrique du Sud
              • Reste de la MEA
            • Perspectives des pays du CCG (milliards USD, 2019-2032)
            • Marché Power by the Hour dans les pays du CCG par type de service
              • Service de maintenance
              • Service de réparation
              • Soutien opérationnel
              • Services de formation
            • Marché Power by the Hour dans les pays du CCG par type d'équipement
              • Moteur à combustion interne
              • Turbine à gaz
              • Turbine à vapeur
            • Marché Power by the Hour dans les pays du CCG par type d'industrie d'utilisation finale
              • Aéronautique
              • Maritime
              • Industriel
              • Production d'énergie
            • Marché Power by the Hour dans les pays du CCG par type de modèle d'abonnement
              • Modèle à coût fixe
              • Modèle à coût variable
              • Modèle à coût mixte
            • Perspectives de l'Afrique du Sud (milliards USD, 2019-2032)
            • Marché Power by the Hour en Afrique du Sud par type de service
              • Service de maintenance
              • Service de réparation
              • Soutien opérationnel
              • Services de formation
            • Marché Power by the Hour en Afrique du Sud par type d'équipement
              • Moteur à combustion interne
              • Turbine à gaz
              • Turbine à vapeur
            • Marché Power by the Hour en Afrique du Sud par type d'industrie d'utilisation finale
              • Aéronautique
              • Maritime
              • Industriel
              • Production d'énergie
            • Marché Power by the Hour en Afrique du Sud par type de modèle d'abonnement
              • Modèle à coût fixe
              • Modèle à coût variable
              • Modèle à coût mixte
            • Perspectives du reste de la MEA (milliards USD, 2019-2032)
            • Marché Power by the Hour dans le reste de la MEA par type de service
              • Service de maintenance
              • Service de réparation
              • Soutien opérationnel
              • Services de formation
            • Marché Power by the Hour dans le reste de la MEA par type d'équipement
              • Moteur à combustion interne
              • Turbine à gaz
              • Turbine à vapeur
            • Marché Power by the Hour dans le reste de la MEA par type d'industrie d'utilisation finale
              • Aéronautique
              • Maritime
              • Industriel
              • Production d'énergie
            • Marché Power by the Hour dans le reste de la MEA par type de modèle d'abonnement
              • Modèle à coût fixe
              • Modèle à coût variable
              • Modèle à coût mixte

Compare Licence

×
Features License Type
Single User Multiuser License Enterprise User
Price $4,950 $5,950 $7,250
Maximum User Access Limit 1 User Upto 10 Users Unrestricted Access Throughout the Organization
Free Customization
Direct Access to Analyst
Deliverable Format
Platform Access
Discount on Next Purchase 10% 15% 15%
Printable Versions