

Segmentation du marché des outils manuels mécaniques
Perspectives par type d'outils manuels mécaniques (en millions USD, 2018-2030)
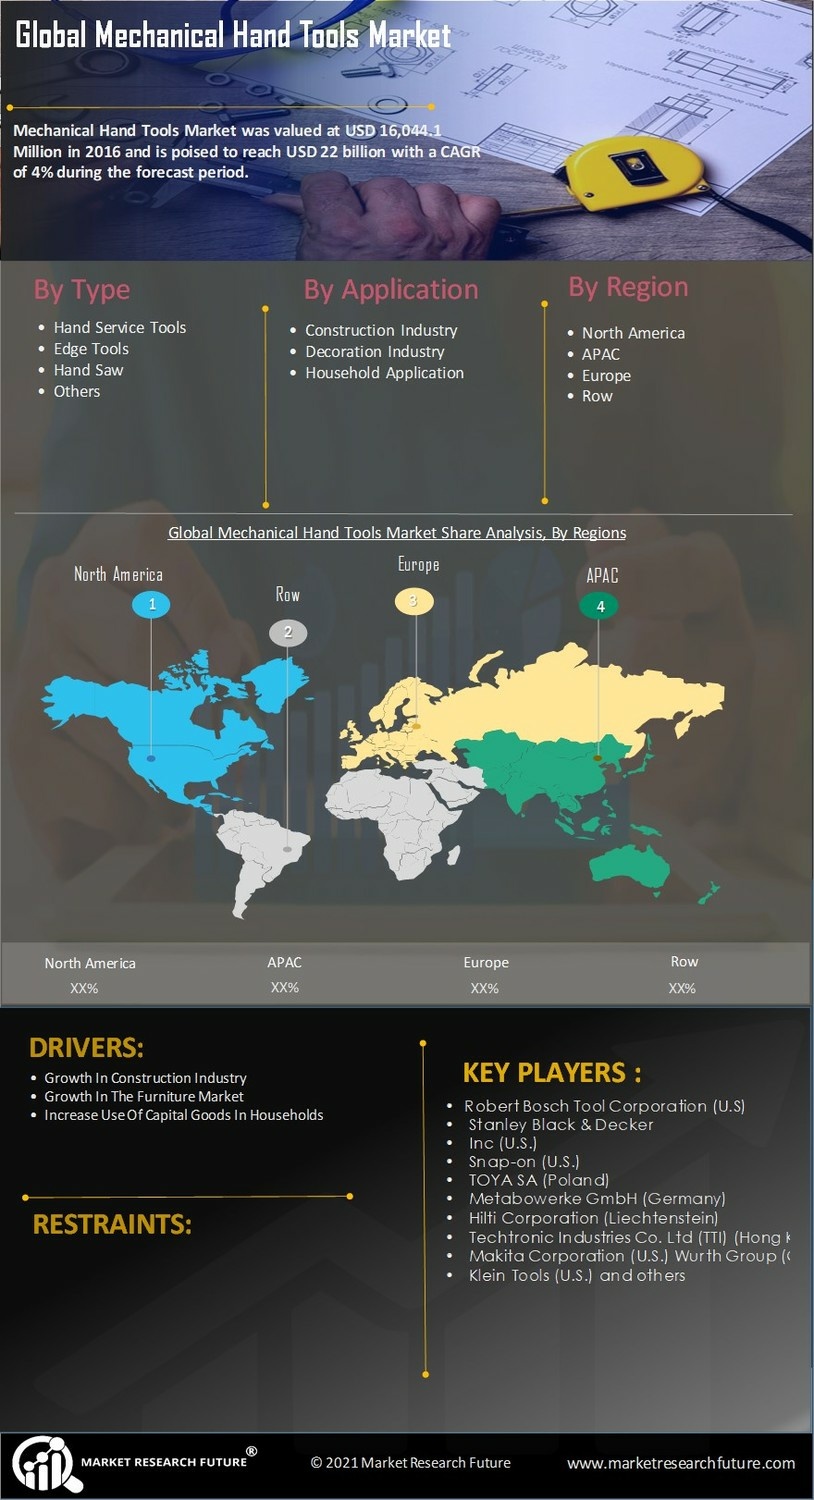
Outils manuels d'entretien
Outils tranchants
Scies à main
Autres
Perspectives des applications des outils manuels mécaniques (en millions USD, 2018-2030)
Industrie de la construction
Industrie de la décoration
Applications ménagères
Perspectives régionales des outils manuels mécaniques (en millions USD, 2018-2030)
-
Perspectives pour l'Amérique du Nord (en millions de dollars américains, 2018-2030)
-
Outils mécaniques à main en Amérique du Nord par type
Outils manuels d'entretien
Outils tranchants
Scies à main
Autres
-
Outils mécaniques à main en Amérique du Nord par application
Industrie de la construction
Industrie de la décoration
Applications domestiques
États-Unis Perspectives (en millions de dollars américains, 2018-2030) Prévision ... 2018-2030)
-
CANADA Outils mécaniques à main par type
Outils manuels d'entretien
Outils tranchants
Scies à main
Autres
-
CANADA Outils mécaniques à main par application
Industrie de la construction
Industrie de la décoration
Applications domestiques
-
Perspectives pour l'Europe (en millions USD) 2018-2030)
-
Outils mécaniques à main en Europe par type
Outils manuels d'entretien
Outils tranchants
Scies à main
Autres
-
Outils mécaniques à main en Europe par application
Industrie de la construction
Industrie de la décoration
Applications domestiques
Allemagne Perspectives (en millions USD, 2018-2030)
-
Outils mécaniques à main en Allemagne par type
Outils manuels d'entretien
Outils tranchants
Scies à main
Autres
-
Outils mécaniques à main en Allemagne par application
Industrie de la construction
Industrie de la décoration
Applications domestiques
Perspectives pour la France (en millions de dollars US, 2018-2030)
-
Outils mécaniques à main en France par Type
Outils manuels
Outils tranchants
Scies à main
Autres
-
Outils manuels mécaniques en France par application
Bâtiment
Décoration
Applications domestiques
Perspectives pour le Royaume-Uni (en millions de dollars américains, 2018-2030)
-
Outils manuels mécaniques au Royaume-Uni par type
Service manuel Outils
Outils de bord
Scies à main
Autres
-
Outils mécaniques à main au Royaume-Uni par application
Secteur de la construction
Secteur de la décoration
Applications domestiques
Perspectives pour l'ITALIE (en millions de dollars US, 2018-2030)
-
Outils mécaniques à main en Italie par type
Outils d'entretien manuels
Bordures Outils
Scies à main
Autres
-
ITALIE Outils manuels mécaniques par application
Bâtiment
Décoration
Applications domestiques
ESPAGNEPerspectives (millions USD, 2018-2030)
-
Espagne Outils manuels mécaniques par type
Outils manuels d'entretien
Outils tranchants
À main Scie
Autres
-
Outils mécaniques à main en Espagne par application
Secteur de la construction
Secteur de la décoration
Applications domestiques
Perspectives pour le reste de l'Europe (en millions de dollars US, 2018-2030)
-
RESTE DE L'EUROPE : Outils mécaniques à main par type
Outils manuels d'entretien
Outils tranchants
À main Scie
Autres
-
RESTE DE L'EUROPE : Outils manuels mécaniques par application
Bâtiment
Décoration
Applications domestiques
Perspectives Asie-Pacifique (en millions USD, 2018-2030)
-
Outils manuels mécaniques par type en Asie-Pacifique
Outils manuels d'entretien
Outils tranchants
À main Scie
Autres
-
Outils mécaniques à main en Asie-Pacifique par application
Secteur de la construction
Secteur de la décoration
Applications domestiques
Perspectives pour la Chine (en millions de dollars américains, 2018-2030)
-
Outils mécaniques à main en Chine par type
Outils manuels d'entretien
Outils tranchants
À main Scie
Autres
-
Outils mécaniques à main en Chine par application
Secteur de la construction
Secteur de la décoration
Applications domestiques
Perspectives du Japon (en millions de dollars américains, 2018-2030)
-
Outils mécaniques à main au Japon par type
Outils manuels d'entretien
Outils tranchants
À main Scie
Autres
-
Outils mécaniques à main au Japon par application
Secteur de la construction
Secteur de la décoration
Applications domestiques
Perspectives pour l'Inde (en millions de dollars américains, 2018-2030)
-
Outils mécaniques à main en Inde par type
Outils manuels d'entretien
Outils tranchants
À main Scie
Autres
-
Outils mécaniques à main en Inde par application
Bâtiment
Décoration
Applications domestiques
Perspectives pour l'Australie (en millions de dollars américains, 2018-2030)
-
Outils mécaniques à main en Australie par type
Outils manuels d'entretien
Outils tranchants
À main Scie
Autres
-
Outils mécaniques à main en Australie par application
Secteur de la construction
Secteur de la décoration
Applications domestiques
Perspectives pour le reste de l'Asie-Pacifique (en millions de dollars américains, 2018-2030)
-
Outils mécaniques à main pour le reste de l'Asie-Pacifique par type
Outils manuels d'entretien
Outils tranchants
À main Scie
Autres
-
Outils manuels mécaniques pour le reste de l'Asie-Pacifique, par application
Bâtiment
Décoration
Applications domestiques
Perspectives pour le reste du monde (en millions de dollars américains, 2018-2030)
-
Outils manuels mécaniques pour le reste du monde, par type
Outils manuels d'entretien
Outils tranchants
À main Scie
Autres
-
Outils manuels mécaniques dans le reste du monde par application
Bâtiment
Décoration
Applications domestiques
Perspectives pour le Moyen-Orient (en millions de dollars américains, 2018-2030)
-
Outils manuels mécaniques au Moyen-Orient par type
Outils manuels d'entretien
Outils tranchants
À main Scie
Autres
-
Outils manuels mécaniques au Moyen-Orient par application
Bâtiment
Décoration
Applications domestiques
Perspectives pour l'Afrique (en millions de dollars US, 2018-2030)
-
Outils manuels mécaniques en Afrique par type
Outils manuels d'entretien
Outils tranchants
À main Scie
Autres
-
Outils mécaniques à main en Afrique par application
Bâtiment
Décoration
Applications domestiques
Perspectives pour l'Amérique latine (en millions de dollars américains, 2018-2030)
-
Outils mécaniques à main en Amérique latine par type
Outils manuels d'entretien
Outils tranchants
À main Scie
Autres
-
Outils mécaniques à main en Amérique latine par application
Bâtiment
Décoration
Applications domestiques


