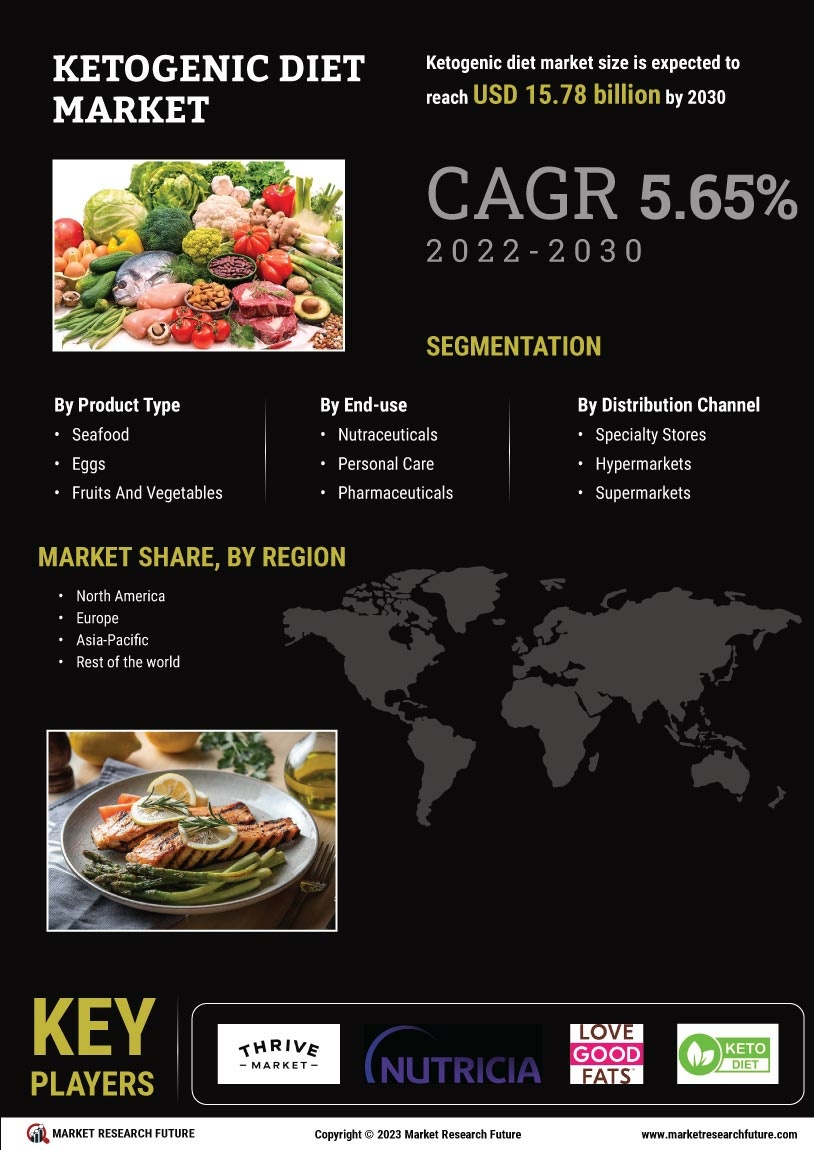


Segmentation du marché
Perspectives des types de produits de régime cétogène (milliards USD, 2018-2032)
- Fruits Légumes
- Noix Graines
- Boissons
- Viande
- Poulet Oeufs
- Fruits de mer
- Autres
Perspectives des canaux de distribution de régime cétogène (milliards USD, 2018-2032)
- Basé en magasin
- Non basé en magasin
Perspectives régionales du régime cétogène (milliards USD, 2018-2032)
- Perspectives de l'Amérique du Nord (milliards USD, 2018-2032)
- Régime cétogène en Amérique du Nord par type de produit
- Fruits Légumes
- Noix Graines
- Boissons
- Viande
- Poulet Oeufs
- Fruits de mer
- Autres
- Régime cétogène en Amérique du Nord par canal de distribution
- Basé en magasin
- Non basé en magasin
- Perspectives des États-Unis (milliards USD, 2018-2032)
- Régime cétogène aux États-Unis par type de produit
- Fruits Légumes
- Noix Graines
- Boissons
- Viande
- Poulet Oeufs
- Fruits de mer
- Autres
- Régime cétogène aux États-Unis par canal de distribution
- Basé en magasin
- Non basé en magasin
- Perspectives du CANADA (milliards USD, 2018-2032)
- Régime cétogène au CANADA par type de produit
- Fruits Légumes
- Noix Graines
- Boissons
- Viande
- Poulet Oeufs
- Fruits de mer
- Autres
- Régime cétogène au CANADA par canal de distribution
- Basé en magasin
- Non basé en magasin
- Perspectives de l'Europe (milliards USD, 2018-2032)
- Régime cétogène en Europe par type de produit
- Fruits Légumes
- Noix Graines
- Boissons
- Viande
- Poulet Oeufs
- Fruits de mer
- Autres
- Régime cétogène en Europe par canal de distribution
- Basé en magasin
- Non basé en magasin
- Allemagne Perspectives (milliards USD, 2018-2032)
- Régime cétogène en Allemagne par type de produit
- Fruits Légumes
- Noix Graines
- Boissons
- Viande
- Poulet Oeufs
- Fruits de mer
- Autres
- Régime cétogène en Allemagne par canal de distribution
- Basé en magasin
- Non basé en magasin
- France Perspectives (milliards USD, 2018-2032)
- Régime cétogène en France par type de produit
- Fruits Légumes
- Noix Graines
- Boissons
- Viande
- Poulet Oeufs
- Fruits de mer
- Autres
- Régime cétogène en France par canal de distribution
- Basé en magasin
- Non basé en magasin
- Royaume-Uni Perspectives (milliards USD, 2018-2032)
- Régime cétogène au Royaume-Uni par type de produit
- Fruits Légumes
- Noix Graines
- Boissons
- Viande
- Poulet Oeufs
- Fruits de mer
- Autres
- Régime cétogène au Royaume-Uni par canal de distribution
- Basé en magasin
- Non basé en magasin
- ITALIE Perspectives (milliards USD, 2018-2032)
- Régime cétogène en ITALIE par type de produit
- Fruits Légumes
- Noix Graines
- Boissons
- Viande
- Poulet Oeufs
- Fruits de mer
- Autres
- Régime cétogène en ITALIE par canal de distribution
- Basé en magasin
- Non basé en magasin
- ESPAGNE Perspectives (milliards USD, 2018-2032)
- Régime cétogène en Espagne par type de produit
- Fruits Légumes
- Noix Graines
- Boissons
- Viande
- Poulet Oeufs
- Fruits de mer
- Autres
- Régime cétogène en Espagne par canal de distribution
- Basé en magasin
- Non basé en magasin
- Reste de l'Europe Perspectives (milliards USD, 2018-2032)
- Régime cétogène dans le reste de l'Europe par type de produit
- Fruits Légumes
- Noix Graines
- Boissons
- Viande
- Poulet Oeufs
- Fruits de mer
- Autres
- Régime cétogène dans le reste de l'Europe par canal de distribution
- Basé en magasin
- Non basé en magasin
- Perspectives de l'Asie-Pacifique (milliards USD, 2018-2032)
- Régime cétogène en Asie-Pacifique par type de produit
- Fruits Légumes
- Noix Graines
- Boissons
- Viande
- Poulet Oeufs
- Fruits de mer
- Autres
- Régime cétogène en Asie-Pacifique par canal de distribution
- Basé en magasin
- Non basé en magasin
- Chine Perspectives (milliards USD, 2018-2032)
- Régime cétogène en Chine par type de produit
- Fruits Légumes
- Noix Graines
- Boissons
- Viande
- Poulet Oeufs
- Fruits de mer
- Autres
- Régime cétogène en Chine par canal de distribution
- Basé en magasin
- Non basé en magasin
- Japon Perspectives (milliards USD, 2018-2032)
- Régime cétogène au Japon par type de produit
- Fruits Légumes
- Noix Graines
- Boissons
- Viande
- Poulet Oeufs
- Fruits de mer
- Autres
- Régime cétogène au Japon par canal de distribution
- Basé en magasin
- Non basé en magasin
- Inde Perspectives (milliards USD, 2018-2032)
- Régime cétogène en Inde par type de produit
- Fruits Légumes
- Noix Graines
- Boissons
- Viande
- Poulet Oeufs
- Fruits de mer
- Autres
- Régime cétogène en Inde par canal de distribution
- Basé en magasin
- Non basé en magasin
- Australie Perspectives (milliards USD, 2018-2032)
- Régime cétogène en Australie par type de produit
- Fruits Légumes
- Noix Graines
- Boissons
- Viande
- Poulet Oeufs
- Fruits de mer
- Autres
- Régime cétogène en Australie par canal de distribution
- Basé en magasin
- Non basé en magasin
- Reste de l'Asie-Pacifique Perspectives (milliards USD, 2018-2032)
- Régime cétogène dans le reste de l'Asie-Pacifique par type de produit
- Fruits Légumes
- Noix Graines
- Boissons
- Viande
- Poulet Oeufs
- Fruits de mer
- Autres
- Régime cétogène dans le reste de l'Asie-Pacifique par canal de distribution
- Basé en magasin
- Non basé en magasin
- Reste du monde Perspectives (milliards USD, 2018-2032)
- Régime cétogène dans le reste du monde par type de produit
- Fruits Légumes
- Noix Graines
- Boissons
- Viande
- Poulet Oeufs
- Fruits de mer
- Autres
- Régime cétogène dans le reste du monde par canal de distribution
- Basé en magasin
- Non basé en magasin
- Perspectives du Moyen-Orient (milliards USD, 2018-2032)
- Régime cétogène au Moyen-Orient par type de produit
- Fruits Légumes
- Noix Graines
- Boissons
- Viande
- Poulet Oeufs
- Fruits de mer
- Autres
- Régime cétogène au Moyen-Orient par canal de distribution
- Basé en magasin
- Non basé en magasin
- Africa Perspectives (milliards USD, 2018-2032)
- Régime cétogène en Afrique par type de produit
- Fruits Légumes
- Noix Graines
- Boissons
- Viande
- Poulet Oeufs
- Fruits de mer
- Autres
- Régime cétogène en Afrique par canal de distribution
- Basé en magasin
- Non basé en magasin
- Perspectives de l'Amérique Latine (milliards USD, 2018-2032)
- Régime cétogène en Amérique Latine par type de produit
- Fruits Légumes
- Noix Graines
- Boissons
- Viande
- Poulet Oeufs
- Fruits de mer
- Autres
- Régime cétogène en Amérique Latine par canal de distribution
- Basé en magasin
- Non basé en magasin
- Régime cétogène dans le reste du monde par type de produit
- Régime cétogène dans le reste de l'Asie-Pacifique par type de produit
- Régime cétogène en Asie-Pacifique par type de produit
- Régime cétogène en Europe par type de produit
- Régime cétogène en Amérique du Nord par type de produit


