Request Free Sample ×

Kindly complete the form below to receive a free sample of this Report

* Please use a valid business email

Leading companies partner with us for data-driven Insights

clients tt-cursor
Hero Background

Marché des plates-formes jackup

ID: MRFR/EnP/1965-CR
128 Pages
Priya Nagrale
Last Updated: April 02, 2026

Rapport de recherche sur le marché des plates-formes jackup Informations par type (jackup à jambes indépendantes, jackup à mat supporté), par profondeur d'opération (eaux peu profondes, eaux profondes et eaux ultra-profondes), par application (pétrole et gaz et installations d'éoliennes offshore) et par région - Prévisions mondiales jusqu'en 2035

Partager
Download PDF ×

We do not share your information with anyone. However, we may send you emails based on your report interest from time to time. You may contact us at any time to opt-out.

Jackup Rigs Market Infographic
Purchase Options
  1. 1 résumé exécutif
    1. 1.1 ANALYSE DE L'ATTRACTIVITÉ DU MARCHÉ
      1. 1.1.1 marché mondial de l'acide crotonique, par APPLICATION
      2. 1.1.2 marché mondial de l'acide crotonique, par INDUSTRIE D'UTILISATION FINAL
      3. 1.1.3 MARCHÉ MONDIAL DE L'ACIDE CROTONIQUE, PAR RÉGION
  2. 2 INTRODUCTION AU MARCHÉ
    1. 2.1 DÉFINITION
    2. 2.2 PORTÉE DE L'ÉTUDE
    3. 2.3 STRUCTURE DU MARCHÉ
  3. 3 MÉTHODOLOGIE DE RECHERCHE
    1. 3.1 PROCESSUS DE RECHERCHE
    2. 3.2 RECHERCHE PRIMAIRE
    3. 3.3 RECHERCHE SECONDAIRE
    4. 3.4 ESTIMATION DE LA TAILLE DU MARCHÉ
    5. 3.5 APPROCHE DE HAUT EN BAS et DE BAS EN HAUT
    6. 3.6 MODÈLE DE PRÉVISION
    7. 3.7 LISTE DES HYPOTHÈSES & LIMITATIONS
  4. 4 dynamique du marché
    1. 4.1 introduction
    2. 4.2 Facteurs moteurs
      1. 4.2.1 Augmentation des applications industrielles
      2. 4.2.2 Augmentation de la demande de chimie verte et de durabilité
    3. 4.3 contraintes
      1. 4.3.1 Toxicité et manipulation
    4. 4.4 opportunités
      1. 4.4.1 Avancées technologiques associées à l'acide crotonique
  5. 5 Analyse des facteurs du marché
    1. 5.1 analyse de la chaîne d'approvisionnement
      1. 5.1.1 FOURNISSEURS DE MATÉRIAUX BRUTS
      2. 5.1.2 Fabricants d'acide crotonique
      3. 5.1.3 Canaux de distribution & de vente
      4. 5.1.4 Utilisateurs finaux
    2. 5.2 Analyse des Cinq Forces de Porter
      1. 5.2.1 menace de nouveaux entrants
      2. 5.2.2 pouvoir de négociation des fournisseurs
      3. 5.2.3 menace de substituts
      4. 5.2.4 pouvoir de négociation des acheteurs
      5. 5.2.5 intensité de la rivalité
    3. 5.3 Analyse des prix (USD/Ton), par région, 2019–2022
    4. 5.4 impact de la covid 19 SUR LE marché mondial de l'acide crotonique
      1. 5.4.1 Scénario de production
      2. 5.4.2 Impact sur la chaîne d'approvisionnement
  6. 6 MARCHÉ MONDIAL DE L'ACIDE CROTONIQUE, PAR APPLICATION
    1. 6.1 APERÇU
    2. 6.2 Résines adhésives
    3. 6.3 Revêtements
    4. 6.4 Plastifiants
    5. 6.5 Fongicides
    6. 6.6 Autres
  7. 7 MARCHÉ MONDIAL DE L'ACIDE CROTONIQUE, PAR INDUSTRIE D'UTILISATION FINAL
    1. 7.1 APERÇU
    2. 7.2 Chimique
    3. 7.3 Pharmaceutique
    4. 7.4 PEINTURES ET REVÊTEMENTS
    5. 7.5 Automobiles
    6. 7.6 Emballage
    7. 7.7 Textile
    8. 7.8 Autres
  8. 8 MARCHÉ MONDIAL DE L'ACIDE CROTONIQUE, PAR RÉGION
    1. 8.1 APERÇU
    2. 8.2 AMÉRIQUE DU NORD
      1. 8.2.1 É.-U.
      2. 8.2.2 Canada
    3. 8.3 Europe
      1. 8.3.1 Allemagne
      2. 8.3.2 Russie
      3. 8.3.3 Italie
      4. 8.3.4 France
      5. 8.3.5 Espagne
      6. 8.3.6 Royaume-Uni
      7. 8.3.7 Reste de l'Europe
    4. 8.4 Asie-Pacifique
      1. 8.4.1 Chine
      2. 8.4.2 Inde
      3. 8.4.3 Japon
      4. 8.4.4 Australie & Nouvelle-Zélande
      5. 8.4.5 Corée du Sud
      6. 8.4.6 Reste de l'Asie-Pacifique
    5. 8.5 Amérique Latine
      1. 8.5.1 Brésil
      2. 8.5.2 Mexique
      3. 8.5.3 Argentine
      4. 8.5.4 Reste de l'Amérique Latine
    6. 8.6 Moyen-Orient & Afrique
      1. 8.6.1 Turquie
      2. 8.6.2 Afrique du Sud
      3. 8.6.3 Pays du CCG
      4. 8.6.4 Reste du Moyen-Orient & Afrique
  9. 9 PAYSAGE CONCURRENTIEL
    1. 9.1 APERÇU CONCURRENTIEL
    2. 9.2 Analyse de la stratégie de marché mondial
    3. 9.3 ÉVALUATION CONCURRENTIELLE
    4. 9.4 DÉVELOPPEMENTS CLÉS
  10. 10 PROFILS D'ENTREPRISES
    1. 10.1 Tianjin Jinhui Pharmaceutical Group Co. Ltd
      1. 10.1.1 APERÇU DE L'ENTREPRISE
      2. 10.1.2 APERÇU FINANCIER
      3. 10.1.3 PRODUITS OFFERTS
      4. 10.1.4 DÉVELOPPEMENTS CLÉS
      5. 10.1.5 ANALYSE SWOT
      6. 10.1.6 STRATÉGIES CLÉS
    2. 10.2 Kono Chem Co. Ltd
      1. 10.2.1 APERÇU DE L'ENTREPRISE
      2. 10.2.2 APERÇU FINANCIER
      3. 10.2.3 PRODUITS OFFERTS
      4. 10.2.4 DÉVELOPPEMENTS CLÉS
      5. 10.2.5 ANALYSE SWOT
      6. 10.2.6 STRATÉGIES CLÉS
    3. 10.3 WeylChem International GmbH.
      1. 10.3.1 APERÇU DE L'ENTREPRISE
      2. 10.3.2 APERÇU FINANCIER
      3. 10.3.3 PRODUITS OFFERTS
      4. 10.3.4 DÉVELOPPEMENTS CLÉS
      5. 10.3.5 ANALYSE SWOT
      6. 10.3.6 STRATÉGIES CLÉS
    4. 10.4 Zhengzhou Tuozhixiang Trading Co.Ltd
      1. 10.4.1 APERÇU DE L'ENTREPRISE
      2. 10.4.2 APERÇU FINANCIER
      3. 10.4.3 PRODUITS OFFERTS
      4. 10.4.4 DÉVELOPPEMENTS CLÉS
      5. 10.4.5 ANALYSE SWOT
      6. 10.4.6 STRATÉGIES CLÉS
    5. 10.5 EUCLID.
      1. 10.5.1 APERÇU DE L'ENTREPRISE
      2. 10.5.2 APERÇU FINANCIER
      3. 10.5.3 PRODUITS OFFERTS
      4. 10.5.4 DÉVELOPPEMENTS CLÉS
      5. 10.5.5 ANALYSE SWOT
      6. 10.5.6 STRATÉGIES CLÉS
    6. 10.6 Central Drug House (P) Ltd
      1. 10.6.1 APERÇU DE L'ENTREPRISE
      2. 10.6.2 APERÇU FINANCIER
      3. 10.6.3 PRODUITS OFFERTS
      4. 10.6.4 DÉVELOPPEMENTS CLÉS
      5. 10.6.5 ANALYSE SWOT
      6. 10.6.6 STRATÉGIES CLÉS
    7. 10.7 Henan Tianfu Chemical Co. Ltd
      1. 10.7.1 APERÇU DE L'ENTREPRISE
      2. 10.7.2 APERÇU FINANCIER
      3. 10.7.3 PRODUITS OFFERTS
      4. 10.7.4 DÉVELOPPEMENTS CLÉS
      5. 10.7.5 ANALYSE SWOT
      6. 10.7.6 STRATÉGIES CLÉS
    8. 10.8 ALB Technology Limited.
      1. 10.8.1 APERÇU DE L'ENTREPRISE
      2. 10.8.2 APERÇU FINANCIER
      3. 10.8.3 PRODUITS OFFERTS
      4. 10.8.4 DÉVELOPPEMENTS CLÉS
      5. 10.8.5 ANALYSE SWOT
      6. 10.8.6 STRATÉGIES CLÉS
    9. 10.9 Penta Manufacturing Company
      1. 10.9.1 APERÇU DE L'ENTREPRISE
      2. 10.9.2 APERÇU FINANCIER
      3. 10.9.3 PRODUITS OFFERTS
      4. 10.9.4 DÉVELOPPEMENTS CLÉS
      5. 10.9.5 ANALYSE SWOT
      6. 10.9.6 STRATÉGIES CLÉS
    10. 10.10 Spectrum Chemical Manufacturing Corporation.
      1. 10.10.1 APERÇU DE L'ENTREPRISE
      2. 10.10.2 APERÇU FINANCIER
      3. 10.10.3 PRODUITS OFFERTS
      4. 10.10.4 DÉVELOPPEMENTS CLÉS
      5. 10.10.5 ANALYSE SWOT
      6. 10.10.6 STRATÉGIES CLÉS
  11. 11 ANNEXE
    1. 11.1 RÉFÉRENCES
    2. 11.2 RAPPORTS LIÉS
    3. LISTE DES TABLEAUX
    4. TABLEAU 1 LISTE DES HYPOTHÈSES & LIMITATIONS
    5. TABLEAU 2 ESTIMATIONS & PRÉVISIONS DU MARCHÉ DE L'ACIDE CROTONIQUE, PAR APPLICATION, 2024–2030 (MILLIONS USD)
    6. TABLEAU 3 ESTIMATIONS & PRÉVISIONS DU MARCHÉ DE L'ACIDE CROTONIQUE, PAR APPLICATION, 2024–2030 (MILLIONS DE MÈTRES CARRÉS)
    7. TABLEAU 4 ESTIMATIONS & PRÉVISIONS DU MARCHÉ DES RÉSINES ADHÉSIVES, PAR RÉGION, 2024–2030 (MILLIONS USD)
    8. TABLEAU 5 ESTIMATIONS & PRÉVISIONS DU MARCHÉ DES RÉSINES ADHÉSIVES, PAR RÉGION, 2024–2030 (MILLIONS DE MÈTRES CARRÉS)
    9. TABLEAU 6 ESTIMATIONS & PRÉVISIONS DU MARCHÉ DES REVÊTEMENTS, PAR RÉGION, 2024–2030 (MILLIONS USD)
    10. TABLEAU 7 ESTIMATIONS & PRÉVISIONS DU MARCHÉ DES REVÊTEMENTS, PAR RÉGION, 2024–2030 (MILLIONS DE MÈTRES CARRÉS)
    11. TABLEAU 8 ESTIMATIONS & PRÉVISIONS DU MARCHÉ DES PLASTIFIANTS, PAR RÉGION, 2024–2030 (MILLIONS USD)
    12. TABLEAU 9 ESTIMATIONS & PRÉVISIONS DU MARCHÉ DES PLASTIFIANTS, PAR RÉGION, 2024–2030 (MILLIONS DE MÈTRES CARRÉS)
    13. TABLEAU 10 ESTIMATIONS & PRÉVISIONS DU MARCHÉ DES FONGICIDES, PAR RÉGION, 2024–2030 (MILLIONS USD)
    14. TABLEAU 11 ESTIMATIONS & PRÉVISIONS DU MARCHÉ DES FONGICIDES, PAR RÉGION, 2024–2030 (MILLIONS DE MÈTRES CARRÉS)
    15. TABLEAU 12 ESTIMATIONS & PRÉVISIONS DU MARCHÉ DES AUTRES, PAR RÉGION, 2024–2030 (MILLIONS USD)
    16. TABLEAU 13 ESTIMATIONS & PRÉVISIONS DU MARCHÉ DES AUTRES, PAR RÉGION, 2024–2030 (MILLIONS DE MÈTRES CARRÉS)
    17. TABLEAU 14 ESTIMATIONS & PRÉVISIONS DU MARCHÉ DE L'ACIDE CROTONIQUE, PAR INDUSTRIE D'UTILISATION FINAL, 2024–2030 (MILLIONS USD)
    18. TABLEAU 15 ESTIMATIONS & PRÉVISIONS DU MARCHÉ DE L'ACIDE CROTONIQUE, PAR INDUSTRIE D'UTILISATION FINAL, 2024–2030 (MILLIONS DE MÈTRES CARRÉS)
    19. TABLEAU 16 ESTIMATIONS & PRÉVISIONS DU MARCHÉ CHIMIQUE, PAR RÉGION, 2024–2030 (MILLIONS USD)
    20. TABLEAU 17 ESTIMATIONS & PRÉVISIONS DU MARCHÉ CHIMIQUE, PAR RÉGION, 2024–2030 (MILLIONS DE MÈTRES CARRÉS)
    21. TABLEAU 18 ESTIMATIONS & PRÉVISIONS DU MARCHÉ PHARMACEUTIQUE, PAR RÉGION, 2024–2030 (MILLIONS USD)
    22. TABLEAU 19 ESTIMATIONS & PRÉVISIONS DU MARCHÉ PHARMACEUTIQUE, PAR RÉGION, 2024–2030 (MILLIONS DE MÈTRES CARRÉS)
    23. TABLEAU 20 ESTIMATIONS & PRÉVISIONS DU MARCHÉ DES PEINTURES & REVÊTEMENTS, PAR RÉGION, 2024–2030 (MILLIONS USD)
    24. TABLEAU 21 ESTIMATIONS & PRÉVISIONS DU MARCHÉ DES PEINTURES & REVÊTEMENTS, PAR RÉGION, 2024–2030 (MILLIONS DE MÈTRES CARRÉS)
    25. TABLEAU 22 ESTIMATIONS & PRÉVISIONS DU MARCHÉ AUTOMOBILE, PAR RÉGION, 2024–2030 (MILLIONS USD)
    26. TABLEAU 23 ESTIMATIONS & PRÉVISIONS DU MARCHÉ AUTOMOBILE, PAR RÉGION, 2024–2030 (MILLIONS DE MÈTRES CARRÉS)
    27. TABLEAU 24 ESTIMATIONS & PRÉVISIONS DU MARCHÉ DE L'EMBALLAGE, PAR RÉGION, 2024–2030 (MILLIONS USD)
    28. TABLEAU 25 ESTIMATIONS & PRÉVISIONS DU MARCHÉ DE L'EMBALLAGE, PAR RÉGION, 2024–2030 (MILLIONS DE MÈTRES CARRÉS)
    29. TABLEAU 26 ESTIMATIONS & PRÉVISIONS DU MARCHÉ TEXTILE, PAR RÉGION, 2024–2030 (MILLIONS USD)
    30. TABLEAU 27 ESTIMATIONS & PRÉVISIONS DU MARCHÉ TEXTILE, PAR RÉGION, 2024–2030 (MILLIONS DE MÈTRES CARRÉS)
    31. TABLEAU 28 ESTIMATIONS & PRÉVISIONS DU MARCHÉ DES AUTRES, PAR RÉGION, 2024–2030 (MILLIONS USD)
    32. TABLEAU 29 ESTIMATIONS & PRÉVISIONS DU MARCHÉ DES AUTRES, PAR RÉGION, 2024–2030 (MILLIONS DE MÈTRES CARRÉS)
    33. TABLEAU 30 MARCHÉ MONDIAL DE L'ACIDE CROTONIQUE, PAR RÉGION, 2024–2030 (MILLIONS USD)
    34. TABLEAU 31 MARCHÉ MONDIAL DE L'ACIDE CROTONIQUE, PAR RÉGION, 2024–2030 (MILLIONS DE MÈTRES CARRÉS)
    35. TABLEAU 32 AMÉRIQUE DU NORD : MARCHÉ DE L'ACIDE CROTONIQUE, PAR PAYS, 2024–2030 (MILLIONS USD)
    36. TABLEAU 33 AMÉRIQUE DU NORD : MARCHÉ DE L'ACIDE CROTONIQUE, PAR PAYS, 2024–2030 (MILLIONS DE MÈTRES CARRÉS)
    37. TABLEAU 34 AMÉRIQUE DU NORD : MARCHÉ DE L'ACIDE CROTONIQUE, PAR APPLICATION, 2024–2030 (MILLIONS USD)
    38. TABLEAU 35 AMÉRIQUE DU NORD : MARCHÉ DE L'ACIDE CROTONIQUE, PAR APPLICATION, 2024–2030 (MILLIONS DE MÈTRES CARRÉS)
    39. TABLEAU 36 AMÉRIQUE DU NORD : MARCHÉ DE L'ACIDE CROTONIQUE, PAR INDUSTRIE D'UTILISATION FINAL, 2024–2030 (MILLIONS USD)
    40. TABLEAU 37 AMÉRIQUE DU NORD : MARCHÉ DE L'ACIDE CROTONIQUE, PAR INDUSTRIE D'UTILISATION FINAL, 2024–2030 (MILLIONS DE MÈTRES CARRÉS)
    41. TABLEAU 38 É.-U. : MARCHÉ DE L'ACIDE CROTONIQUE, PAR APPLICATION, 2024–2030 (MILLIONS USD)
    42. TABLEAU 39 É.-U. : MARCHÉ DE L'ACIDE CROTONIQUE, PAR APPLICATION, 2024–2030 (MILLIONS DE MÈTRES CARRÉS)
    43. TABLEAU 40 É.-U. : MARCHÉ DE L'ACIDE CROTONIQUE, PAR INDUSTRIE D'UTILISATION FINAL, 2024–2030 (MILLIONS USD)
    44. TABLEAU 41 É.-U. : MARCHÉ DE L'ACIDE CROTONIQUE, PAR INDUSTRIE D'UTILISATION FINAL, 2024–2030 (MILLIONS DE MÈTRES CARRÉS)
    45. TABLEAU 42 CANADA : MARCHÉ DE L'ACIDE CROTONIQUE, PAR APPLICATION, 2024–2030 (MILLIONS USD)
    46. TABLEAU 43 CANADA : MARCHÉ DE L'ACIDE CROTONIQUE, PAR APPLICATION, 2024–2030 (MILLIONS DE MÈTRES CARRÉS)
    47. TABLEAU 44 CANADA : MARCHÉ DE L'ACIDE CROTONIQUE, PAR INDUSTRIE D'UTILISATION FINAL, 2024–2030 (MILLIONS USD)
    48. TABLEAU 45 CANADA : MARCHÉ DE L'ACIDE CROTONIQUE, PAR INDUSTRIE D'UTILISATION FINAL, 2024–2030 (MILLIONS DE MÈTRES CARRÉS)
    49. TABLEAU 46 EUROPE : MARCHÉ DE L'ACIDE CROTONIQUE, PAR PAYS, 2024–2030 (MILLIONS USD)
    50. TABLEAU 47 EUROPE : MARCHÉ DE L'ACIDE CROTONIQUE, PAR PAYS, 2024–2030 (MILLIONS DE MÈTRES CARRÉS)
    51. TABLEAU 48 EUROPE : MARCHÉ DE L'ACIDE CROTONIQUE, PAR APPLICATION, 2024–2030 (MILLIONS USD)
    52. TABLEAU 49 EUROPE : MARCHÉ DE L'ACIDE CROTONIQUE, PAR APPLICATION, 2024–2030 (MILLIONS DE MÈTRES CARRÉS)
    53. TABLEAU 50 EUROPE : MARCHÉ DE L'ACIDE CROTONIQUE, PAR INDUSTRIE D'UTILISATION FINAL, 2024–2030 (MILLIONS USD)
    54. TABLEAU 51 EUROPE : MARCHÉ DE L'ACIDE CROTONIQUE, PAR INDUSTRIE D'UTILISATION FINAL, 2024–2030 (MILLIONS DE MÈTRES CARRÉS)
    55. TABLEAU 52 ALLEMAGNE : MARCHÉ DE L'ACIDE CROTONIQUE, PAR APPLICATION, 2024–2030 (MILLIONS USD)
    56. TABLEAU 53 ALLEMAGNE : MARCHÉ DE L'ACIDE CROTONIQUE, PAR APPLICATION, 2024–2030 (MILLIONS DE MÈTRES CARRÉS)
    57. TABLEAU 54 ALLEMAGNE : MARCHÉ DE L'ACIDE CROTONIQUE, PAR INDUSTRIE D'UTILISATION FINAL, 2024–2030 (MILLIONS USD)
    58. TABLEAU 55 ALLEMAGNE : MARCHÉ DE L'ACIDE CROTONIQUE, PAR INDUSTRIE D'UTILISATION FINAL, 2024–2030 (MILLIONS DE MÈTRES CARRÉS)
    59. TABLEAU 56 RUSSIE : MARCHÉ DE L'ACIDE CROTONIQUE, PAR APPLICATION, 2024–2030 (MILLIONS USD)
    60. TABLEAU 57 RUSSIE : MARCHÉ DE L'ACIDE CROTONIQUE, PAR APPLICATION, 2024–2030 (MILLIONS DE MÈTRES CARRÉS)
    61. TABLEAU 58 RUSSIE : MARCHÉ DE L'ACIDE CROTONIQUE, PAR INDUSTRIE D'UTILISATION FINAL, 2024–2030 (MILLIONS USD)
    62. TABLEAU 59 RUSSIE : MARCHÉ DE L'ACIDE CROTONIQUE, PAR INDUSTRIE D'UTILISATION FINAL, 2024–2030 (MILLIONS DE MÈTRES CARRÉS)
    63. TABLEAU 60 ITALIE : MARCHÉ DE L'ACIDE CROTONIQUE, PAR APPLICATION, 2024–2030 (MILLIONS USD)
    64. TABLEAU 61 ITALIE : MARCHÉ DE L'ACIDE CROTONIQUE, PAR APPLICATION, 2024–2030 (MILLIONS DE MÈTRES CARRÉS)
    65. TABLEAU 62 ITALIE : MARCHÉ DE L'ACIDE CROTONIQUE, PAR INDUSTRIE D'UTILISATION FINAL, 2024–2030 (MILLIONS USD)
    66. TABLEAU 63 ITALIE : MARCHÉ DE L'ACIDE CROTONIQUE, PAR INDUSTRIE D'UTILISATION FINAL, 2024–2030 (MILLIONS DE MÈTRES CARRÉS)
    67. TABLEAU 64 FRANCE : MARCHÉ DE L'ACIDE CROTONIQUE, PAR APPLICATION, 2024–2030 (MILLIONS USD)
    68. TABLEAU 65 FRANCE : MARCHÉ DE L'ACIDE CROTONIQUE, PAR APPLICATION, 2024–2030 (MILLIONS DE MÈTRES CARRÉS)
    69. TABLEAU 66 FRANCE : MARCHÉ DE L'ACIDE CROTONIQUE, PAR INDUSTRIE D'UTILISATION FINAL, 2024–2030 (MILLIONS USD)
    70. TABLEAU 67 FRANCE : MARCHÉ DE L'ACIDE CROTONIQUE, PAR INDUSTRIE D'UTILISATION FINAL, 2024–2030 (MILLIONS DE MÈTRES CARRÉS)
    71. TABLEAU 68 ESPAGNE : MARCHÉ DE L'ACIDE CROTONIQUE, PAR APPLICATION, 2024–2030 (MILLIONS USD)
    72. TABLEAU 69 ESPAGNE : MARCHÉ DE L'ACIDE CROTONIQUE, PAR APPLICATION, 2024–2030 (MILLIONS DE MÈTRES CARRÉS)
    73. TABLEAU 70 ESPAGNE : MARCHÉ DE L'ACIDE CROTONIQUE, PAR INDUSTRIE D'UTILISATION FINAL, 2024–2030 (MILLIONS USD)
    74. TABLEAU 71 ESPAGNE : MARCHÉ DE L'ACIDE CROTONIQUE, PAR INDUSTRIE D'UTILISATION FINAL, 2024–2030 (MILLIONS DE MÈTRES CARRÉS)
    75. TABLEAU 72 ROYAUME-UNI : MARCHÉ DE L'ACIDE CROTONIQUE, PAR APPLICATION, 2024–2030 (MILLIONS USD)
    76. TABLEAU 73 ROYAUME-UNI : MARCHÉ DE L'ACIDE CROTONIQUE, PAR APPLICATION, 2024–2030 (MILLIONS DE MÈTRES CARRÉS)
    77. TABLEAU 74 ROYAUME-UNI : MARCHÉ DE L'ACIDE CROTONIQUE, PAR INDUSTRIE D'UTILISATION FINAL, 2024–2030 (MILLIONS USD)
    78. TABLEAU 75 ROYAUME-UNI : MARCHÉ DE L'ACIDE CROTONIQUE, PAR INDUSTRIE D'UTILISATION FINAL, 2024–2030 (MILLIONS DE MÈTRES CARRÉS)
    79. TABLEAU 76 RESTE DE L'EUROPE : MARCHÉ DE L'ACIDE CROTONIQUE, PAR APPLICATION, 2024–2030 (MILLIONS USD)

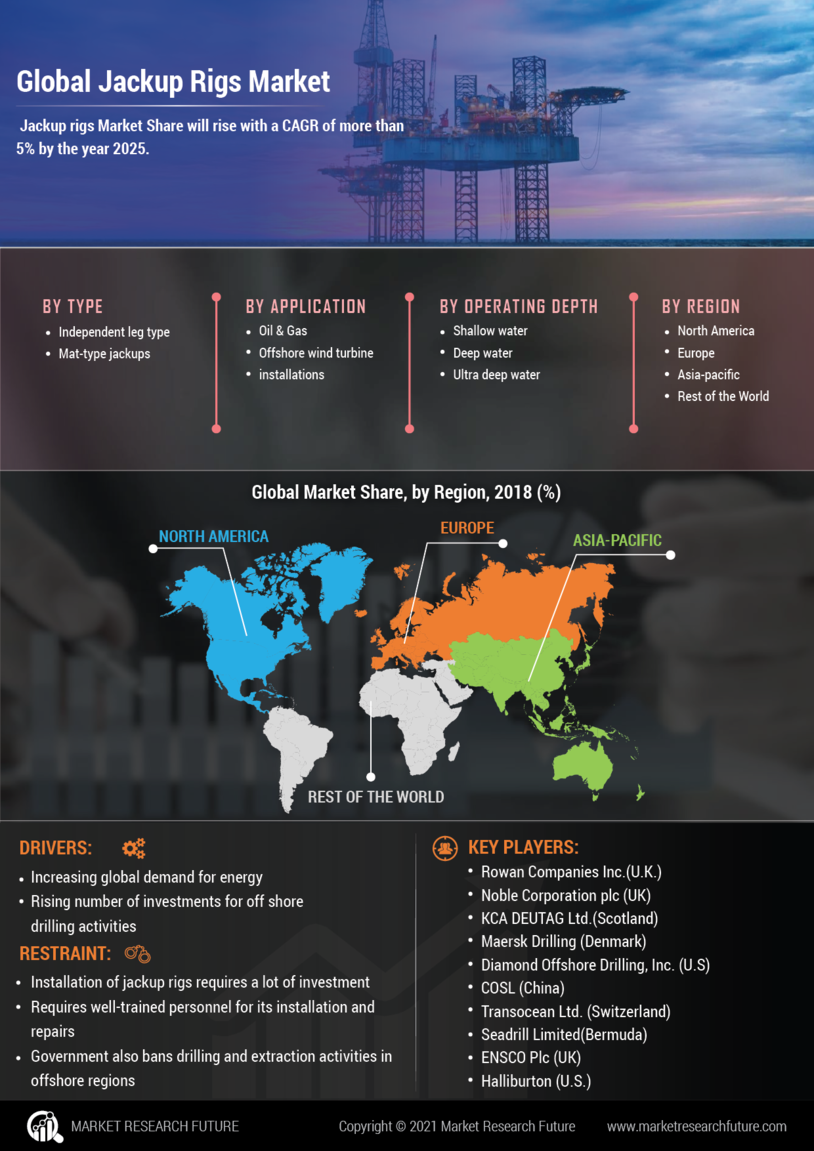
Segmentation du marché des plates-formes auto-élévatrices

Perspectives des types de plates-formes auto-élévatrices (en millions USD, 2019-2030)

  • Livrable à pattes indépendantes
  • Livrable sur tapis

Perspectives de profondeur d'exploitation des plates-formes auto-élévatrices (en millions USD, 2019-2030)

  • Eaux peu profondes
  • Eaux profondes
  • Eaux ultra-profondes

Perspectives d'application des plates-formes auto-élévatrices (en millions USD, 2019-2030)

  • Pétrole et Gaz
  • Installations d'éoliennes offshore

Perspectives régionales des plates-formes auto-élévatrices (en millions USD, 2019-2030)

  • Perspectives pour l'Amérique du Nord (en millions USD, 2019-2030)
    • Plates-formes auto-élévatrices en Amérique du Nord par type
      • Plate-forme auto-élévatrice indépendante
      • Plate-forme auto-élévatrice sur tapis
    • Plates-formes auto-élévatrices en Amérique du Nord par profondeur d'exploitation
      • Eaux peu profondes
      • Eaux profondes
      • Eaux ultra-profondes
    • Plates-formes auto-élévatrices en Amérique du Nord par profondeur d'exploitation
      • Pétrole et Gaz
      • Installations d'éoliennes offshore
    • Perspectives aux États-Unis(en millions USD, 2019-2030)
    • Plates-formes auto-élévatrices américaines par type
      • Plate-forme auto-élévatrice indépendante
      • Plate-forme auto-élévatrice sur tapis
    • Plates-formes auto-élévatrices américaines par profondeur d'exploitation
      • Eaux peu profondes
      • Eaux profondes
      • Eaux ultra-profondes
    • Plates-formes auto-élévatrices américaines par profondeur d'exploitation
      • Pétrole et Gaz
      • Installations d'éoliennes offshore
    • CanadaPerspectives (en millions USD, 2019-2030)
    • Plates-formes auto-élévatrices au Canada par type
      • Plate-forme auto-élévatrice à pattes indépendantes
      • Plate-forme auto-élévatrice sur tapis
    • Canada Plates-formes auto-élévatrices par profondeur d'exploitation
      • Eaux peu profondes
      • Eaux profondes
      • Eaux ultra-profondes
    • CanadaAmérique du Nord
      • Pétrole et Gaz
      • Installations d'éoliennes offshore
    • Perspectives pour l'Europe (en millions USD, 2019-2030)
      • Plates-formes auto-élévatrices européennes par type
        • Plate-forme auto-élévatrice indépendante
        • Plate-forme auto-élévatrice sur tapis
      • Plates-formes auto-élévatrices européennes par profondeur d'exploitation
        • Eaux peu profondes
        • Eaux profondes
        • Eaux ultra-profondes
      • Plates-formes auto-élévatrices européennes par profondeur d'exploitation
        • Pétrole et Gaz
        • Installations d'éoliennes offshore
      • Allemagne Perspectives (en millions USD, 2019-2030)
      • Plates-formes auto-élévatrices allemandes par type
        • Plate-forme auto-élévatrice indépendante
        • Plate-forme auto-élévatrice sur tapis
      • Plates-formes auto-élévatrices allemandes par profondeur d'exploitation
        • Eaux peu profondes
        • Eaux profondes
        • Eaux ultra-profondes
      • Plates-formes auto-élévatrices allemandes par profondeur d'exploitation
        • Pétrole et Gaz
        • Installations d'éoliennes offshore
      • Perspectives pour la France (en millions USD, 2019-2030)
      • Plates-formes auto-élévatrices en France par type
        • Plate-forme auto-élévatrice indépendante
        • Plate-forme auto-élévatrice sur tapis
      • Plates-formes auto-élévatrices en France par profondeur d'exploitation
        • Eaux peu profondes
        • Eaux profondes
        • Eaux ultra-profondes
      • Plates-formes auto-élévatrices en France par profondeur d'exploitation
        • Pétrole et Gaz
        • Installations d'éoliennes offshore
      • Perspectives pour la Russie (en millions USD, 2019-2030)
      • Plates-formes auto-élévatrices russes par type
        • Plate-forme auto-élévatrice indépendante
        • Plate-forme auto-élévatrice sur tapis
      • Plates-formes auto-élévatrices russes par profondeur d'exploitation
        • Eaux peu profondes
        • Eaux profondes
        • Eaux ultra-profondes
      • Plates-formes auto-élévatrices russes par profondeur d'exploitation
        • Pétrole et Gaz
        • Installations d'éoliennes offshore
      • ITALIEPerspectives (en millions USD, 2019-2030)
      • Plates-formes auto-élévatrices italiennes par type
        • Plate-forme auto-élévatrice indépendante
        • Plate-forme auto-élévatrice sur tapis
      • Plates-formes auto-élévatrices italiennes par profondeur d'exploitation
        • Eaux peu profondes
        • Eaux profondes
        • Eaux ultra-profondes
      • Plates-formes auto-élévatrices italiennes par profondeur d'exploitation
        • Pétrole et Gaz
        • Installations d'éoliennes offshore


  • Perspectives pour l'Espagne (en millions de dollars US, 2019-2030)
  • Plates-formes auto-élévatrices espagnoles par type
    • Plate-forme auto-élévatrice indépendante
    • Plate-forme auto-élévatrice sur tapis
  • Plates-formes auto-élévatrices espagnoles par profondeur d'exploitation
    • Eaux peu profondes
    • Eaux profondes
    • Eaux ultra-profondes
  • Plates-formes auto-élévatrices espagnoles par profondeur d'exploitation
    • Pétrole et gaz
    • Installations d'éoliennes offshore
  • Perspectives pour le Royaume-Uni(en millions USD, 2019-2030)
  • Plates-formes auto-élévatrices au Royaume-Uni par type
    • Plate-forme auto-élévatrice indépendante
    • Plate-forme auto-élévatrice sur tapis
  • Plates-formes auto-élévatrices au Royaume-Uni par profondeur d'exploitation
    • Eaux peu profondes
    • Eaux profondes
    • Eaux ultra-profondes
  • Plates-formes auto-élévatrices au Royaume-Uni par profondeur d'exploitation
    • Pétrole et gaz
    • Installations d'éoliennes offshore
  • Plates-formes auto-élévatrices au Royaume-Uni par profondeur d'exploitation
    • Pétrole et gaz
    • Eaux profondes
    • Eaux ultra-profondes
  • Plates-formes auto-élévatrices au Royaume-Uni par profondeur d'exploitation
    • Pétrole et gaz
    • Gaz
    • Installations d'éoliennes offshore
  • Reste de l'EuropePerspectives (en millions USD, 2019-2030)
  • Plates-formes auto-élévatrices du reste de l'Europe par type
    • Plate-forme auto-élévatrice indépendante
    • Plate-forme auto-élévatrice sur tapis
  • Plates-formes auto-élévatrices du reste de l'Europe par profondeur d'exploitation
    • Eaux peu profondes
    • Eaux profondes
    • Eaux ultra-profondes
  • Plates-formes auto-élévatrices du reste de l'Europe par profondeur d'exploitation
    • Pétrole et Gaz
    • Installations d'éoliennes offshore
  • Perspectives Asie-Pacifique (en millions USD, 2019-2030)
    • Plates-formes auto-élévatrices Asie-Pacifique par type
      • Plate-forme auto-élévatrice indépendante
      • Plate-forme auto-élévatrice sur tapis
    • Plates-formes auto-élévatrices Asie-Pacifique par profondeur d'exploitation
      • Eaux peu profondes
      • Eaux profondes
      • Eaux ultra-profondes
    • Plates-formes auto-élévatrices Asie-Pacifique par profondeur d'exploitation
      • Pétrole et Gaz
      • Installations d'éoliennes offshore
    • Perspectives en Chine (en millions USD, 2019-2030)
    • Plates-formes auto-élévatrices chinoises par type
      • Plate-forme auto-élévatrice indépendante
      • Plate-forme auto-élévatrice sur tapis
    • Plates-formes auto-élévatrices chinoises par profondeur d'exploitation
      • Eaux peu profondes
      • Eaux profondes
      • Eaux ultra-profondes
    • Plates-formes auto-élévatrices chinoises par profondeur d'exploitation
      • Pétrole et Gaz
      • Installations d'éoliennes offshore
    • Perspectives du Japon (en millions USD, 2019-2030)
    • Plates-formes auto-élévatrices japonaises par type
      • Plate-forme auto-élévatrice indépendante
      • Plate-forme auto-élévatrice sur tapis
    • Plates-formes auto-élévatrices japonaises par profondeur d'exploitation
      • Eaux peu profondes
      • Eaux profondes
      • Eaux ultra-profondes
    • Plates-formes auto-élévatrices japonaises par profondeur d'exploitation
      • Pétrole et Gaz
      • Installations d'éoliennes offshore
    • IndePerspectives (en millions USD, 2019-2030)
    • Plates-formes auto-élévatrices en Inde par type
      • Plate-forme auto-élévatrice indépendante
      • Plate-forme auto-élévatrice sur tapis
    • Plates-formes auto-élévatrices en Inde par profondeur d'exploitation
      • Eaux peu profondes
      • Eaux profondes
      • Eaux ultra-profondes
    • Plates-formes auto-élévatrices en Inde par profondeur d'exploitation
      • Pétrole et Gaz
      • Installations d'éoliennes offshore
    • Perspectives en Australie et en Nouvelle-Zélande (en millions de dollars américains, 2019-2030)
    • Plates-formes auto-élévatrices en Australie et en Nouvelle-Zélande par type
      • Plate-forme auto-élévatrice indépendante
      • Plate-forme auto-élévatrice sur tapis
    • Plates-formes auto-élévatrices en Australie et en Nouvelle-Zélande par profondeur d'exploitation
      • Eaux peu profondes
      • Eaux profondes
      • Eaux ultra-profondes
    • Plates-formes auto-élévatrices en Australie par profondeur d'exploitation
      • Pétrole et Gaz
      • Installations d'éoliennes offshore
    • Perspectives pour la Corée du Sud(en millions USD, 2019-2030)
    • Plates-formes auto-élévatrices en Corée du Sud par type
      • Plate-forme auto-élévatrice indépendante
      • Plate-forme auto-élévatrice sur tapis
    • Plates-formes auto-élévatrices en Corée du Sud par profondeur d'exploitation
      • Eaux peu profondes
      • Eaux profondes
      • Eaux ultra-profondes
    • Plates-formes auto-élévatrices en Corée du Sud par profondeur d'exploitation
      • Pétrole et Gaz
      • Installations d'éoliennes offshore
    • Perspectives pour le reste de l'Asie-Pacifique (en millions USD, 2019-2030)
    • Répartition des plates-formes auto-élévatrices du reste de l'Asie-Pacifique par type
      • Auto-élévatrice indépendante
      • Auto-élévatrice sur tapis
    • Répartition des plates-formes auto-élévatrices du reste de l'Asie-Pacifique par profondeur d'exploitation
      • Eaux peu profondes
      • Eaux profondes
      • Eaux ultra-profondes
    • Répartition des plates-formes auto-élévatrices du reste de l'Asie-Pacifique par profondeur d'exploitation
      • Pétrole et Gaz
      • Installations d'éoliennes offshore
    • Perspectives pour le Moyen-Orient et l'Afrique (en millions USD, 2019-2030)
      • Plates-formes auto-élévatrices au Moyen-Orient et en Afrique par type
        • Plate-forme auto-élévatrice indépendante
        • Plate-forme auto-élévatrice sur tapis
      • Plates-formes auto-élévatrices au Moyen-Orient et en Afrique par profondeur d'exploitation
        • Eaux peu profondes
        • Eaux profondes
        • Eaux ultra-profondes
      • Plates-formes auto-élévatrices au Moyen-Orient et en Afrique par profondeur d'exploitation
        • Pétrole et Gaz
        • Installations d'éoliennes offshore


  • TurquiePerspectives (en millions USD, 2019-2030)
  • TurquiePlates-formes auto-élévatrices par type
    • Plate-forme auto-élévatrice indépendante
    • Plate-forme auto-élévatrice sur tapis
  • TurquiePlates-formes auto-élévatrices par profondeur d'exploitation
    • Eaux peu profondes
    • Eaux profondes
    • Eaux ultra-profondes
  • TurquiePlates-formes auto-élévatrices par profondeur d'exploitation
    • Pétrole et Gaz
    • Installations d'éoliennes offshore
  • Afrique du SudPerspectives (en millions USD, 2019-2030)
  • Plates-formes auto-élévatrices en Afrique du Sud par type
    • Plate-forme auto-élévatrice indépendante
    • Plate-forme auto-élévatrice sur tapis
  • Plates-formes auto-élévatrices en Afrique du Sud par profondeur d'exploitation
    • Eaux peu profondes
    • Eaux profondes
    • Eaux ultra-profondes
  • Plates-formes auto-élévatrices en Afrique du Sud par profondeur d'exploitation
    • Pétrole et Gaz
    • Installations d'éoliennes offshore
  • Perspectives des pays du CCG (en millions USD, 2019-2030)
  • Plates-formes auto-élévatrices des pays du CCG par type
    • Plate-forme auto-élévatrice indépendante
    • Plate-forme auto-élévatrice sur tapis
  • Plates-formes auto-élévatrices des pays du CCG par profondeur d'exploitation
    • Eaux peu profondes
    • Eaux profondes
    • Eaux ultra-profondes
  • Plates-formes auto-élévatrices des pays du CCG par profondeur d'exploitation
    • Pétrole et Gaz
    • Installations d'éoliennes offshore
  • Reste du Moyen-Orient et de l'AfriquePerspectives (en millions USD, 2019-2030)
  • Plates-formes auto-élévatrices du reste du Moyen-Orient et de l'Afrique par type
    • Plate-forme auto-élévatrice indépendante
    • Plate-forme auto-élévatrice sur tapis
  • Reste du Moyen-Orient et de l'Afrique par profondeur d'exploitation
    • Eaux peu profondes
    • Eaux profondes
    • Eaux ultra-profondes
  • Reste du Moyen-Orient et de l'Afrique Plateformes auto-élévatrices en Afrique par profondeur d'exploitation
    • Pétrole et gaz
    • Installations d'éoliennes offshore
  • Perspectives pour l'Amérique latine (en millions USD, 2019-2030)
  • Plateformes auto-élévatrices en Amérique latine par type
    • Plateforme auto-élévatrice à pieds indépendants
    • Plateforme auto-élévatrice sur tapis
  • Plateformes auto-élévatrices en Amérique latine par profondeur d'exploitation
    • Eaux peu profondes
    • Eaux profondes
    • Eaux ultra-profondes
  • Plateformes auto-élévatrices en Amérique latine par profondeur d'exploitation
    • Pétrole et gaz Gaz
    • Installations d'éoliennes offshore
  • Perspectives du Brésil (en millions USD, 2019-2030)
  • Plates-formes auto-élévatrices brésiliennes par type
    • Plate-forme auto-élévatrice indépendante
    • Plate-forme auto-élévatrice sur tapis
  • Plates-formes auto-élévatrices brésiliennes par profondeur d'exploitation
    • Eaux peu profondes
    • Eaux profondes
    • Eaux ultra-profondes
  • Plates-formes auto-élévatrices brésiliennes par profondeur d'exploitation
    • Pétrole et Gaz
    • Installations d'éoliennes offshore
  • Perspectives du Mexique (en millions USD, 2019-2030)
  • Plates-formes auto-élévatrices mexicaines par type
    • Plate-forme auto-élévatrice indépendante
    • Plate-forme auto-élévatrice sur tapis
  • Plates-formes auto-élévatrices mexicaines par profondeur d'exploitation
    • Eaux peu profondes
    • Eaux profondes
    • Eaux ultra-profondes
  • Plates-formes auto-élévatrices mexicaines par profondeur d'exploitation
    • Pétrole et Gaz
    • Installations d'éoliennes offshore
  • Perspectives de l'Argentine (en millions USD, 2019-2030)
  • Plates-formes auto-élévatrices en Argentine par type
    • Plate-forme auto-élévatrice indépendante
    • Plate-forme auto-élévatrice sur tapis
  • Plates-formes auto-élévatrices en Argentine par profondeur d'exploitation
    • Eaux peu profondes
    • Eaux profondes
    • Eaux ultra-profondes
  • Plates-formes auto-élévatrices en Argentine par profondeur d'exploitation
    • Pétrole et Gaz
    • Installations d'éoliennes offshore
  • Reste de l'Amérique latinePerspectives (en millions USD, 2019-2030)
  • Plates-formes auto-élévatrices du reste de l'Amérique latine par type
    • Plate-forme auto-élévatrice indépendante
    • Plate-forme auto-élévatrice sur tapis
  • Plates-formes auto-élévatrices du reste de l'Amérique latine par profondeur d'exploitation
    • Eaux peu profondes
    • Eaux profondes
    • Eaux ultra-profondes
  • Plates-formes auto-élévatrices du reste de l'Amérique latine par profondeur d'exploitation
    • Pétrole et Gaz
    • Installations d'éoliennes offshore

Compare Licence

×
Features License Type
Single User Multiuser License Enterprise User
Price $4,950 $5,950 $7,250
Maximum User Access Limit 1 User Upto 10 Users Unrestricted Access Throughout the Organization
Free Customization
Direct Access to Analyst
Deliverable Format
Platform Access
Discount on Next Purchase 10% 15% 15%
Printable Versions