Request Free Sample ×

Kindly complete the form below to receive a free sample of this Report

* Please use a valid business email

Leading companies partner with us for data-driven Insights

clients tt-cursor
Hero Background

Marché du Cloud Hybride

ID: MRFR/ICT/0512-CR
205 Pages
Ankit Gupta
Last Updated: April 16, 2026

Rapport de recherche sur le marché du cloud hybride Informations par composant (solution, services), par type de service (hébergement hybride, gestion du cloud, orchestration, récupération après sinistre), par modèle de service (Infrastructure en tant que service, logiciel en tant que service, plateforme en tant que service), par taille d'organisation (PME et grandes entreprises), par secteur (BFSI, IT & Télécom, vente au détail, fabrication, médias & divertissement, santé, transport, et autres), et par région (Amérique du Nord, Europe, Asie-Pacifique, et reste du monde) – Prévisions du marché jusqu'en 2035.

Partager
Download PDF ×

We do not share your information with anyone. However, we may send you emails based on your report interest from time to time. You may contact us at any time to opt-out.

Hybrid Cloud Market Infographic
Purchase Options
  1. SECTION I : RÉSUMÉ EXÉCUTIF ET POINTS CLÉS\n\n
    1. 1.1 RÉSUMÉ EXÉCUTIF\n \n
      1. 1.1.1 Vue d'ensemble du marché\n \n
      2. 1.1.2 Conclusions clés\n \n
      3. 1.1.3 Segmentation du marché\n \n
      4. 1.1.4 Paysage concurrentiel\n \n
      5. 1.1.5 Défis et opportunités\n \n
      6. 1.1.6 Perspectives d'avenir\n2
  2. SECTION II : DÉLIMITATION, MÉTHODOLOGIE ET STRUCTURE DU MARCHÉ\n
    1. 2.1 INTRODUCTION AU MARCHÉ\n \n
      1. 2.1.1 Définition\n \n
      2. 2.1.2 Portée de l'étude\n \n \n
        1. 2.1.2.1 Objectif de recherche\n \n \n
        2. 2.1.2.2 Hypothèse\n \n \n
        3. 2.1.2.3 Limitations\n
    2. 2.2 MÉTHODOLOGIE DE RECHERCHE\n \n
      1. 2.2.1 Vue d'ensemble\n \n
      2. 2.2.2 Extraction de données\n \n
      3. 2.2.3 Recherche secondaire\n \n
      4. 2.2.4 Recherche primaire\n \n \n
        1. 2.2.4.1 Interviews primaires et processus de collecte d'informations\n \n \n
        2. 2.2.4.2 Répartition des répondants principaux\n \n
      5. 2.2.5 Modèle de prévision\n \n
      6. 2.2.6 Estimation de la taille du marché\n \n \n
        1. 2.2.6.1 Approche ascendante\n \n \n
        2. 2.2.6.2 Approche descendante\n \n
      7. 2.2.7 Triangulation des données\n \n
      8. 2.2.8 Validation\n3
  3. SECTION III : ANALYSE QUALITATIVE\n
    1. 3.1 DYNAMIQUE DU MARCHÉ\n \n
      1. 3.1.1 Vue d'ensemble\n \n
      2. 3.1.2 Facteurs moteurs\n \n
      3. 3.1.3 Contraintes\n \n
      4. 3.1.4 Opportunités\n
    2. 3.2 ANALYSE DES FACTEURS DU MARCHÉ\n \n
      1. 3.2.1 Analyse de la chaîne de valeur\n \n
      2. 3.2.2 Analyse des cinq forces de Porter\n \n \n
        1. 3.2.2.1 Pouvoir de négociation des fournisseurs\n \n \n
        2. 3.2.2.2 Pouvoir de négociation des acheteurs\n \n \n
        3. 3.2.2.3 Menace des nouveaux entrants\n \n \n
        4. 3.2.2.4 Menace des substituts\n \n \n
        5. 3.2.2.5 Intensité de la rivalité\n \n
      3. 3.2.3 Analyse de l'impact du COVID-19\n \n \n
        1. 3.2.3.1 Analyse de l'impact sur le marché\n \n \n
        2. 3.2.3.2 Impact régional\n \n \n
        3. 3.2.3.3 Analyse des opportunités et des menaces\n4
  4. SECTION IV : ANALYSE QUANTITATIVE\n
    1. 4.1 Technologies de l'information et de la communication, PAR Composant (milliards USD)\n \n
      1. 4.1.1 Solutions\n \n
      2. 4.1.2 Services\n
    2. 4.2 Technologies de l'information et de la communication, PAR Type de service (milliards USD)\n \n
      1. 4.2.1 Hébergement hybride\n \n
      2. 4.2.2 Gestion du cloud\n \n
      3. 4.2.3 Orchestration\n \n
      4. 4.2.4 Récupération après sinistre\n
    3. 4.3 Technologies de l'information et de la communication, PAR Modèle de service (milliards USD)\n \n
      1. 4.3.1 Infrastructure en tant que service\n \n
      2. 4.3.2 Logiciel en tant que service\n \n
      3. 4.3.3 Plateforme en tant que service\n
    4. 4.4 Technologies de l'information et de la communication, PAR Taille de l'organisation (milliards USD)\n \n
      1. 4.4.1 PME\n \n
      2. 4.4.2 Grandes entreprises\n
    5. 4.5 Technologies de l'information et de la communication, PAR Secteur (milliards USD)\n \n
      1. 4.5.1 BFSI\n \n
      2. 4.5.2 IT & Télécom\n \n
      3. 4.5.3 Vente au détail\n \n
      4. 4.5.4 Fabrication\n \n
      5. 4.5.5 Médias & Divertissement\n \n
      6. 4.5.6 Santé\n \n
      7. 4.5.7 Transport\n \n
      8. 4.5.8 Autres\n
    6. 4.6 Technologies de l'information et de la communication, PAR Région (milliards USD)\n \n
      1. 4.6.1 Amérique du Nord\n \n \n
        1. 4.6.1.1 États-Unis\n \n \n
        2. 4.6.1.2 Canada\n \n
      2. 4.6.2 Europe\n \n \n
        1. 4.6.2.1 Allemagne\n \n \n
        2. 4.6.2.2 Royaume-Uni\n \n \n
        3. 4.6.2.3 France\n \n \n
        4. 4.6.2.4 Russie\n \n \n
        5. 4.6.2.5 Italie\n \n \n
        6. 4.6.2.6 Espagne\n \n \n
        7. 4.6.2.7 Reste de l'Europe\n \n
      3. 4.6.3 APAC\n \n \n
        1. 4.6.3.1 Chine\n \n \n
        2. 4.6.3.2 Inde\n \n \n
        3. 4.6.3.3 Japon\n \n \n
        4. 4.6.3.4 Corée du Sud\n \n \n
        5. 4.6.3.5 Malaisie\n \n \n
        6. 4.6.3.6 Thaïlande\n \n \n
        7. 4.6.3.7 Indonésie\n \n \n
        8. 4.6.3.8 Reste de l'APAC\n \n
      4. 4.6.4 Amérique du Sud\n \n \n
        1. 4.6.4.1 Brésil\n \n \n
        2. 4.6.4.2 Mexique\n \n \n
        3. 4.6.4.3 Argentine\n \n \n
        4. 4.6.4.4 Reste de l'Amérique du Sud\n \n
      5. 4.6.5 MEA\n \n \n
        1. 4.6.5.1 Pays du CCG\n \n \n
        2. 4.6.5.2 Afrique du Sud\n \n \n
        3. 4.6.5.3 Reste de MEA\n5
  5. SECTION V : ANALYSE CONCURRENTIELLE\n
    1. 5.1 Paysage concurrentiel\n \n
      1. 5.1.1 Vue d'ensemble\n \n
      2. 5.1.2 Analyse concurrentielle\n \n
      3. 5.1.3 Analyse de la part de marché\n \n
      4. 5.1.4 Stratégie de croissance majeure dans les technologies de l'information et de la communication\n \n
      5. 5.1.5 Évaluation comparative concurrentielle\n \n
      6. 5.1.6 Acteurs principaux en termes de nombre de développements dans les technologies de l'information et de la communication\n \n
      7. 5.1.7 Développements clés et stratégies de croissance\n \n \n
        1. 5.1.7.1 Lancement de nouveaux produits / Déploiement de services\n \n \n
        2. 5.1.7.2 Fusions & Acquisitions\n \n \n
        3. 5.1.7.3 Coentreprises\n \n
      8. 5.1.8 Matrice financière des principaux acteurs\n \n \n
        1. 5.1.8.1 Ventes et revenu d'exploitation\n \n \n
        2. 5.1.8.2 Dépenses de R&D des principaux acteurs. 2023\n
    2. 5.2 Profils d'entreprise\n \n
      1. 5.2.1 Amazon Web Services (États-Unis)\n \n \n
        1. 5.2.1.1 Vue d'ensemble financière\n \n \n
        2. 5.2.1.2 Produits offerts\n \n \n
        3. 5.2.1.3 Développements clés\n \n \n
        4. 5.2.1.4 Analyse SWOT\n \n \n
        5. 5.2.1.5 Stratégies clés\n \n
      2. 5.2.2 Microsoft (États-Unis)\n \n \n
        1. 5.2.2.1 Vue d'ensemble financière\n \n \n
        2. 5.2.2.2 Produits offerts\n \n \n
        3. 5.2.2.3 Développements clés\n \n \n
        4. 5.2.2.4 Analyse SWOT\n \n \n
        5. 5.2.2.5 Stratégies clés\n \n
      3. 5.2.3 Google Cloud (États-Unis)\n \n \n
        1. 5.2.3.1 Vue d'ensemble financière\n \n \n
        2. 5.2.3.2 Produits offerts\n \n \n
        3. 5.2.3.3 Développements clés\n \n \n
        4. 5.2.3.4 Analyse SWOT\n \n \n
        5. 5.2.3.5 Stratégies clés\n \n
      4. 5.2.4 IBM (États-Unis)\n \n \n
        1. 5.2.4.1 Vue d'ensemble financière\n \n \n
        2. 5.2.4.2 Produits offerts\n \n \n
        3. 5.2.4.3 Développements clés\n \n \n
        4. 5.2.4.4 Analyse SWOT\n \n \n
        5. 5.2.4.5 Stratégies clés\n \n
      5. 5.2.5 Oracle (États-Unis)\n \n \n
        1. 5.2.5.1 Vue d'ensemble financière\n \n \n
        2. 5.2.5.2 Produits offerts\n \n \n
        3. 5.2.5.3 Développements clés\n \n \n
        4. 5.2.5.4 Analyse SWOT\n \n \n
        5. 5.2.5.5 Stratégies clés\n \n
      6. 5.2.6 Alibaba Cloud (Chine)\n \n \n
        1. 5.2.6.1 Vue d'ensemble financière\n \n \n
        2. 5.2.6.2 Produits offerts\n \n \n
        3. 5.2.6.3 Développements clés\n \n \n
        4. 5.2.6.4 Analyse SWOT\n \n \n
        5. 5.2.6.5 Stratégies clés\n \n
      7. 5.2.7 Salesforce (États-Unis)\n \n \n
        1. 5.2.7.1 Vue d'ensemble financière\n \n \n
        2. 5.2.7.2 Produits offerts\n \n \n
        3. 5.2.7.3 Développements clés\n \n \n
        4. 5.2.7.4 Analyse SWOT\n \n \n
        5. 5.2.7.5 Stratégies clés\n \n
      8. 5.2.8 VMware (États-Unis)\n \n \n
        1. 5.2.8.1 Vue d'ensemble financière\n \n \n
        2. 5.2.8.2 Produits offerts\n \n \n
        3. 5.2.8.3 Développements clés\n \n \n
        4. 5.2.8.4 Analyse SWOT\n \n \n
        5. 5.2.8.5 Stratégies clés\n \n
      9. 5.2.9 Cisco (États-Unis)\n \n \n
        1. 5.2.9.1 Vue d'ensemble financière\n \n \n
        2. 5.2.9.2 Produits offerts\n \n \n
        3. 5.2.9.3 Développements clés\n \n \n
        4. 5.2.9.4 Analyse SWOT\n \n \n
        5. 5.2.9.5 Stratégies clés\n \n
      10. 5.2.10 Hewlett Packard Enterprise (États-Unis)\n \n \n
        1. 5.2.10.1 Vue d'ensemble financière\n \n \n
        2. 5.2.10.2 Produits offerts\n \n \n
        3. 5.2.10.3 Développements clés\n \n \n
        4. 5.2.10.4 Analyse SWOT\n \n \n
        5. 5.2.10.5 Stratégies clés\n
    3. 5.3 Annexe\n \n
      1. 5.3.1 Références\n \n
      2. 5.3.2 Rapports connexes\n6 LISTE DES FIGURES\n
    4. 6.1 SYNOPSIS DU MARCHÉ\n
    5. 6.2 ANALYSE DU MARCHÉ EN AMÉRIQUE DU NORD\n
    6. 6.3 ANALYSE DU MARCHÉ AUX ÉTATS-UNIS PAR COMPOSANT\n
    7. 6.4 ANALYSE DU MARCHÉ AUX ÉTATS-UNIS PAR TYPE DE SERVICE\n
    8. 6.5 ANALYSE DU MARCHÉ AUX ÉTATS-UNIS PAR MODÈLE DE SERVICE\n
    9. 6.6 ANALYSE DU MARCHÉ AUX ÉTATS-UNIS PAR TAILLE D'ORGANISATION\n
    10. 6.7 ANALYSE DU MARCHÉ AUX ÉTATS-UNIS PAR SECTEUR\n
    11. 6.8 ANALYSE DU MARCHÉ AU CANADA PAR COMPOSANT\n
    12. 6.9 ANALYSE DU MARCHÉ AU CANADA PAR TYPE DE SERVICE\n
    13. 6.10 ANALYSE DU MARCHÉ AU CANADA PAR MODÈLE DE SERVICE\n
    14. 6.11 ANALYSE DU MARCHÉ AU CANADA PAR TAILLE D'ORGANISATION\n
    15. 6.12 ANALYSE DU MARCHÉ AU CANADA PAR SECTEUR\n
    16. 6.13 ANALYSE DU MARCHÉ EN EUROPE\n
    17. 6.14 ANALYSE DU MARCHÉ EN ALLEMAGNE PAR COMPOSANT\n
    18. 6.15 ANALYSE DU MARCHÉ EN ALLEMAGNE PAR TYPE DE SERVICE\n
    19. 6.16 ANALYSE DU MARCHÉ EN ALLEMAGNE PAR MODÈLE DE SERVICE\n
    20. 6.17 ANALYSE DU MARCHÉ EN ALLEMAGNE PAR TAILLE D'ORGANISATION\n
    21. 6.18 ANALYSE DU MARCHÉ EN ALLEMAGNE PAR SECTEUR\n
    22. 6.19 ANALYSE DU MARCHÉ AU ROYAUME-UNI PAR COMPOSANT\n
    23. 6.20 ANALYSE DU MARCHÉ AU ROYAUME-UNI PAR TYPE DE SERVICE\n
    24. 6.21 ANALYSE DU MARCHÉ AU ROYAUME-UNI PAR MODÈLE DE SERVICE\n
    25. 6.22 ANALYSE DU MARCHÉ AU ROYAUME-UNI PAR TAILLE D'ORGANISATION\n
    26. 6.23 ANALYSE DU MARCHÉ AU ROYAUME-UNI PAR SECTEUR\n
    27. 6.24 ANALYSE DU MARCHÉ EN FRANCE PAR COMPOSANT\n
    28. 6.25 ANALYSE DU MARCHÉ EN FRANCE PAR TYPE DE SERVICE\n
    29. 6.26 ANALYSE DU MARCHÉ EN FRANCE PAR MODÈLE DE SERVICE\n
    30. 6.27 ANALYSE DU MARCHÉ EN FRANCE PAR TAILLE D'ORGANISATION\n
    31. 6.28 ANALYSE DU MARCHÉ EN FRANCE PAR SECTEUR\n
    32. 6.29 ANALYSE DU MARCHÉ EN RUSSIE PAR COMPOSANT\n
    33. 6.30 ANALYSE DU MARCHÉ EN RUSSIE PAR TYPE DE SERVICE\n
    34. 6.31 ANALYSE DU MARCHÉ EN RUSSIE PAR MODÈLE DE SERVICE\n
    35. 6.32 ANALYSE DU MARCHÉ EN RUSSIE PAR TAILLE D'ORGANISATION\n
    36. 6.33 ANALYSE DU MARCHÉ EN RUSSIE PAR SECTEUR\n
    37. 6.34 ANALYSE DU MARCHÉ EN ITALIE PAR COMPOSANT\n
    38. 6.35 ANALYSE DU MARCHÉ EN ITALIE PAR TYPE DE SERVICE\n
    39. 6.36 ANALYSE DU MARCHÉ EN ITALIE PAR MODÈLE DE SERVICE\n
    40. 6.37 ANALYSE DU MARCHÉ EN ITALIE PAR TAILLE D'ORGANISATION\n
    41. 6.38 ANALYSE DU MARCHÉ EN ITALIE PAR SECTEUR\n
    42. 6.39 ANALYSE DU MARCHÉ EN ESPAGNE PAR COMPOSANT\n
    43. 6.40 ANALYSE DU MARCHÉ EN ESPAGNE PAR TYPE DE SERVICE\n
    44. 6.41 ANALYSE DU MARCHÉ EN ESPAGNE PAR MODÈLE DE SERVICE\n
    45. 6.42 ANALYSE DU MARCHÉ EN ESPAGNE PAR TAILLE D'ORGANISATION\n
    46. 6.43 ANALYSE DU MARCHÉ EN ESPAGNE PAR SECTEUR\n
    47. 6.44 ANALYSE DU MARCHÉ DANS LE RESTE DE L'EUROPE PAR COMPOSANT\n
    48. 6.45 ANALYSE DU MARCHÉ DANS LE RESTE DE L'EUROPE PAR TYPE DE SERVICE\n
    49. 6.46 ANALYSE DU MARCHÉ DANS LE RESTE DE L'EUROPE PAR MODÈLE DE SERVICE\n
    50. 6.47 ANALYSE DU MARCHÉ DANS LE RESTE DE L'EUROPE PAR TAILLE D'ORGANISATION\n
    51. 6.48 ANALYSE DU MARCHÉ DANS LE RESTE DE L'EUROPE PAR SECTEUR\n
    52. 6.49 ANALYSE DU MARCHÉ EN APAC\n
    53. 6.50 ANALYSE DU MARCHÉ EN CHINE PAR COMPOSANT\n
    54. 6.51 ANALYSE DU MARCHÉ EN CHINE PAR TYPE DE SERVICE\n
    55. 6.52 ANALYSE DU MARCHÉ EN CHINE PAR MODÈLE DE SERVICE\n
    56. 6.53 ANALYSE DU MARCHÉ EN CHINE PAR TAILLE D'ORGANISATION\n
    57. 6.54 ANALYSE DU MARCHÉ EN CHINE PAR SECTEUR\n
    58. 6.55 ANALYSE DU MARCHÉ EN INDE PAR COMPOSANT\n
    59. 6.56 ANALYSE DU MARCHÉ EN INDE PAR TYPE DE SERVICE\n
    60. 6.57 ANALYSE DU MARCHÉ EN INDE PAR MODÈLE DE SERVICE\n
    61. 6.58 ANALYSE DU MARCHÉ EN INDE PAR TAILLE D'ORGANISATION\n
    62. 6.59 ANALYSE DU MARCHÉ EN INDE PAR SECTEUR\n
    63. 6.60 ANALYSE DU MARCHÉ AU JAPON PAR COMPOSANT\n
    64. 6.61 ANALYSE DU MARCHÉ AU JAPON PAR TYPE DE SERVICE\n
    65. 6.62 ANALYSE DU MARCHÉ AU JAPON PAR MODÈLE DE SERVICE\n
    66. 6.63 ANALYSE DU MARCHÉ AU JAPON PAR TAILLE D'ORGANISATION\n
    67. 6.64 ANALYSE DU MARCHÉ AU JAPON PAR SECTEUR\n
    68. 6.65 ANALYSE DU MARCHÉ EN CORÉE DU SUD PAR COMPOSANT\n
    69. 6.66 ANALYSE DU MARCHÉ EN CORÉE DU SUD PAR TYPE DE SERVICE\n
    70. 6.67 ANALYSE DU MARCHÉ EN CORÉE DU SUD PAR MODÈLE DE SERVICE\n
    71. 6.68 ANALYSE DU MARCHÉ EN CORÉE DU SUD PAR TAILLE D'ORGANISATION\n
    72. 6.69 ANALYSE DU MARCHÉ EN CORÉE DU SUD PAR SECTEUR\n
    73. 6.70 ANALYSE DU MARCHÉ EN MALAYSIE PAR COMPOSANT\n
    74. 6.71 ANALYSE DU MARCHÉ EN MALAYSIE PAR TYPE DE SERVICE\n
    75. 6.72 ANALYSE DU MARCHÉ EN MALAYSIE PAR MODÈLE DE SERVICE\n
    76. 6.73 ANALYSE DU MARCHÉ EN MALAYSIE PAR TAILLE D'ORGANISATION\n
    77. 6.74 ANALYSE DU MARCHÉ EN MALAYSIE PAR SECTEUR\n
    78. 6.75 ANALYSE DU MARCHÉ EN THAÏLANDE PAR COMPOSANT\n
    79. 6.76 ANALYSE DU MARCHÉ EN THAÏLANDE PAR TYPE DE SERVICE\n
    80. 6.77 ANALYSE DU MARCHÉ EN THAÏLANDE PAR MODÈLE DE SERVICE\n
    81. 6.78 ANALYSE DU MARCHÉ EN THAÏLANDE PAR TAILLE D'ORGANISATION\n
    82. 6.79 ANALYSE DU MARCHÉ EN THAÏLANDE PAR SECTEUR\n
    83. 6.80 ANALYSE DU MARCHÉ EN INDONÉSIE PAR COMPOSANT\n
    84. 6.81 ANALYSE DU MARCHÉ EN INDONÉSIE PAR TYPE DE SERVICE\n
    85. 6.82 ANALYSE DU MARCHÉ EN INDONÉSIE PAR MODÈLE DE SERVICE\n
    86. 6.83 ANALYSE DU MARCHÉ EN INDONÉSIE PAR TAILLE D'ORGANISATION\n
    87. 6.84 ANALYSE DU MARCHÉ EN INDONÉSIE PAR SECTEUR\n
    88. 6.85 ANALYSE DU MARCHÉ DANS LE RESTE DE L'APAC PAR COMPOSANT\n
    89. 6.86 ANALYSE DU MARCHÉ DANS LE RESTE DE L'APAC PAR TYPE DE SERVICE\n
    90. 6.87 ANALYSE DU MARCHÉ DANS LE RESTE DE L'APAC PAR MODÈLE DE SERVICE\n
    91. 6.88 ANALYSE DU MARCHÉ DANS LE RESTE DE L'APAC PAR TAILLE D'ORGANISATION\n
    92. 6.89 ANALYSE DU MARCHÉ DANS LE RESTE DE L'APAC PAR SECTEUR\n
    93. 6.90 ANALYSE DU MARCHÉ EN AMÉRIQUE DU SUD\n
    94. 6.91 ANALYSE DU MARCHÉ AU BRÉSIL PAR COMPOSANT\n
    95. 6.92 ANALYSE DU MARCHÉ AU BRÉSIL PAR TYPE DE SERVICE\n
    96. 6.93 ANALYSE DU MARCHÉ AU BRÉSIL PAR MODÈLE DE SERVICE\n
    97. 6.94 ANALYSE DU MARCHÉ AU BRÉSIL PAR TAILLE D'ORGANISATION\n
    98. 6.95 ANALYSE DU MARCHÉ AU BRÉSIL PAR SECTEUR\n
    99. 6.96 ANALYSE DU MARCHÉ AU MEXIQUE PAR COMPOSANT\n
    100. 6.97 ANALYSE DU MARCHÉ AU MEXIQUE PAR TYPE DE SERVICE\n
    101. 6.98 ANALYSE DU MARCHÉ AU MEXIQUE PAR MODÈLE DE SERVICE\n
    102. 6.99 ANALYSE DU MARCHÉ AU MEXIQUE PAR TAILLE D'ORGANISATION\n
    103. 6.100 ANALYSE DU MARCHÉ AU MEXIQUE PAR SECTEUR\n
    104. 6.101 ANALYSE DU MARCHÉ EN ARGENTINE PAR COMPOSANT\n
    105. 6.102 ANALYSE DU MARCHÉ EN ARGENTINE PAR TYPE DE SERVICE\n
    106. 6.103 ANALYSE DU MARCHÉ EN ARGENTINE PAR MODÈLE DE SERVICE\n
    107. 6.104 ANALYSE DU MARCHÉ EN ARGENTINE PAR TAILLE D'ORGANISATION\n
    108. 6.105 ANALYSE DU MARCHÉ EN ARGENTINE PAR SECTEUR\n
    109. 6.106 ANALYSE DU MARCHÉ DANS LE RESTE DE L'AMÉRIQUE DU SUD PAR COMPOSANT\n
    110. 6.107 ANALYSE DU MARCHÉ DANS LE RESTE DE L'AMÉRIQUE DU SUD PAR TYPE DE SERVICE\n
    111. 6.108 ANALYSE DU MARCHÉ DANS LE RESTE DE L'AMÉRIQUE DU SUD PAR MODÈLE DE SERVICE\n
    112. 6.109 ANALYSE DU MARCHÉ DANS LE RESTE DE L'AMÉRIQUE DU SUD PAR TAILLE D'ORGANISATION\n
    113. 6.110 ANALYSE DU MARCHÉ DANS LE RESTE DE L'AMÉRIQUE DU SUD PAR SECTEUR\n
    114. 6.111 ANALYSE DU MARCHÉ EN MEA\n
    115. 6.112 ANALYSE DU MARCHÉ DANS LES PAYS DU CCG PAR COMPOSANT\n
    116. 6.113 ANALYSE DU MARCHÉ DANS LES PAYS DU CCG PAR TYPE DE SERVICE\n
    117. 6.114 ANALYSE DU MARCHÉ DANS LES PAYS DU CCG PAR MODÈLE DE SERVICE\n
    118. 6.115 ANALYSE DU MARCHÉ DANS LES PAYS DU CCG PAR TAILLE D'ORGANISATION\n
    119. 6.116 ANALYSE DU MARCHÉ DANS LES PAYS DU CCG PAR SECTEUR\n
    120. 6.117 ANALYSE DU MARCHÉ EN AFRIQUE DU SUD PAR COMPOSANT\n
    121. 6.118 ANALYSE DU MARCHÉ EN AFRIQUE DU SUD PAR TYPE DE SERVICE\n
    122. 6.119 ANALYSE DU MARCHÉ EN AFRIQUE DU SUD PAR MODÈLE DE SERVICE\n
    123. 6.120 ANALYSE DU MARCHÉ EN AFRIQUE DU SUD PAR TAILLE D'ORGANISATION\n
    124. 6.121 ANALYSE DU MARCHÉ EN AFRIQUE DU SUD PAR SECTEUR\n
    125. 6.122 ANALYSE DU MARCHÉ DANS LE RESTE DE MEA PAR COMPOSANT\n
    126. 6.123 ANALYSE DU MARCHÉ DANS LE RESTE DE MEA PAR TYPE DE SERVICE\n
    127. 6.124 ANALYSE DU MARCHÉ DANS LE RESTE DE MEA PAR MODÈLE DE SERVICE\n
    128. 6.125 ANALYSE DU MARCHÉ DANS LE RESTE DE MEA PAR TAILLE D'ORGANISATION\n
    129. 6.126 ANALYSE DU MARCHÉ DANS LE RESTE DE MEA PAR SECTEUR\n
    130. 6.127 CRITÈRES D'ACHAT CLÉS DES TECHNOLOGIES DE L'INFORMATION ET DE LA COMMUNICATION\n
    131. 6.128 PROCESSUS DE RECHERCHE DE MRFR\n
    132. 6.129 ANALYSE DRO DE TECHNOLOGIES DE L'INFORMATION ET DE LA COMMUNICATION\n
    133. 6.130 ANALYSE D'IMPACT DES FACTEURS MOTRICES : TECHNOLOGIES DE L'INFORMATION ET DE LA COMMUNICATION\n
    134. 6.131 ANALYSE D'IMPACT DES CONTRAINTES : TECHNOLOGIES DE L'INFORMATION ET DE LA COMMUNICATION\n
    135. 6.132 CHAÎNE D'APPROVISIONNEMENT / DE VALEUR : TECHNOLOGIES DE L'INFORMATION ET DE LA COMMUNICATION\n
    136. 6.133 TECHNOLOGIES DE L'INFORMATION ET DE LA COMMUNICATION, PAR COMPOSANT, 2024 (% PART)\n \n
    137. 6.134 TECHNOLOGIES DE L'INFORMATION ET DE LA COMMUNICATION, PAR COMPOSANT, 2024 À 2035 (milliards USD)\n \n
    138. 6.135 TECHNOLOGIES DE L'INFORMATION ET DE LA COMMUNICATION, PAR TYPE DE SERVICE, 2024 (% PART)\n \n
    139. 6.136 TECHNOLOGIES DE L'INFORMATION ET DE LA COMMUNICATION, PAR TYPE DE SERVICE, 2024 À 2035 (milliards USD)\n \n
    140. 6.137 TECHNOLOGIES DE L'INFORMATION ET DE LA COMMUNICATION, PAR MODÈLE DE SERVICE, 2024 (% PART)\n \n
    141. 6.138 TECHNOLOGIES DE L'INFORMATION ET DE LA COMMUNICATION, PAR MODÈLE DE SERVICE, 2024 À 2035 (milliards USD)\n \n
    142. 6.139 TECHNOLOGIES DE L'INFORMATION ET DE LA COMMUNICATION, PAR TAILLE D'ORGANISATION, 2024 (% PART)\n \n
    143. 6.140 TECHNOLOGIES DE L'INFORMATION ET DE LA COMMUNICATION, PAR TAILLE D'ORGANISATION, 2024 À 2035 (milliards USD)\n \n
    144. 6.141 TECHNOLOGIES DE L'INFORMATION ET DE LA COMMUNICATION, PAR SECTEUR, 2024 (% PART)\n \n
    145. 6.142 TECHNOLOGIES DE L'INFORMATION ET DE LA COMMUNICATION, PAR SECTEUR, 2024 À 2035 (milliards USD)\n \n
    146. 6.143 ÉVALUATION COMPARATIVE DES PRINCIPAUX CONCURRENTS\n7 LISTE DES TABLEAUX\n \n
    147. 7.1 LISTE DES HYPOTHÈSES\n \n
      1. 7.1.1 \n \n
    148. 7.2 ESTIMATIONS DE TAILLE DU MARCHÉ EN AMÉRIQUE DU NORD ; PRÉVISIONS\n \n
      1. 7.2.1 PAR COMPOSANT, 2025-2035 (milliards USD)\n \n
      2. 7.2.2 PAR TYPE DE SERVICE, 2025-2035 (milliards USD)\n \n
      3. 7.2.3 PAR MODÈLE DE SERVICE, 2025-2035 (milliards USD)\n \n
      4. 7.2.4 PAR TAILLE D'ORGANISATION, 2025-2035 (milliards USD)\n \n
      5. 7.2.5 PAR SECTEUR, 2025-2035 (milliards USD)\n \n
    149. 7.3 ESTIMATIONS DE TAILLE DU MARCHÉ AUX ÉTATS-UNIS ; PRÉVISIONS\n \n
      1. 7.3.1 PAR COMPOSANT, 2025-2035 (milliards USD)\n \n
      2. 7.3.2 PAR TYPE DE SERVICE, 2025-2035 (milliards USD)\n \n
      3. 7.3.3 PAR MODÈLE DE SERVICE, 2025-2035 (milliards USD)\n \n
      4. 7.3.4 PAR TAILLE D'ORGANISATION, 2025-2035 (milliards USD)\n \n
      5. 7.3.5 PAR SECTEUR, 2025-2035 (milliards USD)\n \n
    150. 7.4 ESTIMATIONS DE TAILLE DU MARCHÉ AU CANADA ; PRÉVISIONS\n \n
      1. 7.4.1 PAR COMPOSANT, 2025-2035 (milliards USD)\n \n
      2. 7.4.2 PAR TYPE DE SERVICE, 2025-2035 (milliards USD)\n \n
      3. 7.4.3 PAR MODÈLE DE SERVICE, 2025-2035 (milliards USD)\n \n
      4. 7.4.4 PAR TAILLE D'ORGANISATION, 2025-2035 (milliards USD)\n \n
      5. 7.4.5 PAR SECTEUR, 2025-2035 (milliards USD)\n \n
    151. 7.5 ESTIMATIONS DE TAILLE DU MARCHÉ EN EUROPE ; PRÉVISIONS\n \n
      1. 7.5.1 PAR COMPOSANT, 2025-2035 (milliards USD)\n \n
      2. 7.5.2 PAR TYPE DE SERVICE, 2025-2035 (milliards USD)\n \n
      3. 7.5.3 PAR MODÈLE DE SERVICE, 2025-2035 (milliards USD)\n \n
      4. 7.5.4 PAR TAILLE D'ORGANISATION, 2025-2035 (milliards USD)\n \n
      5. 7.5.5 PAR SECTEUR, 2025-2035 (milliards USD)\n \n
    152. 7.6 ESTIMATIONS DE TAILLE DU MARCHÉ EN ALLEMAGNE ; PRÉVISIONS\n \n
      1. 7.6.1 PAR COMPOSANT, 2025-2035 (milliards USD)\n \n
      2. 7.6.2 PAR TYPE DE SERVICE, 2025-2035 (milliards USD)\n \n
      3. 7.6.3 PAR MODÈLE DE SERVICE, 2025-2035 (milliards USD)\n \n
      4. 7.6.4 PAR TAILLE D'ORGANISATION, 2025-2035 (milliards USD)\n \n
      5. 7.6.5 PAR SECTEUR, 2025-2035 (milliards USD)\n \n
    153. 7.7 ESTIMATIONS DE TAILLE DU MARCHÉ AU ROYAUME-UNI ; PRÉVISIONS\n \n
      1. 7.7.1 PAR COMPOSANT, 2025-2035 (milliards USD)\n \n
      2. 7.7.2 PAR TYPE DE SERVICE, 2025-2035 (milliards USD)\n \n
      3. 7.7.3 PAR MODÈLE DE SERVICE, 2025-2035 (milliards USD)\n \n
      4. 7.7.4 PAR TAILLE D'ORGANISATION, 2025-2035 (milliards USD)\n \n
      5. 7.7.5 PAR SECTEUR, 2025-2035 (milliards USD)\n \n
    154. 7.8 ESTIMATIONS DE TAILLE DU MARCHÉ EN FRANCE ; PRÉVISIONS\n \n
      1. 7.8.1 PAR COMPOSANT, 2025-2035 (milliards USD)\n \n
      2. 7.8.2 PAR TYPE DE SERVICE, 2025-2035 (milliards USD)\n \n
      3. 7.8.3 PAR MODÈLE DE SERVICE, 2025-2035 (milliards USD)\n \n
      4. 7.8.4 PAR TAILLE D'ORGANISATION, 2025-2035 (milliards USD)\n \n
      5. 7.8.5 PAR SECTEUR, 2025-2035 (milliards USD)\n \n
    155. 7.9 ESTIMATIONS DE TAILLE DU MARCHÉ EN RUSSIE ; PRÉVISIONS\n \n
      1. 7.9.1 PAR COMPOSANT, 2025-2035 (milliards USD)\n \n
      2. 7.9.2 PAR TYPE DE SERVICE, 2025-2035 (milliards USD)\n \n
      3. 7.9.3 PAR MODÈLE DE SERVICE, 2025-2035 (milliards USD)\n \n
      4. 7.9.4 PAR TAILLE D'ORGANISATION, 2025-2035 (milliards USD)\n \n
      5. 7.9.5 PAR SECTEUR, 2025-2035 (milliards USD)\n \n
    156. 7.10 ESTIMATIONS DE TAILLE DU MARCHÉ EN ITALIE ; PRÉVISIONS\n \n
      1. 7.10.1 PAR COMPOSANT, 2025-2035 (milliards USD)\n \n
      2. 7.10.2 PAR TYPE DE SERVICE, 2025-2035 (milliards USD)\n \n
      3. 7.10.3 PAR MODÈLE DE SERVICE, 2025-2035 (milliards USD)\n \n
      4. 7.10.4 PAR TAILLE D'ORGANISATION, 2025-2035 (milliards USD)\n \n
      5. 7.10.5 PAR SECTEUR, 2025-2035 (milliards USD)\n \n
    157. 7.11 ESTIMATIONS DE TAILLE DU MARCHÉ EN ESPAGNE ; PRÉVISIONS\n \n
      1. 7.11.1 PAR COMPOSANT, 2025-2035 (milliards USD)\n \n
      2. 7.11.2 PAR TYPE DE SERVICE, 2025-2035 (milliards USD)\n \n
      3. 7.11.3 PAR MODÈLE DE SERVICE, 2025-2035 (milliards USD)\n \n
      4. 7.11.4 PAR TAILLE D'ORGANISATION, 2025-2035 (milliards USD)\n \n
      5. 7.11.5 PAR SECTEUR, 2025-2035 (milliards USD)\n \n
    158. 7.12 ESTIMATIONS DE TAILLE DU MARCHÉ DANS LE RESTE DE L'EUROPE ; PRÉVISIONS\n \n
      1. 7.12.1 PAR COMPOSANT, 2025-2035 (milliards USD)\n \n
      2. 7.12.2 PAR TYPE DE SERVICE, 2025-2035 (milliards USD)\n \n
      3. 7.12.3 PAR MODÈLE DE SERVICE, 2025-2035 (milliards USD)\n \n
      4. 7.12.4 PAR TAILLE D'ORGANISATION, 2025-2035 (milliards USD)\n \n
      5. 7.12.5 PAR SECTEUR, 2025-2035 (milliards USD)\n \n
    159. 7.13 ESTIMATIONS DE TAILLE DU MARCHÉ EN APAC ; PRÉVISIONS\n \n
      1. 7.13.1 PAR COMPOSANT, 2025-2035 (milliards USD)\n \n
      2. 7.13.2 PAR TYPE DE SERVICE, 2025-2035 (milliards USD)\n \n
      3. 7.13.3 PAR MODÈLE DE SERVICE, 2025-2035 (milliards USD)\n \n
      4. 7.13.4 PAR TAILLE D'ORGANISATION, 2025-2035 (milliards USD)\n \n
      5. 7.13.5 PAR SECTEUR, 2025-2035 (milliards USD)\n \n
    160. 7.14 ESTIMATIONS DE TAILLE DU MARCHÉ EN CHINE ; PRÉVISIONS\n \n
      1. 7.14.1 PAR COMPOSANT, 2025-2035 (milliards USD)\n \n
      2. 7.14.2 PAR TYPE DE SERVICE, 2025-2035 (milliards USD)\n \n
      3. 7.14.3 PAR MODÈLE DE SERVICE, 2025-2035 (milliards USD)\n \n
      4. 7.14.4 PAR TAILLE D'ORGANISATION, 2025-2035 (milliards USD)\n \n
      5. 7.14.5 PAR SECTEUR, 2025-2035 (milliards USD)\n \n
    161. 7.15 ESTIMATIONS DE TAILLE DU MARCHÉ EN INDE ; PRÉVISIONS\n \n
      1. 7.15.1 PAR COMPOSANT, 2025-2035 (milliards USD)\n \n
      2. 7.15.2 PAR TYPE DE SERVICE, 2025-2035 (milliards USD)\n \n
      3. 7.15.3 PAR MODÈLE DE SERVICE, 2025-2035 (milliards USD)\n \n
      4. 7.15.4 PAR TAILLE D'ORGANISATION, 2025-2035 (milliards USD)\n \n
      5. 7.15.5 PAR SECTEUR, 2025-2035 (milliards USD)\n \n
    162. 7.16 ESTIMATIONS DE TAILLE DU MARCHÉ AU JAPON ; PRÉVISIONS\n \n
      1. 7.16.1 PAR COMPOSANT, 2025-2035 (milliards USD)\n \n
      2. 7.16.2 PAR TYPE DE SERVICE, 2025-2035 (milliards USD)\n \n
      3. 7.16.3 PAR MODÈLE DE SERVICE, 2025-2035 (milliards USD)\n \n
      4. 7.16.4 PAR TAILLE D'ORGANISATION, 2025-2035 (milliards USD)\n \n
      5. 7.16.5 PAR SECTEUR, 2025-2035 (milliards USD)\n \n
    163. 7.17 ESTIMATIONS DE TAILLE DU MARCHÉ EN CORÉE DU SUD ; PRÉVISIONS\n \n
      1. 7.17.1 PAR COMPOSANT, 2025-2035 (milliards USD)\n \n
      2. 7.17.2 PAR TYPE DE SERVICE, 2025-2035 (milliards USD)\n \n
      3. 7.17.3 PAR MODÈLE DE SERVICE, 2025-2035 (milliards USD)\n \n
      4. 7.17.4 PAR TAILLE D'ORGANISATION, 2025-2035 (milliards USD)\n \n
      5. 7.17.5 PAR SECTEUR, 2025-2035 (milliards USD)\n \n
    164. 7.18 ESTIMATIONS DE TAILLE DU MARCHÉ EN MALAYSIE ; PRÉVISIONS\n \n
      1. 7.18.1 PAR COMPOSANT, 2025-2035 (milliards USD)\n \n
      2. 7.18.2 PAR TYPE DE SERVICE, 2025-2035 (milliards USD)\n \n
      3. 7.18.3 PAR MODÈLE DE SERVICE, 2025-2035 (milliards USD)\n \n
      4. 7.18.4 PAR TAILLE D'ORGANISATION, 2025-2035 (milliards USD)\n \n
      5. 7.18.5 PAR SECTEUR, 2025-2035 (milliards USD)\n \n
    165. 7.19 ESTIMATIONS DE TAILLE DU MARCHÉ EN THAÏLANDE ; PRÉVISIONS\n \n
      1. 7.19.1 PAR COMPOSANT, 2025-2035 (milliards USD)\n \n
      2. 7.19.2 PAR TYPE DE SERVICE, 2025-2035 (milliards USD)\n \n
      3. 7.19.3 PAR MODÈLE DE SERVICE, 2025-2035 (milliards USD)\n \n
      4. 7.19.4 PAR TAILLE D'ORGANISATION, 2025-2035 (milliards USD)\n \n
      5. 7.19.5 PAR SECTEUR, 2025-2035 (milliards USD)\n \n
    166. 7.20 ESTIMATIONS DE TAILLE DU MARCHÉ EN INDONÉSIE ; PRÉVISIONS\n \n
      1. 7.20.1 PAR COMPOSANT, 2025-2035 (milliards USD)\n \n
      2. 7.20.2 PAR TYPE DE SERVICE, 2025-2035 (milliards USD)\n \n
      3. 7.20.3 PAR MODÈLE DE SERVICE, 2025-2035 (milliards USD)\n \n
      4. 7.20.4 PAR TAILLE D'ORGANISATION, 2025-2035 (milliards USD)\n \n
      5. 7.20.5 PAR SECTEUR, 2025-2035 (milliards USD)\n \n
    167. 7.21 ESTIMATIONS DE TAILLE DU MARCHÉ DANS LE RESTE DE L'APAC ; PRÉVISIONS\n \n
      1. 7.21.1 PAR COMPOSANT, 2025-2035 (milliards USD)\n \n
      2. 7.21.2 PAR TYPE DE SERVICE, 2025-2035 (milliards USD)\n \n
      3. 7.21.3 PAR MODÈLE DE SERVICE, 2025-2035 (milliards USD)\n \n
      4. 7.21.4 PAR TAILLE D'ORGANISATION, 2025-2035 (milliards USD)\n \n
      5. 7.21.5 PAR SECTEUR, 2025-2035 (milliards USD)\n \n
    168. 7.22 ESTIMATIONS DE TAILLE DU MARCHÉ EN AMÉRIQUE DU SUD ; PRÉVISIONS\n \n
      1. 7.22.1 PAR COMPOSANT, 2025-2035 (milliards USD)\n \n
      2. 7.22.2 PAR TYPE DE SERVICE, 2025-2035 (milliards USD)\n \n
      3. 7.22.3 PAR MODÈLE DE SERVICE, 2025-2035 (milliards USD)\n \n
      4. 7.22.4 PAR TAILLE D'ORGANISATION, 2025-2035 (milliards USD)\n \n
      5. 7.22.5 PAR SECTEUR, 2025-2035 (milliards USD)\n \n
    169. 7.23 ESTIMATIONS DE TAILLE DU MARCHÉ AU BRÉSIL ; PRÉVISIONS\n \n
      1. 7.23.1 PAR COMPOSANT, 2025-2035 (milliards USD)\n \n
      2. 7.23.2 PAR TYPE DE SERVICE, 2025-2035 (milliards USD)\n \n
      3. 7.23.3 PAR MODÈLE DE SERVICE, 2025-2035 (milliards USD)\n \n
      4. 7.23.4 PAR TAILLE D'ORGANISATION, 2025-2035 (milliards USD)\n \n
      5. 7.23.5 PAR SECTEUR, 2025-2035 (milliards USD)\n \n
    170. 7.24 ESTIMATIONS DE TAILLE DU MARCHÉ AU MEXIQUE ; PRÉVISIONS\n \n
      1. 7.24.1 PAR COMPOSANT, 2025-2035 (milliards USD)\n \n
      2. 7.24.2 PAR TYPE DE SERVICE, 2025-2035 (milliards USD)\n \n
      3. 7.24.3 PAR MODÈLE DE SERVICE, 2025-2035 (milliards USD)\n \n
      4. 7.24.4 PAR TAILLE D'ORGANISATION, 2025-2035 (milliards USD)\n \n
      5. 7.24.5 PAR SECTEUR, 2025-2035 (milliards USD)\n \n
    171. 7.25 ESTIMATIONS DE TAILLE DU MARCHÉ EN ARGENTINE ; PRÉVISIONS\n \n
      1. 7.25.1 PAR COMPOSANT, 2025-2035 (milliards USD)\n \n
      2. 7.25.2 PAR TYPE DE SERVICE, 2025-2035 (milliards USD)\n \n
      3. 7.25.3 PAR MODÈLE DE SERVICE, 2025-2035 (milliards USD)\n \n
      4. 7.25.4 PAR TAILLE D'ORGANISATION, 2025-2035 (milliards USD)\n \n
      5. 7.25.5 PAR SECTEUR, 2025-2035 (milliards USD)\n \n
    172. 7.26 ESTIMATIONS DE TAILLE DU MARCHÉ DANS LE RESTE DE L'AMÉRIQUE DU SUD ; PRÉVISIONS\n \n
      1. 7.26.1 PAR COMPOSANT, 2025-2035 (milliards USD)\n \n
      2. 7.26.2 PAR TYPE DE SERVICE, 2025-2035 (milliards USD)\n \n
      3. 7.26.3 PAR MODÈLE DE SERVICE, 2025-2035 (milliards USD)\n \n
      4. 7.26.4 PAR TAILLE D'ORGANISATION, 2025-2035 (milliards USD)\n \n
      5. 7.26.5 PAR SECTEUR, 2025-2035 (milliards USD)\n \n
    173. 7.27 ESTIMATIONS DE TAILLE DU MARCHÉ EN MEA ; PRÉVISIONS\n \n
      1. 7.27.1 PAR COMPOSANT, 2025-2035 (milliards USD)\n \n
      2. 7.27.2 PAR TYPE DE SERVICE, 2025-2035 (milliards USD)\n \n
      3. 7.27.3 PAR MODÈLE DE SERVICE, 2025-2035 (milliards USD)\n \n
      4. 7.27.4 PAR TAILLE D'ORGANISATION, 2025-2035 (milliards USD)\n \n
      5. 7.27.5 PAR SECTEUR, 2025-2035 (milliards USD)\n \n
    174. 7.28 ESTIMATIONS DE TAILLE DU MARCHÉ DANS LES PAYS DU CCG ; PRÉVISIONS\n \n
      1. 7.28.1 PAR COMPOSANT, 2025-2035 (milliards USD)\n \n
      2. 7.28.2 PAR TYPE DE SERVICE, 2025-2035 (milliards USD)\n \n
      3. 7.28.3 PAR MODÈLE DE SERVICE, 2025-2035 (milliards USD)\n \n
      4. 7.28.4 PAR TAILLE D'ORGANISATION, 2025-2035 (milliards USD)\n \n
      5. 7.28.5 PAR SECTEUR, 2025-2035 (milliards USD)\n \n
    175. 7.29 ESTIMATIONS DE TAILLE DU MARCHÉ EN AFRIQUE DU SUD ; PRÉVISIONS\n \n
      1. 7.29.1 PAR COMPOSANT, 2025-2035 (milliards USD)\n \n
      2. 7.29.2 PAR TYPE DE SERVICE, 2025-2035 (milliards USD)\n \n
      3. 7.29.3 PAR MODÈLE DE SERVICE, 2025-2035 (milliards USD)\n \n
      4. 7.29.4 PAR TAILLE D'ORGANISATION, 2025-2035 (milliards USD)\n \n
      5. 7.29.5 PAR SECTEUR, 2025-2035 (milliards USD)\n \n
    176. 7.30 ESTIMATIONS DE TAILLE DU MARCHÉ DANS LE RESTE DE MEA ; PRÉVISIONS\n \n
      1. 7.30.1 PAR COMPOSANT, 2025-2035 (milliards USD)\n \n
      2. 7.30.2 PAR TYPE DE SERVICE, 2025-2035 (milliards USD)\n \n
      3. 7.30.3 PAR MODÈLE DE SERVICE, 2025-2035 (milliards USD)\n \n
      4. 7.30.4 PAR TAILLE D'ORGANISATION, 2025-2035 (milliards USD)\n \n
      5. 7.30.5 PAR SECTEUR, 2025-2035 (milliards USD)\n \n
    177. 7.31 LANCEMENT DE PRODUIT / DÉVELOPPEMENT / APPROBATION\n \n
      1. 7.31.1 \n \n
    178. 7.32 ACQUISITION / PARTENARIAT\n \n

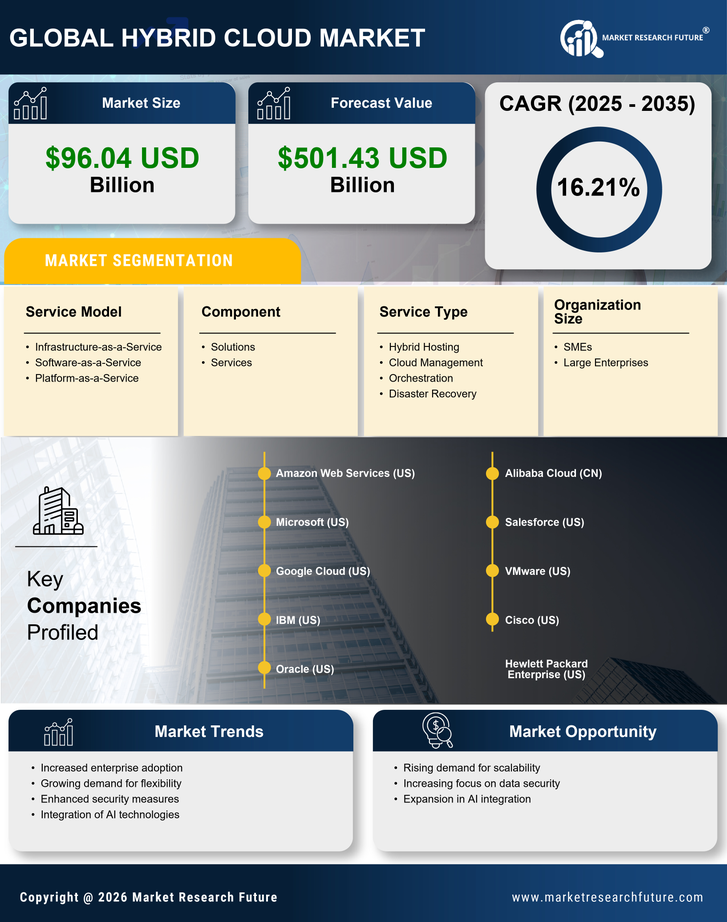
Segmentation du marché du cloud hybride

Perspectives des composants du cloud hybride (milliards USD, 2018-2032)

Solutions

Services

Perspectives des types de services de cloud hybride (milliards USD, 2018-2032)

Hébergement hybride

Gestion du cloud

Orchestration

Récupération après sinistre

Perspectives des modèles de services de cloud hybride (milliards USD, 2018-2032)

Infrastructure en tant que service

Logiciel en tant que service

Plateforme en tant que service

Perspectives de taille d'organisation du cloud hybride (milliards USD, 2018-2032)

PME

Grandes entreprises

Perspectives verticales du cloud hybride (milliards USD, 2018-2032)

BFSI

IT & Télécom

Commerce de détail

Fabrication

Médias & Divertissement

Santé

Transport

Autres

Perspectives régionales du cloud hybride (milliards USD, 2018-2032)

Perspectives de l'Amérique du Nord (milliards USD, 2018-2032)

Cloud hybride en Amérique du Nord par composant

Solutions

Services

Cloud hybride en Amérique du Nord par type de service

Hébergement hybride

Gestion du cloud

Orchestration

Récupération après sinistre

Cloud hybride en Amérique du Nord par modèle de service

Infrastructure en tant que service

Logiciel en tant que service

Plateforme en tant que service

Cloud hybride en Amérique du Nord par taille d'organisation

PME

Grandes entreprises

Cloud hybride en Amérique du Nord par secteur

BFSI

IT & Télécom

Commerce de détail

Fabrication

Médias & Divertissement

Santé

Transport

Autres

Perspectives des États-Unis (milliards USD, 2018-2032)

Cloud hybride aux États-Unis par composant

Solutions

Services

Cloud hybride aux États-Unis par type de service

Hébergement hybride

Gestion du cloud

Orchestration

Récupération après sinistre

Cloud hybride aux États-Unis par modèle de service

Infrastructure en tant que service

Logiciel en tant que service

Plateforme en tant que service

Cloud hybride aux États-Unis par taille d'organisation

PME

Grandes entreprises

Cloud hybride aux États-Unis par secteur

BFSI

IT & Télécom

Commerce de détail

Fabrication

Médias & Divertissement

Santé

Transport

Autres

Perspectives du CANADA (milliards USD, 2018-2032)

Cloud hybride au CANADA par composant

Solutions

Services

Cloud hybride au CANADA par type de service

Hébergement hybride

Gestion du cloud

Orchestration

Récupération après sinistre

Cloud hybride au CANADA par modèle de service

Infrastructure en tant que service

Logiciel en tant que service

Plateforme en tant que service

Cloud hybride au CANADA par taille d'organisation

PME

Grandes entreprises

Cloud hybride au CANADA par secteur

BFSI

IT & Télécom

Commerce de détail

Fabrication

Médias & Divertissement

Santé

Transport

Autres

Perspectives de l'Europe (milliards USD, 2018-2032)

Cloud hybride en Europe par composant

Solutions

Services

Cloud hybride en Europe par type de service

Hébergement hybride

Gestion du cloud

Orchestration

Récupération après sinistre

Cloud hybride en Europe par modèle de service

Infrastructure en tant que service

Logiciel en tant que service

Plateforme en tant que service

Cloud hybride en Europe par taille d'organisation

PME

Grandes entreprises

Cloud hybride en Europe par secteur

BFSI

IT & Télécom

Commerce de détail

Fabrication

Médias & Divertissement

Santé

Transport

Autres

Perspectives de l'Allemagne (milliards USD, 2018-2032)

Cloud hybride en Allemagne par composant

Solutions

Services

Cloud hybride en Allemagne par type de service

Hébergement hybride

Gestion du cloud

Orchestration

Récupération après sinistre

Cloud hybride en Allemagne par modèle de service

Infrastructure en tant que service

Logiciel en tant que service

Plateforme en tant que service

Cloud hybride en Allemagne par taille d'organisation

PME

Grandes entreprises

Cloud hybride en Allemagne par secteur

BFSI

IT & Télécom

Commerce de détail

Fabrication

Médias & Divertissement

Santé

Transport

Autres

Perspectives de la France (milliards USD, 2018-2032)

Cloud hybride en France par composant

Solutions

Services

Cloud hybride en France par type de service

Hébergement hybride

Gestion du cloud

Orchestration

Récupération après sinistre

Cloud hybride en France par modèle de service

Infrastructure en tant que service

Logiciel en tant que service

Plateforme en tant que service

Cloud hybride en France par taille d'organisation

PME

Grandes entreprises

Cloud hybride en France par secteur

BFSI

IT & Télécom

Commerce de détail

Fabrication

Médias & Divertissement

Santé

Transport

Autres

Perspectives du Royaume-Uni (milliards USD, 2018-2032)

Cloud hybride au Royaume-Uni par composant

Solutions

Services

Cloud hybride au Royaume-Uni par type de service

Hébergement hybride

Gestion du cloud

Orchestration

Récupération après sinistre

Cloud hybride au Royaume-Uni par modèle de service

Infrastructure en tant que service

Logiciel en tant que service

Plateforme en tant que service

Cloud hybride au Royaume-Uni par taille d'organisation

PME

Grandes entreprises

Cloud hybride au Royaume-Uni par secteur

BFSI

IT & Télécom

Commerce de détail

Fabrication

Médias & Divertissement

Santé

Transport

Autres

Perspectives de l'ITALIE (milliards USD, 2018-2032)

Cloud hybride en ITALIE par composant

Solutions

Services

Cloud hybride en ITALIE par type de service

Hébergement hybride

Gestion du cloud

Orchestration

Récupération après sinistre

Cloud hybride en ITALIE par modèle de service

Infrastructure en tant que service

Logiciel en tant que service

Plateforme en tant que service

Cloud hybride en ITALIE par taille d'organisation

PME

Grandes entreprises

Cloud hybride en ITALIE par secteur

BFSI

IT & Télécom

Commerce de détail

Fabrication

Médias & Divertissement

Santé

Transport

Autres

Perspectives de l'Espagne (milliards USD, 2018-2032)

Cloud hybride en Espagne par composant

Solutions

Services

Cloud hybride en Espagne par type de service

Hébergement hybride

Gestion du cloud

Orchestration

Récupération après sinistre

Analyse des clients en Espagne par modèle de service

Infrastructure en tant que service

Logiciel en tant que service

Plateforme en tant que service

Cloud hybride en Espagne par taille d'organisation

PME

Grandes entreprises

Cloud hybride en Espagne par secteur

BFSI

IT & Télécom

Commerce de détail

Fabrication

Médias & Divertissement

Santé

Transport

Autres

Perspectives du reste de l'Europe (milliards USD, 2018-2032)

Cloud hybride du reste de l'Europe par composant

Solutions

Services

Cloud hybride du reste de l'Europe par type de service

Hébergement hybride

Gestion du cloud

Orchestration

Récupération après sinistre

Cloud hybride du reste de l'Europe par modèle de service

Infrastructure en tant que service

Logiciel en tant que service

Plateforme en tant que service

Cloud hybride du reste de l'Europe par taille d'organisation

PME

Grandes entreprises

Cloud hybride du reste de l'Europe par secteur

BFSI

IT & Télécom

Commerce de détail

Fabrication

Médias & Divertissement

Santé

Transport

Autres

Perspectives de la région Asie-Pacifique (milliards USD, 2018-2032)

Cloud hybride en Asie-Pacifique par composant

Solutions

Services

Cloud hybride en Asie-Pacifique par type de service

Hébergement hybride

Gestion du cloud

Orchestration

Récupération après sinistre

Cloud hybride en Asie-Pacifique par modèle de service

Infrastructure en tant que service

Logiciel en tant que service

Plateforme en tant que service

Cloud hybride en Asie-Pacifique par taille d'organisation

PME

Grandes entreprises

Cloud hybride en Asie-Pacifique par secteur

BFSI

IT & Télécom

Commerce de détail

Fabrication

Médias & Divertissement

Santé

Transport

Autres

Perspectives de la Chine (milliards USD, 2018-2032)

Cloud hybride en Chine par composant

Solutions

Services

Cloud hybride en Chine par type de service

Hébergement hybride

Gestion du cloud

Orchestration

Récupération après sinistre

Cloud hybride en Chine par modèle de service

Infrastructure en tant que service

Logiciel en tant que service

Plateforme en tant que service

Cloud hybride en Chine par taille d'organisation

PME

Grandes entreprises

Cloud hybride en Chine par secteur

BFSI

IT & Télécom

Commerce de détail

Fabrication

Médias & Divertissement

Santé

Transport

Autres

Perspectives du Japon (milliards USD, 2018-2032)

Cloud hybride au Japon par composant

Solutions

Services

Cloud hybride au Japon par type de service

Hébergement hybride

Gestion du cloud

Orchestration

Récupération après sinistre

Cloud hybride au Japon par modèle de service

Infrastructure en tant que service

Logiciel en tant que service

Plateforme en tant que service

Cloud hybride au Japon par taille d'organisation

PME

Grandes entreprises

Cloud hybride au Japon par secteur

BFSI

IT & Télécom

Commerce de détail

Fabrication

Médias & Divertissement

Santé

Transport

Autres

Perspectives de l'Inde (milliards USD, 2018-2032)

Cloud hybride en Inde par composant

Solutions

Services

Cloud hybride en Inde par type de service

Hébergement hybride

Gestion du cloud

Orchestration

Récupération après sinistre

Cloud hybride en Inde par modèle de service

Infrastructure en tant que service

Logiciel en tant que service

Plateforme en tant que service

Cloud hybride en Inde par taille d'organisation

PME

Grandes entreprises

Cloud hybride en Inde par secteur

BFSI

IT & Télécom

Commerce de détail

Fabrication

Médias & Divertissement

Santé

Transport

Autres

Perspectives de l'Australie (milliards USD, 2018-2032)

Cloud hybride en Australie par composant

Solutions

Services

Cloud hybride en Australie par type de service

Hébergement hybride

Gestion du cloud

Orchestration

Récupération après sinistre

Cloud hybride en Australie par modèle de service

Infrastructure en tant que service

Logiciel en tant que service

Plateforme en tant que service

Cloud hybride en Australie par taille d'organisation

PME

Grandes entreprises

Cloud hybride en Australie par secteur

BFSI

IT & Télécom

Commerce de détail

Fabrication

Médias & Divertissement

Santé

Transport

Autres

Perspectives du reste de l'Asie-Pacifique (milliards USD, 2018-2032)

Cloud hybride du reste de l'Asie-Pacifique par composant

Solutions

Services

Cloud hybride du reste de l'Asie-Pacifique par type de service

Hébergement hybride

Gestion du cloud

Orchestration

Récupération après sinistre

Cloud hybride du reste de l'Asie-Pacifique par modèle de service

Infrastructure en tant que service

Logiciel en tant que service

Plateforme en tant que service

Cloud hybride du reste de l'Asie-Pacifique par taille d'organisation

PME

Grandes entreprises

Cloud hybride du reste de l'Asie-Pacifique par secteur

BFSI

IT & Télécom

Commerce de détail

Fabrication

Médias & Divertissement

Santé

Transport

Autres

Perspectives du reste du monde (milliards USD, 2018-2032)

Cloud hybride du reste du monde par composant

Solutions

Services

Cloud hybride du reste du monde par type de service

Hébergement hybride

Gestion du cloud

Orchestration

Récupération après sinistre

Cloud hybride du reste du monde par modèle de service

Infrastructure en tant que service

Logiciel en tant que service

Plateforme en tant que service

Cloud hybride du reste du monde par taille d'organisation

PME

Grandes entreprises

Cloud hybride du reste du monde par secteur

BFSI

IT & Télécom

Commerce de détail

Fabrication

Médias & Divertissement

Santé

Transport

Autres

Perspectives du Moyen-Orient (milliards USD, 2018-2032)

Cloud hybride au Moyen-Orient par composant

Solutions

Services

Cloud hybride au Moyen-Orient par type de service

Hébergement hybride

Gestion du cloud

Orchestration

Récupération après sinistre

Cloud hybride au Moyen-Orient par modèle de service

Infrastructure en tant que service

Logiciel en tant que service

Plateforme en tant que service

Cloud hybride au Moyen-Orient par taille d'organisation

PME

Grandes entreprises

Cloud hybride au Moyen-Orient par secteur

BFSI

IT & Télécom

Commerce de détail

Fabrication

Médias & Divertissement

Santé

Transport

Autres

Perspectives de l'Afrique (milliards USD, 2018-2032)

Cloud hybride en Afrique par composant

Solutions

Services

Cloud hybride en Afrique par type de service

Hébergement hybride

Gestion du cloud

Orchestration

Récupération après sinistre

Cloud hybride en Afrique par modèle de service

Infrastructure en tant que service

Logiciel en tant que service

Plateforme en tant que service

Cloud hybride en Afrique par taille d'organisation

PME

Grandes entreprises

Cloud hybride en Afrique par secteur

BFSI

IT & Télécom

Commerce de détail

Fabrication

Médias & Divertissement

Santé

Transport

Autres

Perspectives de l'Amérique Latine (milliards USD, 2018-2032)

Cloud hybride en Amérique Latine par composant

Solutions

Services

Cloud hybride en Amérique Latine par type de service

Hébergement hybride

Gestion du cloud

Orchestration

Récupération après sinistre

Cloud hybride en Amérique Latine par modèle de service

Infrastructure en tant que service

Logiciel en tant que service

Plateforme en tant que service

Cloud hybride en Amérique Latine par taille d'organisation

PME

Grandes entreprises

Cloud hybride en Amérique Latine par secteur

BFSI

IT & Télécom

Commerce de détail

Fabrication

Médias & Divertissement

Santé

Transport

Autres

Compare Licence

×
Features License Type
Single User Multiuser License Enterprise User
Price $4,950 $5,950 $7,250
Maximum User Access Limit 1 User Upto 10 Users Unrestricted Access Throughout the Organization
Free Customization
Direct Access to Analyst
Deliverable Format
Platform Access
Discount on Next Purchase 10% 15% 15%
Printable Versions