Marché de l'acide hyaluronique (2026 - 2035)
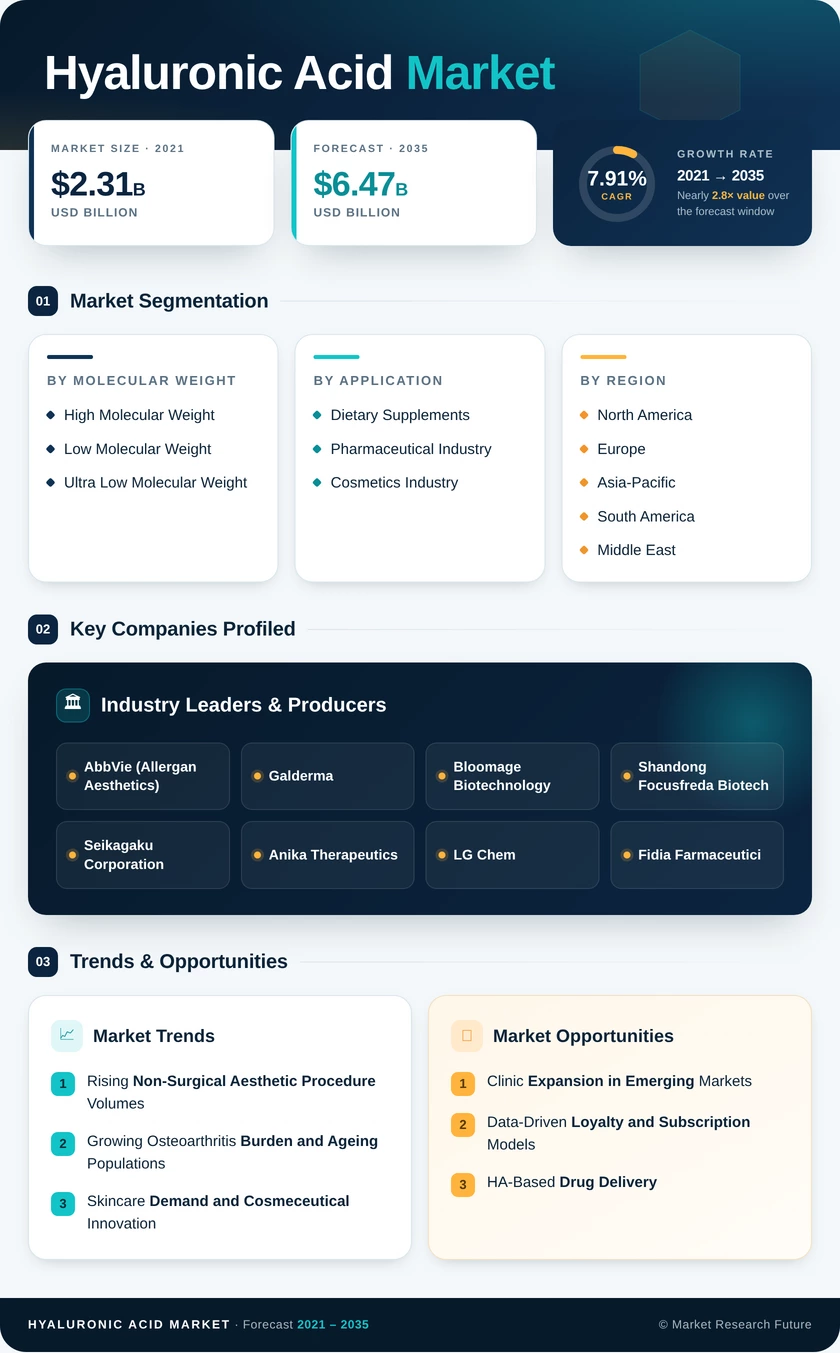
- Rising Non-Surgical Aesthetic Procedure Volumes
- Growing Osteoarthritis Burden and Ageing Populations
- Skincare Demand and Cosmeceutical Innovation
- Clinic Expansion in Emerging Markets
- Data-Driven Loyalty and Subscription Models
- HA-Based Drug Delivery
- 1 Market Summary | |
-
2 Key Report Takeaways | |
- 2.1 By Molecular Weight | |
- 2.2 By Application | |
- 2.3 By Region | |
- 3 Market Size and Forecast (2021–2035) | |
-
4 Driver Impact Analysis | |
- 4.1 Rising Non-Surgical Aesthetic Procedure Volumes | |
- 4.2 Growing Osteoarthritis Burden and Ageing Populations | |
- 4.3 Skincare Demand and Cosmeceutical Innovation | |
- 4.4 Fermentation Scale-Up Lowering Ingredient Cost | |
- 4.5 Ophthalmic Surgery Volumes | |
- 4.6 Regulatory Approval of New Indications | |
-
5 Restraints Impact Analysis | |
- 5.1 Adverse Events and Counterfeit Products | |
- 5.2 Weak Clinical Guidance for Viscosupplementation | |
- 5.3 Tighter Medical Device Regulation in Europe | |
- 5.4 Raw-Material Price Competition | |
- 5.5 Competition from Alternative Injectables | |
-
6 Opportunities | |
- 6.1 Clinic Expansion in Emerging Markets | |
- 6.2 Data-Driven Loyalty and Subscription Models | |
- 6.3 HA-Based Drug Delivery | |
- 6.4 Ophthalmic and Dry-Eye Products | |
- 6.5 Nutricosmetics and Oral Supplements | |
-
7 Regional Market Share and Country-Level Analysis | |
-
7.1 North America | | |
- 7.1.1 US | | |
- 7.1.2 Canada | | |
- 7.1.3 Mexico | |
-
7.2 Europe | | |
- 7.2.1 Germany | | |
- 7.2.2 UK | | |
- 7.2.3 France | | |
- 7.2.4 Italy | | |
- 7.2.5 Spain | | |
- 7.2.6 Nordic Countries | | |
- 7.2.7 Russia | | |
- 7.2.8 Rest of Europe | |
-
7.3 Asia-Pacific | | |
- 7.3.1 China | | |
- 7.3.2 India | | |
- 7.3.3 Japan | | |
- 7.3.4 South Korea | | |
- 7.3.5 ASEAN | | |
- 7.3.6 Rest of Asia-Pacific | |
-
7.4 South America | | |
- 7.4.1 Brazil | | |
- 7.4.2 Argentina | | |
- 7.4.3 Rest of South America | |
-
7.5 Middle East and Africa | | |
- 7.5.1 Saudi Arabia | | |
- 7.5.2 UAE | | |
- 7.5.3 South Africa | | |
- 7.5.4 Egypt | | |
- 7.5.5 Rest of MEA | |
-
7.1 North America | | |
-
8 Future Outlook (2026–2035) | |
- 8.1 AI-Guided Diagnostics and Personalized Treatment | |
- 8.2 Synthetic Biology and Precision Manufacturing | |
- 8.3 Demographic Ageing and Medical Indications | |
- 8.4 Sustainability and Claim Substantiation | |
-
9 Segmentation Analysis | |
-
9.1 By Molecular Weight | | |
- 9.1.1 High Molecular Weight | | |
- 9.1.2 Low Molecular Weight | | |
- 9.1.3 Ultra Low Molecular Weight | |
-
9.2 By Application | | |
- 9.2.1 Dietary Supplements | | |
- 9.2.2 Pharmaceutical Industry | | |
- 9.2.3 Cosmetics Industry | |
-
9.1 By Molecular Weight | | |
- 10 Competitive Landscape | |
- 11 Recent News & Developments | |
- 12 Report Scope and Methodology | |
- 13 Detailed Sources and Citations | |
- 14 Frequently Asked Questions (FAQs) | | LIST OF TABLES | |
- TABLE 1 Global HA Market Snapshot, 2025 and 2035 | |
- TABLE 2 Global HA Market Size & Forecast, by Revenue (USD billion), 2021–2035 | |
- TABLE 3 Driver Impact Analysis, 2026–2035 | |
- TABLE 4 Restraints Impact Analysis, 2026–2035 | |
- TABLE 5 Regional Summary, by Region, 2025 (USD billion / Share / CAGR) | |
- TABLE 6 North America, Country-Level Analysis, 2025–2035 | |
- TABLE 7 Europe, Country-Level Analysis, 2025–2035 | |
- TABLE 8 Asia-Pacific, Country-Level Analysis, 2025–2035 | |
- TABLE 9 South America, Country-Level Analysis, 2025–2035 | |
- TABLE 10 Middle East and Africa, Country-Level Analysis, 2025–2035 | |
- TABLE 11 Global HA Market, by Molecular Weight, 2025–2035 | |
- TABLE 12 Global HA Market, by Application, 2025–2035 | |
- TABLE 13 Competitive Benchmarking Matrix, 2025 | |
- TABLE 14 Report Scope and Methodology | |
- TABLE 15 Detailed Sources and Citations | |
- TABLE 16 Segmentation Quick Reference | | LIST OF FIGURES | |
- FIGURE 1 Market Dynamics Overview — Drivers, Restraints and Opportunities | |
- FIGURE 2 Industry Value Chain Analysis | |
- FIGURE 3 Porter's Five Forces Analysis | |
- FIGURE 4 Global HA Market Size Trend, 2021–2035 (USD billion) | |
- FIGURE 5 Market Share by Molecular Weight, 2025 (%) | |
- FIGURE 6 Market Share by Application, 2025 (%) | |
- FIGURE 7 Regional Market Share, 2025 (%) | |
- FIGURE 8 Country-Level Share within Each Region, 2025 (%) | |
- FIGURE 9 Competitive Landscape Positioning Matrix | |
- FIGURE 10 Estimated Revenue Share Ranges of Key Players, 2025
Rapports connexes

Customer Stories

“This is really good guys. Excellent work on a tight deadline. I will continue to use you going forward and recommend you to others. Nice job”
 Noah Malgeri
Co-Founder

“Thanks for sending the report it gives us a good global view of the Betaïne market.”
 Peter Groot koerkamp
Account and Business Manager

“We found the report very insightful! we found your research firm very helpful. I'm sending this email to secure our future business.”
 Younghwan Choi
Senior Retail Manager

“I am very pleased with how market segments have been defined in a relevant way for my purposes (such as "Portable Freezers & refrigerators" and "last-mile"). In general the report is well structured. Thanks very much for your efforts.”
 Mark Irwin
Management Consultant

“We got the report in time, we really thank you for your support in this process. I also thank to all of your team as they did a great job.”
 Akif Moroglu
Strategy & Business Development Director

“The Automotive 48V ECU Components Procurement Intelligence Study” was a complex project, but the Market Research Future (MRFR) team handled it with quality, agility, and customer-centricity. They delivered all requested data on time and within the agreed scope. The team, including Shubhendra Anand and Rahul Gotadki, was always readily available to clarify questions and swiftly implement necessary adjustments, driving the project to a successful conclusion within a very demanding timeframe.
I would also like to specifically commend Akshay Agarwal for his responsiveness and support at every stage—from our initial inquiry on May 6th through to final delivery on June 18th. His dedication made the entire process seamless.”
 Guilherme Gomes Martins
Product Management Director

“Thanks. It’s been a pleasure working with you, please use me as reference with any other Intel employees.”
 Joseph Aguayo
Sales Operations & Pricing Manager

“Thank you, this will be very helpful for OQS.”
 La Terria Dodd
Program Support Specialist

“I have been reading the first document or the study, ,the Global HVAC and FP market report 2021 till 2026. Must say, good info! I have not gone in depth at all parts, but got a good indication of the data inside!”
 Rob Kooiker
Group Product Manager HVAC & Fire Protection GMA