Gin Market
-
1 Market Overview |
- 1.1 Study Assumptions & Market Definition |
- 1.2 Scope of the Study |
- 1.3 Research Methodology
- 2 Market Summary & Key Takeaways
-
3 Market Dynamics |
-
3.1 Market Drivers Analysis | |
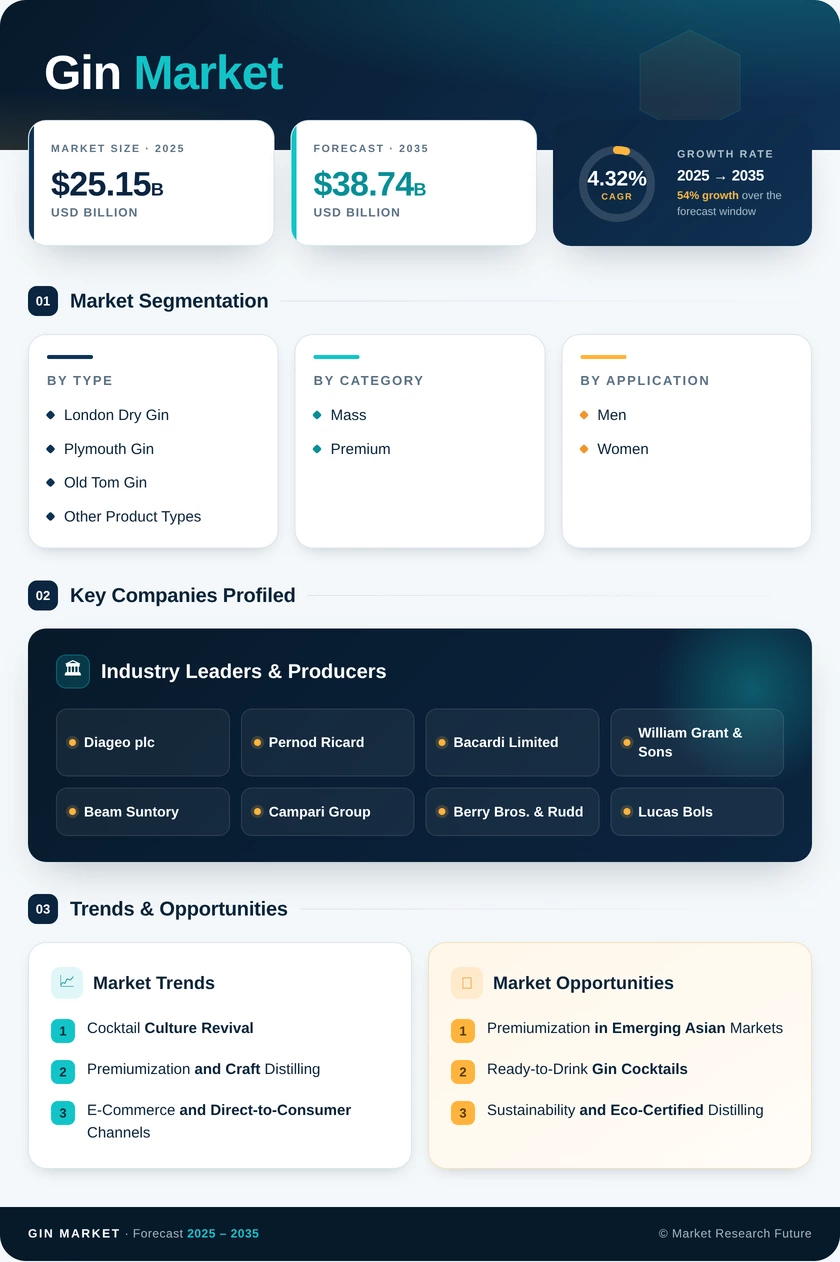
- 3.1.1 Cocktail Culture Revival | |
- 3.1.2 Premiumization and Craft Distilling | |
- 3.1.3 Botanical Innovation and Flavor Diversification | |
- 3.1.4 Expanding Middle-Class Consumption in Asia-Pacific | |
- 3.1.5 E-Commerce and DTC Spirits Channels | |
- 3.1.6 Gin Tourism and Experiential Distillery Visits | |
- 3.1.7 RTD Gin Cocktail Segment Growth |
-
3.2 Market Restraints Analysis | |
- 3.2.1 Health-Consciousness and Moderation Trends | |
- 3.2.2 Regulatory Warning Labels and Advertising Restrictions | |
- 3.2.3 High Excise Taxation on Spirits | |
- 3.2.4 Competition from Other Spirit Categories | |
- 3.2.5 Supply Chain Volatility for Botanical Ingredients |
-
3.3 Market Opportunity Analysis | |
- 3.3.1 Premiumization in Emerging Asian Markets | |
- 3.3.2 Ready-to-Drink Gin Cocktails | |
- 3.3.3 Sustainability and Eco-Certified Distilling | |
- 3.3.4 Gin Tourism and Experiential Retail | |
- 3.3.5 Data-Driven Personalization and Subscription Models |
- 3.4 Industry Value Chain Analysis |
- 3.5 Porter's Five Forces Analysis
-
3.1 Market Drivers Analysis | |
-
4 Global Gin Market Size & Forecast (2021–2035) |
- 4.1 Historical Market Size (2021–2025) |
- 4.2 Current & Forecast Market Size (2026–2035) |
- 4.3 Market Size by Revenue (USD Billion) |
- 4.4 Year-over-Year Growth Analysis
-
5 Segmentation Analysis |
-
5.1 By Product Type | |
- 5.1.1 London Dry Gin | |
- 5.1.2 Plymouth Gin | |
- 5.1.3 Old Tom Gin | |
- 5.1.4 Other Product Types (Genever, Sloe Gin, Navy Strength) |
-
5.2 By Category | |
- 5.2.1 Mass | |
- 5.2.2 Premium |
-
5.3 By End User | |
- 5.3.1 Men | |
- 5.3.2 Women |
-
5.4 By Distribution Channel | |
- 5.4.1 Off-Trade | |
- 5.4.2 On-Trade
-
5.1 By Product Type | |
-
6 Regional Analysis |
-
6.1 North America | |
- 6.1.1 United States | |
- 6.1.2 Canada | |
- 6.1.3 Mexico |
-
6.2 Europe | |
- 6.2.1 Germany | |
- 6.2.2 United Kingdom | |
- 6.2.3 France | |
- 6.2.4 Italy | |
- 6.2.5 Spain | |
- 6.2.6 Nordic Countries | |
- 6.2.7 Russia | |
- 6.2.8 Rest of Europe |
-
6.3 Asia-Pacific | |
- 6.3.1 China | |
- 6.3.2 India | |
- 6.3.3 Japan | |
- 6.3.4 South Korea | |
- 6.3.5 ASEAN | |
- 6.3.6 Rest of Asia-Pacific |
-
6.4 South America | |
- 6.4.1 Brazil | |
- 6.4.2 Argentina | |
- 6.4.3 Rest of South America |
-
6.5 Middle East & Africa | |
- 6.5.1 Saudi Arabia | |
- 6.5.2 UAE | |
- 6.5.3 South Africa | |
- 6.5.4 Egypt | |
- 6.5.5 Rest of MEA
-
6.1 North America | |
-
7 Competitive Landscape |
- 7.1 Market Share Analysis (2025) |
- 7.2 Competitive Benchmarking Matrix |
-
7.3 Company Profiles | |
- 7.3.1 Diageo plc | |
- 7.3.2 Pernod Ricard | |
- 7.3.3 Bacardi Limited | |
- 7.3.4 William Grant & Sons | |
- 7.3.5 Beam Suntory | |
- 7.3.6 Campari Group | |
- 7.3.7 Berry Bros. & Rudd | |
- 7.3.8 Lucas Bols | |
- 7.3.9 Radico Khaitan | |
- 7.3.10 Kyoto Distillery
-
8 Future Outlook & Strategic Recommendations (2026–2035) |
- 8.1 AI-Driven Flavor Discovery and Process Optimization |
- 8.2 Sustainability as a Competitive Moat |
- 8.3 Premiumization Supercycle and Ultra-Premium Positioning |
- 8.4 Non-Alcoholic and Low-ABV Gin Integration
- 9 Recent Developments & News
- 10 Frequently Asked Questions (FAQs)
-
11 Report Scope & Methodology |
- 11.1 Study Period & Base Year |
- 11.2 Data Sources & Citations |
- 11.3 Abbreviations
- 12 LIST OF TABLES |
- TABLE 1 Global Gin Market Size & Forecast, by Revenue (USD Billion), 2021–2035 |
- TABLE 2 Global Gin Market — Year-over-Year Growth Analysis, 2021–2035 |
- TABLE 3 Global Gin Market — Driver Impact Analysis |
- TABLE 4 Global Gin Market — Restraint Impact Analysis |
- TABLE 5 Global Gin Market Size, by Product Type, 2021–2035 (USD Billion) |
- TABLE 6 Global Gin Market Size, by Category, 2021–2035 (USD Billion) |
- TABLE 7 Global Gin Market Size, by End User, 2021–2035 (USD Billion) |
- TABLE 8 Global Gin Market Size, by Distribution Channel, 2021–2035 (USD Billion) |
- TABLE 9 Global Gin Market Size, by Region, 2021–2035 (USD Billion) |
- TABLE 10 North America Gin Market Size, by Country, 2021–2035 (USD Billion) |
- TABLE 11 Europe Gin Market Size, by Country, 2021–2035 (USD Billion) |
- TABLE 12 Asia-Pacific Gin Market Size, by Country, 2021–2035 (USD Billion) |
- TABLE 13 South America Gin Market Size, by Country, 2021–2035 (USD Billion) |
- TABLE 14 Middle East & Africa Gin Market Size, by Country, 2021–2035 (USD Billion) |
- TABLE 15 Competitive Benchmarking Matrix — Global Gin Market, 2025 |
- TABLE 16 Company Profiles — Key Players, Global Gin Market |
- TABLE 17 Recent Developments & Strategic Announcements, 2023–2025 |
- TABLE 18 Report Scope & Methodology Summary |
- TABLE 19 Detailed Sources and Citations
- 13 LIST OF FIGURES |
- FIGURE 1 Global Gin Market Dynamics — Drivers, Restraints, and Opportunities |
- FIGURE 2 Gin Market Industry Value Chain Analysis |
- FIGURE 3 Porter's Five Forces Analysis — Global Gin Market |
- FIGURE 4 Global Gin Market Size Trend (USD Billion), 2021–2035 |
- FIGURE 5 Global Gin Market Share, by Product Type (%), 2025 |
- FIGURE 6 Global Gin Market Share, by Category (%), 2025 |
- FIGURE 7 Global Gin Market Share, by End User (%), 2025 |
- FIGURE 8 Global Gin Market Share, by Distribution Channel (%), 2025 |
- FIGURE 9 Global Gin Market Share, by Region (%), 2025 |
- FIGURE 10 Competitive Landscape — Market Share Analysis, 2025
Customer Stories

“This is really good guys. Excellent work on a tight deadline. I will continue to use you going forward and recommend you to others. Nice job”

“Thanks. It’s been a pleasure working with you, please use me as reference with any other Intel employees.”

“Thanks for sending the report it gives us a good global view of the Betaïne market.”

“Thank you, this will be very helpful for OQS.”

“We found the report very insightful! we found your research firm very helpful. I'm sending this email to secure our future business.”

“I am very pleased with how market segments have been defined in a relevant way for my purposes (such as "Portable Freezers & refrigerators" and "last-mile"). In general the report is well structured. Thanks very much for your efforts.”

“I have been reading the first document or the study, ,the Global HVAC and FP market report 2021 till 2026. Must say, good info! I have not gone in depth at all parts, but got a good indication of the data inside!”

“We got the report in time, we really thank you for your support in this process. I also thank to all of your team as they did a great job.”