Request Free Sample ×

Kindly complete the form below to receive a free sample of this Report

* Please use a valid business email

Leading companies partner with us for data-driven Insights

clients tt-cursor
Hero Background

Marché du charbon propre par gazéification

ID: MRFR/EnP/39544-HCR
100 Pages
Chitranshi Jaiswal
Last Updated: April 06, 2026

Rapport d'étude de marché sur la gazéification du charbon propre par technologie (gazéification à lit fixe, gazéification à lit fluidisé, gazéification à flux entraîné), par type de matière première (charbon, biomasse, coke de pétrole, déchets), par application (production d'électricité, production chimique, production de gaz), par utilisation finale (production d'énergie, fabrication, transport) et par région (Amérique du Nord, Europe, Amérique du Sud, Asie-Pacifique, Moyen-Orient et Afrique) - Prévisions jusqu'en 2035.

Partager
Download PDF ×

We do not share your information with anyone. However, we may send you emails based on your report interest from time to time. You may contact us at any time to opt-out.

Gasification Clean Coal Market Infographic
Purchase Options
  1. SECTION I : RÉSUMÉ EXÉCUTIF ET POINTS CLÉS\n\n
    1. 1.1 RÉSUMÉ EXÉCUTIF\n \n
      1. 1.1.1 Vue d'ensemble du marché\n \n
      2. 1.1.2 Conclusions clés\n \n
      3. 1.1.3 Segmentation du marché\n \n
      4. 1.1.4 Paysage concurrentiel\n \n
      5. 1.1.5 Défis et opportunités\n \n
      6. 1.1.6 Perspectives d'avenir\n2
  2. SECTION II : DÉLIMITATION, MÉTHODOLOGIE ET STRUCTURE DU MARCHÉ\n
    1. 2.1 INTRODUCTION AU MARCHÉ\n \n
      1. 2.1.1 Définition\n \n
      2. 2.1.2 Portée de l'étude\n \n \n
        1. 2.1.2.1 Objectif de recherche\n \n \n
        2. 2.1.2.2 Hypothèse\n \n \n
        3. 2.1.2.3 Limitations\n
    2. 2.2 MÉTHODOLOGIE DE RECHERCHE\n \n
      1. 2.2.1 Vue d'ensemble\n \n
      2. 2.2.2 Exploration des données\n \n
      3. 2.2.3 Recherche secondaire\n \n
      4. 2.2.4 Recherche primaire\n \n \n
        1. 2.2.4.1 Interviews primaires et processus de collecte d'informations\n \n \n
        2. 2.2.4.2 Répartition des répondants principaux\n \n
      5. 2.2.5 Modèle de prévision\n \n
      6. 2.2.6 Estimation de la taille du marché\n \n \n
        1. 2.2.6.1 Approche ascendante\n \n \n
        2. 2.2.6.2 Approche descendante\n \n
      7. 2.2.7 Triangulation des données\n \n
      8. 2.2.8 Validation\n3
  3. SECTION III : ANALYSE QUALITATIVE\n
    1. 3.1 DYNAMIQUE DU MARCHÉ\n \n
      1. 3.1.1 Vue d'ensemble\n \n
      2. 3.1.2 Facteurs moteurs\n \n
      3. 3.1.3 Contraintes\n \n
      4. 3.1.4 Opportunités\n
    2. 3.2 ANALYSE DES FACTEURS DU MARCHÉ\n \n
      1. 3.2.1 Analyse de la chaîne de valeur\n \n
      2. 3.2.2 Analyse des cinq forces de Porter\n \n \n
        1. 3.2.2.1 Pouvoir de négociation des fournisseurs\n \n \n
        2. 3.2.2.2 Pouvoir de négociation des acheteurs\n \n \n
        3. 3.2.2.3 Menace des nouveaux entrants\n \n \n
        4. 3.2.2.4 Menace des substituts\n \n \n
        5. 3.2.2.5 Intensité de la rivalité\n \n
      3. 3.2.3 Analyse de l'impact du COVID-19\n \n \n
        1. 3.2.3.1 Analyse de l'impact sur le marché\n \n \n
        2. 3.2.3.2 Impact régional\n \n \n
        3. 3.2.3.3 Analyse des opportunités et des menaces\n4
  4. SECTION IV : ANALYSE QUANTITATIVE\n
    1. 4.1 Énergie et puissance, PAR technologie (milliards USD)\n \n
      1. 4.1.1 Gazéification à lit fixe\n \n
      2. 4.1.2 Gazéification à lit fluidisé\n \n
      3. 4.1.3 Gazéification à flux entraîné\n
    2. 4.2 Énergie et puissance, PAR type de matière première (milliards USD)\n \n
      1. 4.2.1 Charbon\n \n
      2. 4.2.2 Biomasse\n \n
      3. 4.2.3 Coke de pétrole\n \n
      4. 4.2.4 Matériaux de déchets\n
    3. 4.3 Énergie et puissance, PAR application (milliards USD)\n \n
      1. 4.3.1 Production d'électricité\n \n
      2. 4.3.2 Production chimique\n \n
      3. 4.3.3 Production de gaz\n
    4. 4.4 Énergie et puissance, PAR utilisation finale (milliards USD)\n \n
      1. 4.4.1 Production d'énergie\n \n
      2. 4.4.2 Fabrication\n \n
      3. 4.4.3 Transport\n
    5. 4.5 Énergie et puissance, PAR région (milliards USD)\n \n
      1. 4.5.1 Amérique du Nord\n \n \n
        1. 4.5.1.1 États-Unis\n \n \n
        2. 4.5.1.2 Canada\n \n
      2. 4.5.2 Europe\n \n \n
        1. 4.5.2.1 Allemagne\n \n \n
        2. 4.5.2.2 Royaume-Uni\n \n \n
        3. 4.5.2.3 France\n \n \n
        4. 4.5.2.4 Russie\n \n \n
        5. 4.5.2.5 Italie\n \n \n
        6. 4.5.2.6 Espagne\n \n \n
        7. 4.5.2.7 Reste de l'Europe\n \n
      3. 4.5.3 APAC\n \n \n
        1. 4.5.3.1 Chine\n \n \n
        2. 4.5.3.2 Inde\n \n \n
        3. 4.5.3.3 Japon\n \n \n
        4. 4.5.3.4 Corée du Sud\n \n \n
        5. 4.5.3.5 Malaisie\n \n \n
        6. 4.5.3.6 Thaïlande\n \n \n
        7. 4.5.3.7 Indonésie\n \n \n
        8. 4.5.3.8 Reste de l'APAC\n \n
      4. 4.5.4 Amérique du Sud\n \n \n
        1. 4.5.4.1 Brésil\n \n \n
        2. 4.5.4.2 Mexique\n \n \n
        3. 4.5.4.3 Argentine\n \n \n
        4. 4.5.4.4 Reste de l'Amérique du Sud\n \n
      5. 4.5.5 MEA\n \n \n
        1. 4.5.5.1 Pays du CCG\n \n \n
        2. 4.5.5.2 Afrique du Sud\n \n \n
        3. 4.5.5.3 Reste de la MEA\n5
  5. SECTION V : ANALYSE CONCURRENTIELLE\n
    1. 5.1 Paysage concurrentiel\n \n
      1. 5.1.1 Vue d'ensemble\n \n
      2. 5.1.2 Analyse concurrentielle\n \n
      3. 5.1.3 Analyse de la part de marché\n \n
      4. 5.1.4 Stratégie de croissance majeure dans l'énergie et la puissance\n \n
      5. 5.1.5 Évaluation comparative\n \n
      6. 5.1.6 Acteurs principaux en termes de nombre de développements dans l'énergie et la puissance\n \n
      7. 5.1.7 Développements clés et stratégies de croissance\n \n \n
        1. 5.1.7.1 Lancement de nouveaux produits / Déploiement de services\n \n \n
        2. 5.1.7.2 Fusions et acquisitions\n \n \n
        3. 5.1.7.3 Coentreprises\n \n
      8. 5.1.8 Matrice financière des principaux acteurs\n \n \n
        1. 5.1.8.1 Ventes et revenu d'exploitation\n \n \n
        2. 5.1.8.2 Dépenses de R&D des principaux acteurs. 2023\n
    2. 5.2 Profils d'entreprise\n \n
      1. 5.2.1 Air Products and Chemicals (États-Unis)\n \n \n
        1. 5.2.1.1 Vue d'ensemble financière\n \n \n
        2. 5.2.1.2 Produits offerts\n \n \n
        3. 5.2.1.3 Développements clés\n \n \n
        4. 5.2.1.4 Analyse SWOT\n \n \n
        5. 5.2.1.5 Stratégies clés\n \n
      2. 5.2.2 Shell (GB)\n \n \n
        1. 5.2.2.1 Vue d'ensemble financière\n \n \n
        2. 5.2.2.2 Produits offerts\n \n \n
        3. 5.2.2.3 Développements clés\n \n \n
        4. 5.2.2.4 Analyse SWOT\n \n \n
        5. 5.2.2.5 Stratégies clés\n \n
      3. 5.2.3 Siemens (DE)\n \n \n
        1. 5.2.3.1 Vue d'ensemble financière\n \n \n
        2. 5.2.3.2 Produits offerts\n \n \n
        3. 5.2.3.3 Développements clés\n \n \n
        4. 5.2.3.4 Analyse SWOT\n \n \n
        5. 5.2.3.5 Stratégies clés\n \n
      4. 5.2.4 General Electric (États-Unis)\n \n \n
        1. 5.2.4.1 Vue d'ensemble financière\n \n \n
        2. 5.2.4.2 Produits offerts\n \n \n
        3. 5.2.4.3 Développements clés\n \n \n
        4. 5.2.4.4 Analyse SWOT\n \n \n
        5. 5.2.4.5 Stratégies clés\n \n
      5. 5.2.5 Babcock & Wilcox (États-Unis)\n \n \n
        1. 5.2.5.1 Vue d'ensemble financière\n \n \n
        2. 5.2.5.2 Produits offerts\n \n \n
        3. 5.2.5.3 Développements clés\n \n \n
        4. 5.2.5.4 Analyse SWOT\n \n \n
        5. 5.2.5.5 Stratégies clés\n \n
      6. 5.2.6 Thyssenkrupp (DE)\n \n \n
        1. 5.2.6.1 Vue d'ensemble financière\n \n \n
        2. 5.2.6.2 Produits offerts\n \n \n
        3. 5.2.6.3 Développements clés\n \n \n
        4. 5.2.6.4 Analyse SWOT\n \n \n
        5. 5.2.6.5 Stratégies clés\n \n
      7. 5.2.7 Mitsubishi Heavy Industries (JP)\n \n \n
        1. 5.2.7.1 Vue d'ensemble financière\n \n \n
        2. 5.2.7.2 Produits offerts\n \n \n
        3. 5.2.7.3 Développements clés\n \n \n
        4. 5.2.7.4 Analyse SWOT\n \n \n
        5. 5.2.7.5 Stratégies clés\n \n
      8. 5.2.8 KBR (États-Unis)\n \n \n
        1. 5.2.8.1 Vue d'ensemble financière\n \n \n
        2. 5.2.8.2 Produits offerts\n \n \n
        3. 5.2.8.3 Développements clés\n \n \n
        4. 5.2.8.4 Analyse SWOT\n \n \n
        5. 5.2.8.5 Stratégies clés\n \n
      9. 5.2.9 Linde (DE)\n \n \n
        1. 5.2.9.1 Vue d'ensemble financière\n \n \n
        2. 5.2.9.2 Produits offerts\n \n \n
        3. 5.2.9.3 Développements clés\n \n \n
        4. 5.2.9.4 Analyse SWOT\n \n \n
        5. 5.2.9.5 Stratégies clés\n
    3. 5.3 Annexe\n \n
      1. 5.3.1 Références\n \n
      2. 5.3.2 Rapports connexes\n6 LISTE DES FIGURES\n
    4. 6.1 SYNOPSIS DU MARCHÉ\n
    5. 6.2 ANALYSE DU MARCHÉ EN AMÉRIQUE DU NORD\n
    6. 6.3 ANALYSE DU MARCHÉ AUX ÉTATS-UNIS PAR TECHNOLOGIE\n
    7. 6.4 ANALYSE DU MARCHÉ AUX ÉTATS-UNIS PAR TYPE DE MATIÈRE PREMIÈRE\n
    8. 6.5 ANALYSE DU MARCHÉ AUX ÉTATS-UNIS PAR APPLICATION\n
    9. 6.6 ANALYSE DU MARCHÉ AUX ÉTATS-UNIS PAR UTILISATION FINALE\n
    10. 6.7 ANALYSE DU MARCHÉ AU CANADA PAR TECHNOLOGIE\n
    11. 6.8 ANALYSE DU MARCHÉ AU CANADA PAR TYPE DE MATIÈRE PREMIÈRE\n
    12. 6.9 ANALYSE DU MARCHÉ AU CANADA PAR APPLICATION\n
    13. 6.10 ANALYSE DU MARCHÉ AU CANADA PAR UTILISATION FINALE\n
    14. 6.11 ANALYSE DU MARCHÉ EN EUROPE\n
    15. 6.12 ANALYSE DU MARCHÉ EN ALLEMAGNE PAR TECHNOLOGIE\n
    16. 6.13 ANALYSE DU MARCHÉ EN ALLEMAGNE PAR TYPE DE MATIÈRE PREMIÈRE\n
    17. 6.14 ANALYSE DU MARCHÉ EN ALLEMAGNE PAR APPLICATION\n
    18. 6.15 ANALYSE DU MARCHÉ EN ALLEMAGNE PAR UTILISATION FINALE\n
    19. 6.16 ANALYSE DU MARCHÉ AU ROYAUME-UNI PAR TECHNOLOGIE\n
    20. 6.17 ANALYSE DU MARCHÉ AU ROYAUME-UNI PAR TYPE DE MATIÈRE PREMIÈRE\n
    21. 6.18 ANALYSE DU MARCHÉ AU ROYAUME-UNI PAR APPLICATION\n
    22. 6.19 ANALYSE DU MARCHÉ AU ROYAUME-UNI PAR UTILISATION FINALE\n
    23. 6.20 ANALYSE DU MARCHÉ EN FRANCE PAR TECHNOLOGIE\n
    24. 6.21 ANALYSE DU MARCHÉ EN FRANCE PAR TYPE DE MATIÈRE PREMIÈRE\n
    25. 6.22 ANALYSE DU MARCHÉ EN FRANCE PAR APPLICATION\n
    26. 6.23 ANALYSE DU MARCHÉ EN FRANCE PAR UTILISATION FINALE\n
    27. 6.24 ANALYSE DU MARCHÉ EN RUSSIE PAR TECHNOLOGIE\n
    28. 6.25 ANALYSE DU MARCHÉ EN RUSSIE PAR TYPE DE MATIÈRE PREMIÈRE\n
    29. 6.26 ANALYSE DU MARCHÉ EN RUSSIE PAR APPLICATION\n
    30. 6.27 ANALYSE DU MARCHÉ EN RUSSIE PAR UTILISATION FINALE\n
    31. 6.28 ANALYSE DU MARCHÉ EN ITALIE PAR TECHNOLOGIE\n
    32. 6.29 ANALYSE DU MARCHÉ EN ITALIE PAR TYPE DE MATIÈRE PREMIÈRE\n
    33. 6.30 ANALYSE DU MARCHÉ EN ITALIE PAR APPLICATION\n
    34. 6.31 ANALYSE DU MARCHÉ EN ITALIE PAR UTILISATION FINALE\n
    35. 6.32 ANALYSE DU MARCHÉ EN ESPAGNE PAR TECHNOLOGIE\n
    36. 6.33 ANALYSE DU MARCHÉ EN ESPAGNE PAR TYPE DE MATIÈRE PREMIÈRE\n
    37. 6.34 ANALYSE DU MARCHÉ EN ESPAGNE PAR APPLICATION\n
    38. 6.35 ANALYSE DU MARCHÉ EN ESPAGNE PAR UTILISATION FINALE\n
    39. 6.36 ANALYSE DU MARCHÉ DANS LE RESTE DE L'EUROPE PAR TECHNOLOGIE\n
    40. 6.37 ANALYSE DU MARCHÉ DANS LE RESTE DE L'EUROPE PAR TYPE DE MATIÈRE PREMIÈRE\n
    41. 6.38 ANALYSE DU MARCHÉ DANS LE RESTE DE L'EUROPE PAR APPLICATION\n
    42. 6.39 ANALYSE DU MARCHÉ DANS LE RESTE DE L'EUROPE PAR UTILISATION FINALE\n
    43. 6.40 ANALYSE DU MARCHÉ EN APAC\n
    44. 6.41 ANALYSE DU MARCHÉ EN CHINE PAR TECHNOLOGIE\n
    45. 6.42 ANALYSE DU MARCHÉ EN CHINE PAR TYPE DE MATIÈRE PREMIÈRE\n
    46. 6.43 ANALYSE DU MARCHÉ EN CHINE PAR APPLICATION\n
    47. 6.44 ANALYSE DU MARCHÉ EN CHINE PAR UTILISATION FINALE\n
    48. 6.45 ANALYSE DU MARCHÉ EN INDE PAR TECHNOLOGIE\n
    49. 6.46 ANALYSE DU MARCHÉ EN INDE PAR TYPE DE MATIÈRE PREMIÈRE\n
    50. 6.47 ANALYSE DU MARCHÉ EN INDE PAR APPLICATION\n
    51. 6.48 ANALYSE DU MARCHÉ EN INDE PAR UTILISATION FINALE\n
    52. 6.49 ANALYSE DU MARCHÉ AU JAPON PAR TECHNOLOGIE\n
    53. 6.50 ANALYSE DU MARCHÉ AU JAPON PAR TYPE DE MATIÈRE PREMIÈRE\n
    54. 6.51 ANALYSE DU MARCHÉ AU JAPON PAR APPLICATION\n
    55. 6.52 ANALYSE DU MARCHÉ AU JAPON PAR UTILISATION FINALE\n
    56. 6.53 ANALYSE DU MARCHÉ EN CORÉE DU SUD PAR TECHNOLOGIE\n
    57. 6.54 ANALYSE DU MARCHÉ EN CORÉE DU SUD PAR TYPE DE MATIÈRE PREMIÈRE\n
    58. 6.55 ANALYSE DU MARCHÉ EN CORÉE DU SUD PAR APPLICATION\n
    59. 6.56 ANALYSE DU MARCHÉ EN CORÉE DU SUD PAR UTILISATION FINALE\n
    60. 6.57 ANALYSE DU MARCHÉ EN MALAYSIE PAR TECHNOLOGIE\n
    61. 6.58 ANALYSE DU MARCHÉ EN MALAYSIE PAR TYPE DE MATIÈRE PREMIÈRE\n
    62. 6.59 ANALYSE DU MARCHÉ EN MALAYSIE PAR APPLICATION\n
    63. 6.60 ANALYSE DU MARCHÉ EN MALAYSIE PAR UTILISATION FINALE\n
    64. 6.61 ANALYSE DU MARCHÉ EN THAÏLANDE PAR TECHNOLOGIE\n
    65. 6.62 ANALYSE DU MARCHÉ EN THAÏLANDE PAR TYPE DE MATIÈRE PREMIÈRE\n
    66. 6.63 ANALYSE DU MARCHÉ EN THAÏLANDE PAR APPLICATION\n
    67. 6.64 ANALYSE DU MARCHÉ EN THAÏLANDE PAR UTILISATION FINALE\n
    68. 6.65 ANALYSE DU MARCHÉ EN INDONÉSIE PAR TECHNOLOGIE\n
    69. 6.66 ANALYSE DU MARCHÉ EN INDONÉSIE PAR TYPE DE MATIÈRE PREMIÈRE\n
    70. 6.67 ANALYSE DU MARCHÉ EN INDONÉSIE PAR APPLICATION\n
    71. 6.68 ANALYSE DU MARCHÉ EN INDONÉSIE PAR UTILISATION FINALE\n
    72. 6.69 ANALYSE DU MARCHÉ DANS LE RESTE DE L'APAC PAR TECHNOLOGIE\n
    73. 6.70 ANALYSE DU MARCHÉ DANS LE RESTE DE L'APAC PAR TYPE DE MATIÈRE PREMIÈRE\n
    74. 6.71 ANALYSE DU MARCHÉ DANS LE RESTE DE L'APAC PAR APPLICATION\n
    75. 6.72 ANALYSE DU MARCHÉ DANS LE RESTE DE L'APAC PAR UTILISATION FINALE\n
    76. 6.73 ANALYSE DU MARCHÉ EN AMÉRIQUE DU SUD\n
    77. 6.74 ANALYSE DU MARCHÉ AU BRÉSIL PAR TECHNOLOGIE\n
    78. 6.75 ANALYSE DU MARCHÉ AU BRÉSIL PAR TYPE DE MATIÈRE PREMIÈRE\n
    79. 6.76 ANALYSE DU MARCHÉ AU BRÉSIL PAR APPLICATION\n
    80. 6.77 ANALYSE DU MARCHÉ AU BRÉSIL PAR UTILISATION FINALE\n
    81. 6.78 ANALYSE DU MARCHÉ AU MEXIQUE PAR TECHNOLOGIE\n
    82. 6.79 ANALYSE DU MARCHÉ AU MEXIQUE PAR TYPE DE MATIÈRE PREMIÈRE\n
    83. 6.80 ANALYSE DU MARCHÉ AU MEXIQUE PAR APPLICATION\n
    84. 6.81 ANALYSE DU MARCHÉ AU MEXIQUE PAR UTILISATION FINALE\n
    85. 6.82 ANALYSE DU MARCHÉ EN ARGENTINE PAR TECHNOLOGIE\n
    86. 6.83 ANALYSE DU MARCHÉ EN ARGENTINE PAR TYPE DE MATIÈRE PREMIÈRE\n
    87. 6.84 ANALYSE DU MARCHÉ EN ARGENTINE PAR APPLICATION\n
    88. 6.85 ANALYSE DU MARCHÉ EN ARGENTINE PAR UTILISATION FINALE\n
    89. 6.86 ANALYSE DU MARCHÉ DANS LE RESTE DE L'AMÉRIQUE DU SUD PAR TECHNOLOGIE\n
    90. 6.87 ANALYSE DU MARCHÉ DANS LE RESTE DE L'AMÉRIQUE DU SUD PAR TYPE DE MATIÈRE PREMIÈRE\n
    91. 6.88 ANALYSE DU MARCHÉ DANS LE RESTE DE L'AMÉRIQUE DU SUD PAR APPLICATION\n
    92. 6.89 ANALYSE DU MARCHÉ DANS LE RESTE DE L'AMÉRIQUE DU SUD PAR UTILISATION FINALE\n
    93. 6.90 ANALYSE DU MARCHÉ EN MEA\n
    94. 6.91 ANALYSE DU MARCHÉ DANS LES PAYS DU CCG PAR TECHNOLOGIE\n
    95. 6.92 ANALYSE DU MARCHÉ DANS LES PAYS DU CCG PAR TYPE DE MATIÈRE PREMIÈRE\n
    96. 6.93 ANALYSE DU MARCHÉ DANS LES PAYS DU CCG PAR APPLICATION\n
    97. 6.94 ANALYSE DU MARCHÉ DANS LES PAYS DU CCG PAR UTILISATION FINALE\n
    98. 6.95 ANALYSE DU MARCHÉ EN AFRIQUE DU SUD PAR TECHNOLOGIE\n
    99. 6.96 ANALYSE DU MARCHÉ EN AFRIQUE DU SUD PAR TYPE DE MATIÈRE PREMIÈRE\n
    100. 6.97 ANALYSE DU MARCHÉ EN AFRIQUE DU SUD PAR APPLICATION\n
    101. 6.98 ANALYSE DU MARCHÉ EN AFRIQUE DU SUD PAR UTILISATION FINALE\n
    102. 6.99 ANALYSE DU MARCHÉ DANS LE RESTE DE LA MEA PAR TECHNOLOGIE\n
    103. 6.100 ANALYSE DU MARCHÉ DANS LE RESTE DE LA MEA PAR TYPE DE MATIÈRE PREMIÈRE\n
    104. 6.101 ANALYSE DU MARCHÉ DANS LE RESTE DE LA MEA PAR APPLICATION\n
    105. 6.102 ANALYSE DU MARCHÉ DANS LE RESTE DE LA MEA PAR UTILISATION FINALE\n
    106. 6.103 CRITÈRES D'ACHAT CLÉS DE L'ÉNERGIE ET DE LA PUISSANCE\n
    107. 6.104 PROCESSUS DE RECHERCHE DE MRFR\n
    108. 6.105 ANALYSE DRO DE L'ÉNERGIE ET DE LA PUISSANCE\n
    109. 6.106 ANALYSE D'IMPACT DES FACTEURS : ÉNERGIE ET PUISSANCE\n
    110. 6.107 ANALYSE D'IMPACT DES CONTRAINTES : ÉNERGIE ET PUISSANCE\n
    111. 6.108 CHAÎNE D'APPROVISIONNEMENT / VALEUR : ÉNERGIE ET PUISSANCE\n
    112. 6.109 ÉNERGIE ET PUISSANCE, PAR TECHNOLOGIE, 2024 (% PART)\n
    113. 6.110 ÉNERGIE ET PUISSANCE, PAR TECHNOLOGIE, 2024 À 2035 (milliards USD)\n
    114. 6.111 ÉNERGIE ET PUISSANCE, PAR TYPE DE MATIÈRE PREMIÈRE, 2024 (% PART)\n
    115. 6.112 ÉNERGIE ET PUISSANCE, PAR TYPE DE MATIÈRE PREMIÈRE, 2024 À 2035 (milliards USD)\n
    116. 6.113 ÉNERGIE ET PUISSANCE, PAR APPLICATION, 2024 (% PART)\n
    117. 6.114 ÉNERGIE ET PUISSANCE, PAR APPLICATION, 2024 À 2035 (milliards USD)\n
    118. 6.115 ÉNERGIE ET PUISSANCE, PAR UTILISATION FINALE, 2024 (% PART)\n
    119. 6.116 ÉNERGIE ET PUISSANCE, PAR UTILISATION FINALE, 2024 À 2035 (milliards USD)\n
    120. 6.117 ÉVALUATION DES PRINCIPAUX CONCURRENTS\n7 LISTE DES TABLEAUX\n
    121. 7.1 LISTE DES HYPOTHÈSES\n \n
      1. 7.1.1 \n \n
    122. 7.2 ESTIMATIONS DE LA TAILLE DU MARCHÉ EN AMÉRIQUE DU NORD ; PRÉVISIONS\n \n
      1. 7.2.1 PAR TECHNOLOGIE, 2025-2035 (milliards USD)\n \n
      2. 7.2.2 PAR TYPE DE MATIÈRE PREMIÈRE, 2025-2035 (milliards USD)\n \n
      3. 7.2.3 PAR APPLICATION, 2025-2035 (milliards USD)\n \n
      4. 7.2.4 PAR UTILISATION FINALE, 2025-2035 (milliards USD)\n
    123. 7.3 ESTIMATIONS DE LA TAILLE DU MARCHÉ AUX ÉTATS-UNIS ; PRÉVISIONS\n \n
      1. 7.3.1 PAR TECHNOLOGIE, 2025-2035 (milliards USD)\n \n
      2. 7.3.2 PAR TYPE DE MATIÈRE PREMIÈRE, 2025-2035 (milliards USD)\n \n
      3. 7.3.3 PAR APPLICATION, 2025-2035 (milliards USD)\n \n
      4. 7.3.4 PAR UTILISATION FINALE, 2025-2035 (milliards USD)\n
    124. 7.4 ESTIMATIONS DE LA TAILLE DU MARCHÉ AU CANADA ; PRÉVISIONS\n \n
      1. 7.4.1 PAR TECHNOLOGIE, 2025-2035 (milliards USD)\n \n
      2. 7.4.2 PAR TYPE DE MATIÈRE PREMIÈRE, 2025-2035 (milliards USD)\n \n
      3. 7.4.3 PAR APPLICATION, 2025-2035 (milliards USD)\n \n
      4. 7.4.4 PAR UTILISATION FINALE, 2025-2035 (milliards USD)\n
    125. 7.5 ESTIMATIONS DE LA TAILLE DU MARCHÉ EN EUROPE ; PRÉVISIONS\n \n
      1. 7.5.1 PAR TECHNOLOGIE, 2025-2035 (milliards USD)\n \n
      2. 7.5.2 PAR TYPE DE MATIÈRE PREMIÈRE, 2025-2035 (milliards USD)\n \n
      3. 7.5.3 PAR APPLICATION, 2025-2035 (milliards USD)\n \n
      4. 7.5.4 PAR UTILISATION FINALE, 2025-2035 (milliards USD)\n
    126. 7.6 ESTIMATIONS DE LA TAILLE DU MARCHÉ EN ALLEMAGNE ; PRÉVISIONS\n \n
      1. 7.6.1 PAR TECHNOLOGIE, 2025-2035 (milliards USD)\n \n
      2. 7.6.2 PAR TYPE DE MATIÈRE PREMIÈRE, 2025-2035 (milliards USD)\n \n
      3. 7.6.3 PAR APPLICATION, 2025-2035 (milliards USD)\n \n
      4. 7.6.4 PAR UTILISATION FINALE, 2025-2035 (milliards USD)\n
    127. 7.7 ESTIMATIONS DE LA TAILLE DU MARCHÉ AU ROYAUME-UNI ; PRÉVISIONS\n \n
      1. 7.7.1 PAR TECHNOLOGIE, 2025-2035 (milliards USD)\n \n
      2. 7.7.2 PAR TYPE DE MATIÈRE PREMIÈRE, 2025-2035 (milliards USD)\n \n
      3. 7.7.3 PAR APPLICATION, 2025-2035 (milliards USD)\n \n
      4. 7.7.4 PAR UTILISATION FINALE, 2025-2035 (milliards USD)\n
    128. 7.8 ESTIMATIONS DE LA TAILLE DU MARCHÉ EN FRANCE ; PRÉVISIONS\n \n
      1. 7.8.1 PAR TECHNOLOGIE, 2025-2035 (milliards USD)\n \n
      2. 7.8.2 PAR TYPE DE MATIÈRE PREMIÈRE, 2025-2035 (milliards USD)\n \n
      3. 7.8.3 PAR APPLICATION, 2025-2035 (milliards USD)\n \n
      4. 7.8.4 PAR UTILISATION FINALE, 2025-2035 (milliards USD)\n
    129. 7.9 ESTIMATIONS DE LA TAILLE DU MARCHÉ EN RUSSIE ; PRÉVISIONS\n \n
      1. 7.9.1 PAR TECHNOLOGIE, 2025-2035 (milliards USD)\n \n
      2. 7.9.2 PAR TYPE DE MATIÈRE PREMIÈRE, 2025-2035 (milliards USD)\n \n
      3. 7.9.3 PAR APPLICATION, 2025-2035 (milliards USD)\n \n
      4. 7.9.4 PAR UTILISATION FINALE, 2025-2035 (milliards USD)\n
    130. 7.10 ESTIMATIONS DE LA TAILLE DU MARCHÉ EN ITALIE ; PRÉVISIONS\n \n
      1. 7.10.1 PAR TECHNOLOGIE, 2025-2035 (milliards USD)\n \n
      2. 7.10.2 PAR TYPE DE MATIÈRE PREMIÈRE, 2025-2035 (milliards USD)\n \n
      3. 7.10.3 PAR APPLICATION, 2025-2035 (milliards USD)\n \n
      4. 7.10.4 PAR UTILISATION FINALE, 2025-2035 (milliards USD)\n
    131. 7.11 ESTIMATIONS DE LA TAILLE DU MARCHÉ EN ESPAGNE ; PRÉVISIONS\n \n
      1. 7.11.1 PAR TECHNOLOGIE, 2025-2035 (milliards USD)\n \n
      2. 7.11.2 PAR TYPE DE MATIÈRE PREMIÈRE, 2025-2035 (milliards USD)\n \n
      3. 7.11.3 PAR APPLICATION, 2025-2035 (milliards USD)\n \n
      4. 7.11.4 PAR UTILISATION FINALE, 2025-2035 (milliards USD)\n
    132. 7.12 ESTIMATIONS DE LA TAILLE DU MARCHÉ DANS LE RESTE DE L'EUROPE ; PRÉVISIONS\n \n
      1. 7.12.1 PAR TECHNOLOGIE, 2025-2035 (milliards USD)\n \n
      2. 7.12.2 PAR TYPE DE MATIÈRE PREMIÈRE, 2025-2035 (milliards USD)\n \n
      3. 7.12.3 PAR APPLICATION, 2025-2035 (milliards USD)\n \n
      4. 7.12.4 PAR UTILISATION FINALE, 2025-2035 (milliards USD)\n
    133. 7.13 ESTIMATIONS DE LA TAILLE DU MARCHÉ EN APAC ; PRÉVISIONS\n \n
      1. 7.13.1 PAR TECHNOLOGIE, 2025-2035 (milliards USD)\n \n
      2. 7.13.2 PAR TYPE DE MATIÈRE PREMIÈRE, 2025-2035 (milliards USD)\n \n
      3. 7.13.3 PAR APPLICATION, 2025-2035 (milliards USD)\n \n
      4. 7.13.4 PAR UTILISATION FINALE, 2025-2035 (milliards USD)\n
    134. 7.14 ESTIMATIONS DE LA TAILLE DU MARCHÉ EN CHINE ; PRÉVISIONS\n \n
      1. 7.14.1 PAR TECHNOLOGIE, 2025-2035 (milliards USD)\n \n
      2. 7.14.2 PAR TYPE DE MATIÈRE PREMIÈRE, 2025-2035 (milliards USD)\n \n
      3. 7.14.3 PAR APPLICATION, 2025-2035 (milliards USD)\n \n
      4. 7.14.4 PAR UTILISATION FINALE, 2025-2035 (milliards USD)\n
    135. 7.15 ESTIMATIONS DE LA TAILLE DU MARCHÉ EN INDE ; PRÉVISIONS\n \n
      1. 7.15.1 PAR TECHNOLOGIE, 2025-2035 (milliards USD)\n \n
      2. 7.15.2 PAR TYPE DE MATIÈRE PREMIÈRE, 2025-2035 (milliards USD)\n \n
      3. 7.15.3 PAR APPLICATION, 2025-2035 (milliards USD)\n \n
      4. 7.15.4 PAR UTILISATION FINALE, 2025-2035 (milliards USD)\n
    136. 7.16 ESTIMATIONS DE LA TAILLE DU MARCHÉ AU JAPON ; PRÉVISIONS\n \n
      1. 7.16.1 PAR TECHNOLOGIE, 2025-2035 (milliards USD)\n \n
      2. 7.16.2 PAR TYPE DE MATIÈRE PREMIÈRE, 2025-2035 (milliards USD)\n \n
      3. 7.16.3 PAR APPLICATION, 2025-2035 (milliards USD)\n \n
      4. 7.16.4 PAR UTILISATION FINALE, 2025-2035 (milliards USD)\n
    137. 7.17 ESTIMATIONS DE LA TAILLE DU MARCHÉ EN CORÉE DU SUD ; PRÉVISIONS\n \n
      1. 7.17.1 PAR TECHNOLOGIE, 2025-2035 (milliards USD)\n \n
      2. 7.17.2 PAR TYPE DE MATIÈRE PREMIÈRE, 2025-2035 (milliards USD)\n \n
      3. 7.17.3 PAR APPLICATION, 2025-2035 (milliards USD)\n \n
      4. 7.17.4 PAR UTILISATION FINALE, 2025-2035 (milliards USD)\n
    138. 7.18 ESTIMATIONS DE LA TAILLE DU MARCHÉ EN MALAYSIE ; PRÉVISIONS\n \n
      1. 7.18.1 PAR TECHNOLOGIE, 2025-2035 (milliards USD)\n \n
      2. 7.18.2 PAR TYPE DE MATIÈRE PREMIÈRE, 2025-2035 (milliards USD)\n \n
      3. 7.18.3 PAR APPLICATION, 2025-2035 (milliards USD)\n \n
      4. 7.18.4 PAR UTILISATION FINALE, 2025-2035 (milliards USD)\n
    139. 7.19 ESTIMATIONS DE LA TAILLE DU MARCHÉ EN THAÏLANDE ; PRÉVISIONS\n \n
      1. 7.19.1 PAR TECHNOLOGIE, 2025-2035 (milliards USD)\n \n
      2. 7.19.2 PAR TYPE DE MATIÈRE PREMIÈRE, 2025-2035 (milliards USD)\n \n
      3. 7.19.3 PAR APPLICATION, 2025-2035 (milliards USD)\n \n
      4. 7.19.4 PAR UTILISATION FINALE, 2025-2035 (milliards USD)\n
    140. 7.20 ESTIMATIONS DE LA TAILLE DU MARCHÉ EN INDONÉSIE ; PRÉVISIONS\n \n
      1. 7.20.1 PAR TECHNOLOGIE, 2025-2035 (milliards USD)\n \n
      2. 7.20.2 PAR TYPE DE MATIÈRE PREMIÈRE, 2025-2035 (milliards USD)\n \n
      3. 7.20.3 PAR APPLICATION, 2025-2035 (milliards USD)\n \n
      4. 7.20.4 PAR UTILISATION FINALE, 2025-2035 (milliards USD)\n
    141. 7.21 ESTIMATIONS DE LA TAILLE DU MARCHÉ DANS LE RESTE DE L'APAC ; PRÉVISIONS\n \n
      1. 7.21.1 PAR TECHNOLOGIE, 2025-2035 (milliards USD)\n \n
      2. 7.21.2 PAR TYPE DE MATIÈRE PREMIÈRE, 2025-2035 (milliards USD)\n \n
      3. 7.21.3 PAR APPLICATION, 2025-2035 (milliards USD)\n \n
      4. 7.21.4 PAR UTILISATION FINALE, 2025-2035 (milliards USD)\n
    142. 7.22 ESTIMATIONS DE LA TAILLE DU MARCHÉ EN AMÉRIQUE DU SUD ; PRÉVISIONS\n \n
      1. 7.22.1 PAR TECHNOLOGIE, 2025-2035 (milliards USD)\n \n
      2. 7.22.2 PAR TYPE DE MATIÈRE PREMIÈRE, 2025-2035 (milliards USD)\n \n
      3. 7.22.3 PAR APPLICATION, 2025-2035 (milliards USD)\n \n
      4. 7.22.4 PAR UTILISATION FINALE, 2025-2035 (milliards USD)\n
    143. 7.23 ESTIMATIONS DE LA TAILLE DU MARCHÉ AU BRÉSIL ; PRÉVISIONS\n \n
      1. 7.23.1 PAR TECHNOLOGIE, 2025-2035 (milliards USD)\n \n
      2. 7.23.2 PAR TYPE DE MATIÈRE PREMIÈRE, 2025-2035 (milliards USD)\n \n
      3. 7.23.3 PAR APPLICATION, 2025-2035 (milliards USD)\n \n
      4. 7.23.4 PAR UTILISATION FINALE, 2025-2035 (milliards USD)\n
    144. 7.24 ESTIMATIONS DE LA TAILLE DU MARCHÉ AU MEXIQUE ; PRÉVISIONS\n \n
      1. 7.24.1 PAR TECHNOLOGIE, 2025-2035 (milliards USD)\n \n
      2. 7.24.2 PAR TYPE DE MATIÈRE PREMIÈRE, 2025-2035 (milliards USD)\n \n
      3. 7.24.3 PAR APPLICATION, 2025-2035 (milliards USD)\n \n
      4. 7.24.4 PAR UTILISATION FINALE, 2025-2035 (milliards USD)\n
    145. 7.25 ESTIMATIONS DE LA TAILLE DU MARCHÉ EN ARGENTINE ; PRÉVISIONS\n \n
      1. 7.25.1 PAR TECHNOLOGIE, 2025-2035 (milliards USD)\n \n
      2. 7.25.2 PAR TYPE DE MATIÈRE PREMIÈRE, 2025-2035 (milliards USD)\n \n
      3. 7.25.3 PAR APPLICATION, 2025-2035 (milliards USD)\n \n
      4. 7.25.4 PAR UTILISATION FINALE, 2025-2035 (milliards USD)\n
    146. 7.26 ESTIMATIONS DE LA TAILLE DU MARCHÉ DANS LE RESTE DE L'AMÉRIQUE DU SUD ; PRÉVISIONS\n \n
      1. 7.26.1 PAR TECHNOLOGIE, 2025-2035 (milliards USD)\n \n
      2. 7.26.2 PAR TYPE DE MATIÈRE PREMIÈRE, 2025-2035 (milliards USD)\n \n
      3. 7.26.3 PAR APPLICATION, 2025-2035 (milliards USD)\n \n
      4. 7.26.4 PAR UTILISATION FINALE, 2025-2035 (milliards USD)\n
    147. 7.27 ESTIMATIONS DE LA TAILLE DU MARCHÉ EN MEA ; PRÉVISIONS\n \n
      1. 7.27.1 PAR TECHNOLOGIE, 2025-2035 (milliards USD)\n \n
      2. 7.27.2 PAR TYPE DE MATIÈRE PREMIÈRE, 2025-2035 (milliards USD)\n \n
      3. 7.27.3 PAR APPLICATION, 2025-2035 (milliards USD)\n \n
      4. 7.27.4 PAR UTILISATION FINALE, 2025-2035 (milliards USD)\n
    148. 7.28 ESTIMATIONS DE LA TAILLE DU MARCHÉ DANS LES PAYS DU CCG ; PRÉVISIONS\n \n
      1. 7.28.1 PAR TECHNOLOGIE, 2025-2035 (milliards USD)\n \n
      2. 7.28.2 PAR TYPE DE MATIÈRE PREMIÈRE, 2025-2035 (milliards USD)\n \n
      3. 7.28.3 PAR APPLICATION, 2025-2035 (milliards USD)\n \n
      4. 7.28.4 PAR UTILISATION FINALE, 2025-2035 (milliards USD)\n
    149. 7.29 ESTIMATIONS DE LA TAILLE DU MARCHÉ EN AFRIQUE DU SUD ; PRÉVISIONS\n \n
      1. 7.29.1 PAR TECHNOLOGIE, 2025-2035 (milliards USD)\n \n
      2. 7.29.2 PAR TYPE DE MATIÈRE PREMIÈRE, 2025-2035 (milliards USD)\n \n
      3. 7.29.3 PAR APPLICATION, 2025-2035 (milliards USD)\n \n
      4. 7.29.4 PAR UTILISATION FINALE, 2025-2035 (milliards USD)\n
    150. 7.30 ESTIMATIONS DE LA TAILLE DU MARCHÉ DANS LE RESTE DE LA MEA ; PRÉVISIONS\n \n
      1. 7.30.1 PAR TECHNOLOGIE, 2025-2035 (milliards USD)\n \n
      2. 7.30.2 PAR TYPE DE MATIÈRE PREMIÈRE, 2025-2035 (milliards USD)\n \n
      3. 7.30.3 PAR APPLICATION, 2025-2035 (milliards USD)\n \n
      4. 7.30.4 PAR UTILISATION FINALE, 2025-2035 (milliards USD)\n
    151. 7.31 LANCEMENT DE PRODUIT / DÉVELOPPEMENT DE PRODUIT / APPROBATION\n \n
      1. 7.31.1 \n \n
    152. 7.32 ACQUISITION / PARTENARIAT\n \n

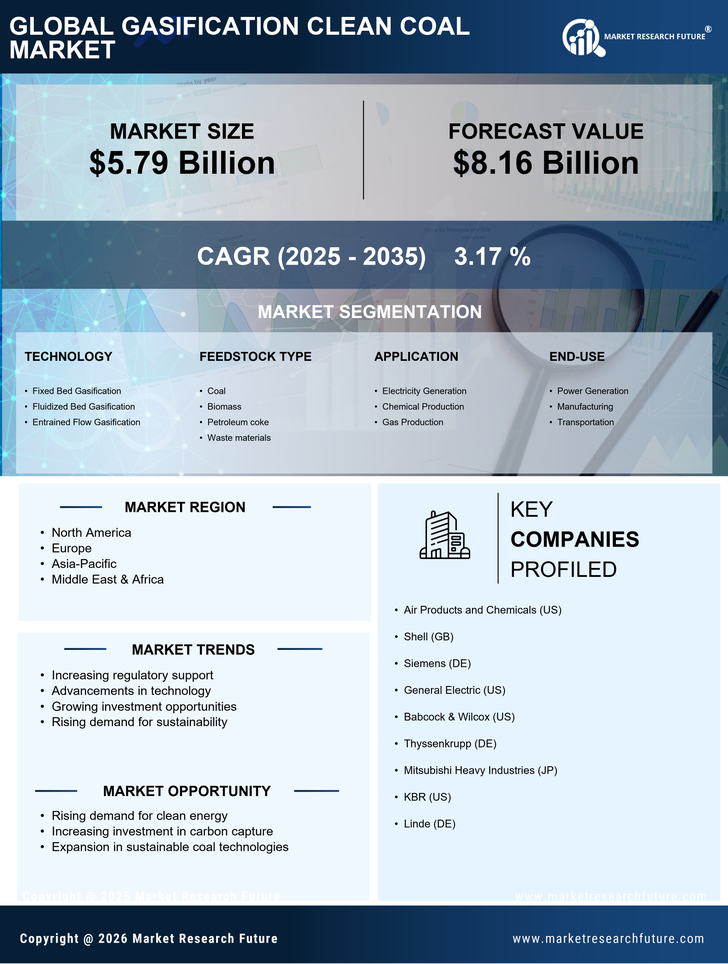
Segmentation du marché du charbon propre par gazéification

  • Marché du charbon propre par gazéification par technologie (milliards USD, 2019-2032)
    • Gazéification à lit fixe
    • Gazéification à lit fluidisé
    • Gazéification par flux entraîné
  • Marché du charbon propre par gazéification par type de matière première (milliards USD, 2019-2032)
    • Charbon
    • Biomasse
    • Coke de pétrole
    • Matériaux de déchets
  • Marché du charbon propre par gazéification par application (milliards USD, 2019-2032)
    • Production d'électricité
    • Production chimique
    • Production de gaz
  • Marché du charbon propre par gazéification par utilisation finale (milliards USD, 2019-2032)
    • Production d'énergie
    • Fabrication
    • Transport
  • Marché du charbon propre par gazéification par région (milliards USD, 2019-2032)
    • Amérique du Nord
    • Europe
    • Amérique du Sud
    • Asie-Pacifique
    • Moyen-Orient et Afrique

Perspectives régionales du marché du charbon propre par gazéification (milliards USD, 2019-2032)

  • Perspectives de l'Amérique du Nord (milliards USD, 2019-2032)
    • Marché du charbon propre par gazéification en Amérique du Nord par type de technologie
      • Gazéification à lit fixe
      • Gazéification à lit fluidisé
      • Gazéification par flux entraîné
    • Marché du charbon propre par gazéification en Amérique du Nord par type de matière première
      • Charbon
      • Biomasse
      • Coke de pétrole
      • Matériaux de déchets
    • Marché du charbon propre par gazéification en Amérique du Nord par type d'application
      • Production d'électricité
      • Production chimique
      • Production de gaz
    • Marché du charbon propre par gazéification en Amérique du Nord par type d'utilisation finale
      • Production d'énergie
      • Fabrication
      • Transport
    • Marché du charbon propre par gazéification en Amérique du Nord par type régional
      • États-Unis
      • Canada
    • Perspectives des États-Unis (milliards USD, 2019-2032)
    • Marché du charbon propre par gazéification aux États-Unis par type de technologie
      • Gazéification à lit fixe
      • Gazéification à lit fluidisé
      • Gazéification par flux entraîné
    • Marché du charbon propre par gazéification aux États-Unis par type de matière première
      • Charbon
      • Biomasse
      • Coke de pétrole
      • Matériaux de déchets
    • Marché du charbon propre par gazéification aux États-Unis par type d'application
      • Production d'électricité
      • Production chimique
      • Production de gaz
    • Marché du charbon propre par gazéification aux États-Unis par type d'utilisation finale
      • Production d'énergie
      • Fabrication
      • Transport
    • Perspectives du CANADA (milliards USD, 2019-2032)
    • Marché du charbon propre par gazéification au CANADA par type de technologie
      • Gazéification à lit fixe
      • Gazéification à lit fluidisé
      • Gazéification par flux entraîné
    • Marché du charbon propre par gazéification au CANADA par type de matière première
      • Charbon
      • Biomasse
      • Coke de pétrole
      • Matériaux de déchets
    • Marché du charbon propre par gazéification au CANADA par type d'application
      • Production d'électricité
      • Production chimique
      • Production de gaz
    • Marché du charbon propre par gazéification au CANADA par type d'utilisation finale
      • Production d'énergie
      • Fabrication
      • Transport
    • Perspectives de l'Europe (milliards USD, 2019-2032)
      • Marché du charbon propre par gazéification en Europe par type de technologie
        • Gazéification à lit fixe
        • Gazéification à lit fluidisé
        • Gazéification par flux entraîné
      • Marché du charbon propre par gazéification en Europe par type de matière première
        • Charbon
        • Biomasse
        • Coke de pétrole
        • Matériaux de déchets
      • Marché du charbon propre par gazéification en Europe par type d'application
        • Production d'électricité
        • Production chimique
        • Production de gaz
      • Marché du charbon propre par gazéification en Europe par type d'utilisation finale
        • Production d'énergie
        • Fabrication
        • Transport
      • Marché du charbon propre par gazéification en Europe par type régional
        • Allemagne
        • Royaume-Uni
        • France
        • Russie
        • Italie
        • Espagne
        • Reste de l'Europe
      • Perspectives de l'ALLEMAGNE (milliards USD, 2019-2032)
      • Marché du charbon propre par gazéification en ALLEMAGNE par type de technologie
        • Gazéification à lit fixe
        • Gazéification à lit fluidisé
        • Gazéification par flux entraîné
      • Marché du charbon propre par gazéification en ALLEMAGNE par type de matière première
        • Charbon
        • Biomasse
        • Coke de pétrole
        • Matériaux de déchets
      • Marché du charbon propre par gazéification en ALLEMAGNE par type d'application
        • Production d'électricité
        • Production chimique
        • Production de gaz
      • Marché du charbon propre par gazéification en ALLEMAGNE par type d'utilisation finale
        • Production d'énergie
        • Fabrication
        • Transport
      • Perspectives du ROYAUME-UNI (milliards USD, 2019-2032)
      • Marché du charbon propre par gazéification au ROYAUME-UNI par type de technologie
        • Gazéification à lit fixe
        • Gazéification à lit fluidisé
        • Gazéification par flux entraîné
      • Marché du charbon propre par gazéification au ROYAUME-UNI par type de matière première
        • Charbon
        • Biomasse
        • Coke de pétrole
        • Matériaux de déchets
      • Marché du charbon propre par gazéification au ROYAUME-UNI par type d'application
        • Production d'électricité
        • Production chimique
        • Production de gaz
      • Marché du charbon propre par gazéification au ROYAUME-UNI par type d'utilisation finale
        • Production d'énergie
        • Fabrication
        • Transport
      • Perspectives de la FRANCE (milliards USD, 2019-2032)
      • Marché du charbon propre par gazéification en FRANCE par type de technologie
        • Gazéification à lit fixe
        • Gazéification à lit fluidisé
        • Gazéification par flux entraîné
      • Marché du charbon propre par gazéification en FRANCE par type de matière première
        • Charbon
        • Biomasse
        • Coke de pétrole
        • Matériaux de déchets
      • Marché du charbon propre par gazéification en FRANCE par type d'application
        • Production d'électricité
        • Production chimique
        • Production de gaz
      • Marché du charbon propre par gazéification en FRANCE par type d'utilisation finale
        • Production d'énergie
        • Fabrication
        • Transport
      • Perspectives de la RUSSIE (milliards USD, 2019-2032)
      • Marché du charbon propre par gazéification en RUSSIE par type de technologie
        • Gazéification à lit fixe
        • Gazéification à lit fluidisé
        • Gazéification par flux entraîné
      • Marché du charbon propre par gazéification en RUSSIE par type de matière première
        • Charbon
        • Biomasse
        • Coke de pétrole
        • Matériaux de déchets
      • Marché du charbon propre par gazéification en RUSSIE par type d'application
        • Production d'électricité
        • Production chimique
        • Production de gaz
      • Marché du charbon propre par gazéification en RUSSIE par type d'utilisation finale
        • Production d'énergie
        • Fabrication
        • Transport
      • Perspectives de l'ITALIE (milliards USD, 2019-2032)
      • Marché du charbon propre par gazéification en ITALIE par type de technologie
        • Gazéification à lit fixe
        • Gazéification à lit fluidisé
        • Gazéification par flux entraîné
      • Marché du charbon propre par gazéification en ITALIE par type de matière première
        • Charbon
        • Biomasse
        • Coke de pétrole
        • Matériaux de déchets
      • Marché du charbon propre par gazéification en ITALIE par type d'application
        • Production d'électricité
        • Production chimique
        • Production de gaz
      • Marché du charbon propre par gazéification en ITALIE par type d'utilisation finale
        • Production d'énergie
        • Fabrication
        • Transport
      • Perspectives de l'ESPAGNE (milliards USD, 2019-2032)
      • Marché du charbon propre par gazéification en ESPAGNE par type de technologie
        • Gazéification à lit fixe
        • Gazéification à lit fluidisé
        • Gazéification par flux entraîné
      • Marché du charbon propre par gazéification en ESPAGNE par type de matière première
        • Charbon
        • Biomasse
        • Coke de pétrole
        • Matériaux de déchets
      • Marché du charbon propre par gazéification en ESPAGNE par type d'application
        • Production d'électricité
        • Production chimique
        • Production de gaz
      • Marché du charbon propre par gazéification en ESPAGNE par type d'utilisation finale
        • Production d'énergie
        • Fabrication
        • Transport
      • Perspectives du RESTE DE L'EUROPE (milliards USD, 2019-2032)
      • Marché du charbon propre par gazéification dans le RESTE DE L'EUROPE par type de technologie
        • Gazéification à lit fixe
        • Gazéification à lit fluidisé
        • Gazéification par flux entraîné
      • Marché du charbon propre par gazéification dans le RESTE DE L'EUROPE par type de matière première
        • Charbon
        • Biomasse
        • Coke de pétrole
        • Matériaux de déchets
      • Marché du charbon propre par gazéification dans le RESTE DE L'EUROPE par type d'application
        • Production d'électricité
        • Production chimique
        • Production de gaz
      • Marché du charbon propre par gazéification dans le RESTE DE L'EUROPE par type d'utilisation finale
        • Production d'énergie
        • Fabrication
        • Transport
      • Perspectives de l'APAC (milliards USD, 2019-2032)
        • Marché du charbon propre par gazéification en APAC par type de technologie
          • Gazéification à lit fixe
          • Gazéification à lit fluidisé
          • Gazéification par flux entraîné
        • Marché du charbon propre par gazéification en APAC par type de matière première
          • Charbon
          • Biomasse
          • Coke de pétrole
          • Matériaux de déchets
        • Marché du charbon propre par gazéification en APAC par type d'application
          • Production d'électricité
          • Production chimique
          • Production de gaz
        • Marché du charbon propre par gazéification en APAC par type d'utilisation finale
          • Production d'énergie
          • Fabrication
          • Transport
        • Marché du charbon propre par gazéification en APAC par type régional
          • Chine
          • Inde
          • Japon
          • Corée du Sud
          • Malaisie
          • Thaïlande
          • Indonésie
          • Reste de l'APAC
        • Perspectives de la CHINE (milliards USD, 2019-2032)
        • Marché du charbon propre par gazéification en CHINE par type de technologie
          • Gazéification à lit fixe
          • Gazéification à lit fluidisé
          • Gazéification par flux entraîné
        • Marché du charbon propre par gazéification en CHINE par type de matière première
          • Charbon
          • Biomasse
          • Coke de pétrole
          • Matériaux de déchets
        • Marché du charbon propre par gazéification en CHINE par type d'application
          • Production d'électricité
          • Production chimique
          • Production de gaz
        • Marché du charbon propre par gazéification en CHINE par type d'utilisation finale
          • Production d'énergie
          • Fabrication
          • Transport
        • Perspectives de l'INDIE (milliards USD, 2019-2032)
        • Marché du charbon propre par gazéification en INDIE par type de technologie
          • Gazéification à lit fixe
          • Gazéification à lit fluidisé
          • Gazéification par flux entraîné
        • Marché du charbon propre par gazéification en INDIE par type de matière première
          • Charbon
          • Biomasse
          • Coke de pétrole
          • Matériaux de déchets
        • Marché du charbon propre par gazéification en INDIE par type d'application
          • Production d'électricité
          • Production chimique
          • Production de gaz
        • Marché du charbon propre par gazéification en INDIE par type d'utilisation finale
          • Production d'énergie
          • Fabrication
          • Transport
        • Perspectives du JAPON (milliards USD, 2019-2032)
        • Marché du charbon propre par gazéification au JAPON par type de technologie
          • Gazéification à lit fixe
          • Gazéification à lit fluidisé
          • Gazéification par flux entraîné
        • Marché du charbon propre par gazéification au JAPON par type de matière première
          • Charbon
          • Biomasse
          • Coke de pétrole
          • Matériaux de déchets
        • Marché du charbon propre par gazéification au JAPON par type d'application
          • Production d'électricité
          • Production chimique
          • Production de gaz
        • Marché du charbon propre par gazéification au JAPON par type d'utilisation finale
          • Production d'énergie
          • Fabrication
          • Transport
        • Perspectives de la COREE DU SUD (milliards USD, 2019-2032)
        • Marché du charbon propre par gazéification en COREE DU SUD par type de technologie
          • Gazéification à lit fixe
          • Gazéification à lit fluidisé
          • Gazéification par flux entraîné
        • Marché du charbon propre par gazéification en COREE DU SUD par type de matière première
          • Charbon
          • Biomasse
          • Coke de pétrole
          • Matériaux de déchets
        • Marché du charbon propre par gazéification en COREE DU SUD par type d'application
          • Production d'électricité
          • Production chimique
          • Production de gaz
        • Marché du charbon propre par gazéification en COREE DU SUD par type d'utilisation finale
          • Production d'énergie
          • Fabrication
          • Transport
        • Perspectives de la MALAYSIE (milliards USD, 2019-2032)
        • Marché du charbon propre par gazéification en MALAYSIE par type de technologie
          • Gazéification à lit fixe
          • Gazéification à lit fluidisé
          • Gazéification par flux entraîné
        • Marché du charbon propre par gazéification en MALAYSIE par type de matière première
          • Charbon
          • Biomasse
          • Coke de pétrole
          • Matériaux de déchets
        • Marché du charbon propre par gazéification en MALAYSIE par type d'application
          • Production d'électricité
          • Production chimique
          • Production de gaz
        • Marché du charbon propre par gazéification en MALAYSIE par type d'utilisation finale
          • Production d'énergie
          • Fabrication
          • Transport
        • Perspectives de la THAILANDE (milliards USD, 2019-2032)
        • Marché du charbon propre par gazéification en THAILANDE par type de technologie
          • Gazéification à lit fixe
          • Gazéification à lit fluidisé
          • Gazéification par flux entraîné
        • Marché du charbon propre par gazéification en THAILANDE par type de matière première
          • Charbon
          • Biomasse
          • Coke de pétrole
          • Matériaux de déchets
        • Marché du charbon propre par gazéification en THAILANDE par type d'application
          • Production d'électricité
          • Production chimique
          • Production de gaz
        • Marché du charbon propre par gazéification en THAILANDE par type d'utilisation finale
          • Production d'énergie
          • Fabrication
          • Transport
        • Perspectives de l'INDONESIE (milliards USD, 2019-2032)
        • Marché du charbon propre par gazéification en INDONESIE par type de technologie
          • Gazéification à lit fixe
          • Gazéification à lit fluidisé
          • Gazéification par flux entraîné
        • Marché du charbon propre par gazéification en INDONESIE par type de matière première
          • Charbon
          • Biomasse
          • Coke de pétrole
          • Matériaux de déchets
        • Marché du charbon propre par gazéification en INDONESIE par type d'application
          • Production d'électricité
          • Production chimique
          • Production de gaz
        • Marché du charbon propre par gazéification en INDONESIE par type d'utilisation finale
          • Production d'énergie
          • Fabrication
          • Transport
        • Perspectives du RESTE DE L'APAC (milliards USD, 2019-2032)
        • Marché du charbon propre par gazéification dans le RESTE DE L'APAC par type de technologie
          • Gazéification à lit fixe
          • Gazéification à lit fluidisé
          • Gazéification par flux entraîné
        • Marché du charbon propre par gazéification dans le RESTE DE L'APAC par type de matière première
          • Charbon
          • Biomasse
          • Coke de pétrole
          • Matériaux de déchets
        • Marché du charbon propre par gazéification dans le RESTE DE L'APAC par type d'application
          • Production d'électricité
          • Production chimique
          • Production de gaz
        • Marché du charbon propre par gazéification dans le RESTE DE L'APAC par type d'utilisation finale
          • Production d'énergie
          • Fabrication
          • Transport
        • Perspectives de l'Amérique du Sud (milliards USD, 2019-2032)
          • Marché du charbon propre par gazéification en Amérique du Sud par type de technologie
            • Gazéification à lit fixe
            • Gazéification à lit fluidisé
            • Gazéification par flux entraîné
          • Marché du charbon propre par gazéification en Amérique du Sud par type de matière première
            • Charbon
            • Biomasse
            • Coke de pétrole
            • Matériaux de déchets
          • Marché du charbon propre par gazéification en Amérique du Sud par type d'application
            • Production d'électricité
            • Production chimique
            • Production de gaz
          • Marché du charbon propre par gazéification en Amérique du Sud par type d'utilisation finale
            • Production d'énergie
            • Fabrication
            • Transport
          • Marché du charbon propre par gazéification en Amérique du Sud par type régional
            • Brésil
            • Mexique
            • Argentine
            • Reste de l'Amérique du Sud
          • Perspectives du BRÉSIL (milliards USD, 2019-2032)
          • Marché du charbon propre par gazéification au BRÉSIL par type de technologie
            • Gazéification à lit fixe
            • Gazéification à lit fluidisé
            • Gazéification par flux entraîné
          • Marché du charbon propre par gazéification au BRÉSIL par type de matière première
            • Charbon
            • Biomasse
            • Coke de pétrole
            • Matériaux de déchets
          • Marché du charbon propre par gazéification au BRÉSIL par type d'application
            • Production d'électricité
            • Production chimique
            • Production de gaz
          • Marché du charbon propre par gazéification au BRÉSIL par type d'utilisation finale
            • Production d'énergie
            • Fabrication
            • Transport
          • Perspectives du MEXIQUE (milliards USD, 2019-2032)
          • Marché du charbon propre par gazéification au MEXIQUE par type de technologie
            • Gazéification à lit fixe
            • Gazéification à lit fluidisé
            • Gazéification par flux entraîné
          • Marché du charbon propre par gazéification au MEXIQUE par type de matière première
            • Charbon
            • Biomasse
            • Coke de pétrole
            • Matériaux de déchets
          • Marché du charbon propre par gazéification au MEXIQUE par type d'application
            • Production d'électricité
            • Production chimique
            • Production de gaz
          • Marché du charbon propre par gazéification au MEXIQUE par type d'utilisation finale
            • Production d'énergie
            • Fabrication
            • Transport
          • Perspectives de l'ARGENTINE (milliards USD, 2019-2032)
          • Marché du charbon propre par gazéification en ARGENTINE par type de technologie
            • Gazéification à lit fixe
            • Gazéification à lit fluidisé
            • Gazéification par flux entraîné
          • Marché du charbon propre par gazéification en ARGENTINE par type de matière première
            • Charbon
            • Biomasse
            • Coke de pétrole
            • Matériaux de déchets
          • Marché du charbon propre par gazéification en ARGENTINE par type d'application
            • Production d'électricité
            • Production chimique
            • Production de gaz
          • Marché du charbon propre par gazéification en ARGENTINE par type d'utilisation finale
            • Production d'énergie
            • Fabrication
            • Transport
          • Perspectives du RESTE DE L'AMÉRIQUE DU SUD (milliards USD, 2019-2032)
          • Marché du charbon propre par gazéification dans le RESTE DE L'AMÉRIQUE DU SUD par type de technologie
            • Gazéification à lit fixe
            • Gazéification à lit fluidisé
            • Gazéification par flux entraîné
          • Marché du charbon propre par gazéification dans le RESTE DE L'AMÉRIQUE DU SUD par type de matière première
            • Charbon
            • Biomasse
            • Coke de pétrole
            • Matériaux de déchets
          • Marché du charbon propre par gazéification dans le RESTE DE L'AMÉRIQUE DU SUD par type d'application
            • Production d'électricité
            • Production chimique
            • Production de gaz
          • Marché du charbon propre par gazéification dans le RESTE DE L'AMÉRIQUE DU SUD par type d'utilisation finale
            • Production d'énergie
            • Fabrication
            • Transport
          • Perspectives du MEA (milliards USD, 2019-2032)
            • Marché du charbon propre par gazéification dans le MEA par type de technologie
              • Gazéification à lit fixe
              • Gazéification à lit fluidisé
              • Gazéification par flux entraîné
            • Marché du charbon propre par gazéification dans le MEA par type de matière première
              • Charbon
              • Biomasse
              • Coke de pétrole
              • Matériaux de déchets
            • Marché du charbon propre par gazéification dans le MEA par type d'application
              • Production d'électricité
              • Production chimique
              • Production de gaz
            • Marché du charbon propre par gazéification dans le MEA par type d'utilisation finale
              • Production d'énergie
              • Fabrication
              • Transport
            • Marché du charbon propre par gazéification dans le MEA par type régional
              • Pays du CCG
              • Afrique du Sud
              • Reste du MEA
            • Perspectives des PAYS DU CCG (milliards USD, 2019-2032)
            • Marché du charbon propre par gazéification dans les PAYS DU CCG par type de technologie
              • Gazéification à lit fixe
              • Gazéification à lit fluidisé
              • Gazéification par flux entraîné
            • Marché du charbon propre par gazéification dans les PAYS DU CCG par type de matière première
              • Charbon
              • Biomasse
              • Coke de pétrole
              • Matériaux de déchets
            • Marché du charbon propre par gazéification dans les PAYS DU CCG par type d'application
              • Production d'électricité
              • Production chimique
              • Production de gaz
            • Marché du charbon propre par gazéification dans les PAYS DU CCG par type d'utilisation finale
              • Production d'énergie
              • Fabrication
              • Transport
            • Perspectives de l'AFRIQUE DU SUD (milliards USD, 2019-2032)
            • Marché du charbon propre par gazéification en AFRIQUE DU SUD par type de technologie
              • Gazéification à lit fixe
              • Gazéification à lit fluidisé
              • Gazéification par flux entraîné
            • Marché du charbon propre par gazéification en AFRIQUE DU SUD par type de matière première
              • Charbon
              • Biomasse
              • Coke de pétrole
              • Matériaux de déchets
            • Marché du charbon propre par gazéification en AFRIQUE DU SUD par type d'application
              • Production d'électricité
              • Production chimique
              • Production de gaz
            • Marché du charbon propre par gazéification en AFRIQUE DU SUD par type d'utilisation finale
              • Production d'énergie
              • Fabrication
              • Transport
            • Perspectives du RESTE DU MEA (milliards USD, 2019-2032)
            • Marché du charbon propre par gazéification dans le RESTE DU MEA par type de technologie
              • Gazéification à lit fixe
              • Gazéification à lit fluidisé
              • Gazéification par flux entraîné
            • Marché du charbon propre par gazéification dans le RESTE DU MEA par type de matière première
              • Charbon
              • Biomasse
              • Coke de pétrole
              • Matériaux de déchets
            • Marché du charbon propre par gazéification dans le RESTE DU MEA par type d'application
              • Production d'électricité
              • Production chimique
              • Production de gaz
            • Marché du charbon propre par gazéification dans le RESTE DU MEA par type d'utilisation finale
              • Production d'énergie
              • Fabrication
              • Transport


Compare Licence

×
Features License Type
Single User Multiuser License Enterprise User
Price $4,950 $5,950 $7,250
Maximum User Access Limit 1 User Upto 10 Users Unrestricted Access Throughout the Organization
Free Customization
Direct Access to Analyst
Deliverable Format
Platform Access
Discount on Next Purchase 10% 15% 15%
Printable Versions