Marché des plastiques d'ingénierie
Market Size
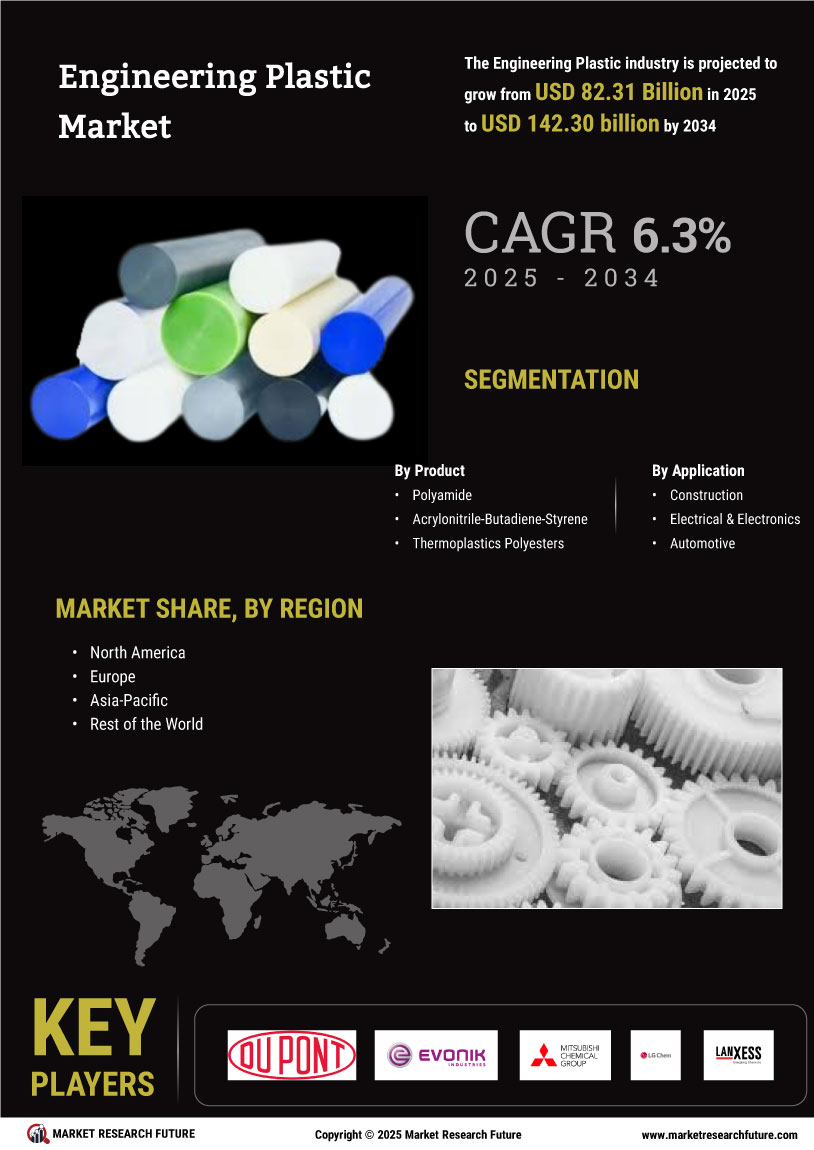
Key Players
- Sustainability Initiatives
- Technological Advancements
- Lightweight Material Adoption
- Market Growth Projections
- Expansion of End-Use Industries
- Growing Focus on Sustainability
- 1 Résumé Exécutif
-
2 Méthodologie de Recherche
-
2.1 Portée de l'Étude
- 2.1.1 Définition
- 2.1.2 Objectif de Recherche
- 2.1.3 Hypothèses
- 2.1.4 Limitations
-
2.2 Processus de Recherche
- 2.2.1 Recherche Primaire
- 2.2.2 Recherche Secondaire
- 2.3 Estimation de la Taille du Marché
- 2.4 Modèle de Prévision
-
2.1 Portée de l'Étude
-
3 Dynamique du Marché
- 3.1 Facteurs de Croissance du Marché
- 3.2 Inhibiteurs du Marché
- 3.3 Analyse de la Chaîne d'Approvisionnement/Valeur
- 3.4 Analyse des Cinq Forces de Porter
-
4 Marché Mondial des Plastiques Techniques, Par Produits
- 4.1 Polyamide
- 4.2 Acrylonitrile-Butadiène-Styrène
- 4.2 Polyesters Thermoplastiques
- 4.2 Polycarbonate
- 4.2 Autres
-
5 Marché Mondial des Plastiques Techniques, Par Application
- 5.1 Introduction
- 5.2 Construction
- 5.3 Électrique & Électronique
- 5.4 Automobile
- 5.5 Biens de Consommation
- 5.5 Autres
-
6 Analyse du Marché Régional
- 6.1 Introduction
-
6.2 Amérique du Nord
- 6.2.1 États-Unis
- 6.2.2 Canada
-
6.3 Europe
- 6.3.1 R.-U.
- 6.3.2 France
- 6.3.3 Allemagne
- 6.3.4 Espagne
- 6.3.5 Reste de l'Europe
-
6.4 Asie-Pacifique
- 6.4.1 Chine
- 6.4.2 Japon
- 6.4.3 Inde
- 6.4.4 Reste de l'Asie-Pacifique
- 6.5 Reste du Monde
-
7 Analyse Concurrentielle
- 7.1 Introduction
-
7.2 Scénario Concurrentiel
- 7.2.1 Analyse de Part de Marché
- 7.2.2 Analyse du Développement du Marché
- 7.2.3 Évaluation des Produits/Services
-
7.3 BASF SE (Allemagne)
- 7.3.1 Aperçu
- 7.3.2 Offre de Produits/Services
- 7.3.3 Stratégie
-
7.4 Covestro (Allemagne)
- 7.4.1 Aperçu
- 7.4.2 Offre de Produits/Services
- 7.4.3 Stratégie
-
7.5 Solvay S. A. (Belgique)
- 7.5.1 Aperçu
- 7.5.2 Offre de Produits/Services
- 7.5.3 Stratégie
-
7.6 Celanese Corporation (États-Unis)
- 7.6.1 Aperçu
- 7.6.2 Offre de Produits/Services
- 7.6.3 Stratégie
-
7.7 E. I. du Pont de Nemours and Company (États-Unis)
- 7.7.1 Aperçu
- 7.7.2 Offre de Produits/Services
- 7.7.3 Stratégie
-
7.8 LG Chem Ltd. (Corée du Sud)
- 7.8.1 Aperçu
- 7.8.2 Offre de Produits/Services
- 7.8.3 Stratégie
-
7.9 Saudi Basic Industries Corporation (Arabie Saoudite)
- 7.9.1 Aperçu
- 7.9.2 Offre de Produits/Services
- 7.9.3 Stratégie
-
7.10 Evonik Industries AG (Allemagne)
- 7.10.1 Aperçu
- 7.10.2 Offre de Produits/Services
- 7.10.3 Stratégie
-
7.11 Lanxess AG (Allemagne)
- 7.11.1 Aperçu
- 7.11.2 Offre de Produits/Services
- 7.11.3 Stratégie
-
7.12 Mitsubishi Engineering-Plastics Corporation (Japon)
- 7.12.1 Aperçu
- 7.12.2 Offre de Produits/Services
- 7.12.3 Stratégie
- LISTE DES TABLEAUX
- TABLEAU 1 MARCHÉ MONDIAL DES PLASTIQUES TECHNIQUES, PAR PRODUIT
- TABLEAU 3 MARCHÉ MONDIAL DES PLASTIQUES TECHNIQUES, PAR APPLICATION
- TABLEAU 4 MARCHÉ MONDIAL DES PLASTIQUES TECHNIQUES, PAR RÉGIONS
- TABLEAU 5 MARCHÉ DES PLASTIQUES TECHNIQUES EN AMÉRIQUE DU NORD, PAR PAYS
- TABLEAU 6 MARCHÉ DES PLASTIQUES TECHNIQUES EN AMÉRIQUE DU NORD, PAR PRODUIT
- TABLEAU 7 MARCHÉ DES PLASTIQUES TECHNIQUES EN AMÉRIQUE DU NORD, PAR APPLICATION
- TABLEAU 8 MARCHÉ DES PLASTIQUES TECHNIQUES AUX ÉTATS-UNIS, PAR PRODUIT
- TABLEAU 9 MARCHÉ DES PLASTIQUES TECHNIQUES AUX ÉTATS-UNIS, PAR APPLICATION
- TABLEAU 10 MARCHÉ DES PLASTIQUES TECHNIQUES AU CANADA, PAR PRODUIT
- TABLEAU 11 MARCHÉ DES PLASTIQUES TECHNIQUES AU CANADA, PAR APPLICATION
- TABLEAU 12 MARCHÉ DES PLASTIQUES TECHNIQUES EN EUROPE, PAR PAYS
- TABLEAU 13 MARCHÉ DES PLASTIQUES TECHNIQUES EN EUROPE, PAR PRODUIT
- TABLEAU 14 MARCHÉ DES PLASTIQUES TECHNIQUES EN EUROPE, PAR APPLICATION
- TABLEAU 15 MARCHÉ DES PLASTIQUES TECHNIQUES EN ALLEMAGNE, PAR PRODUIT
- TABLEAU 16 MARCHÉ DES PLASTIQUES TECHNIQUES EN ALLEMAGNE, PAR APPLICATION
- TABLEAU 17 MARCHÉ DES PLASTIQUES TECHNIQUES EN FRANCE, PAR PRODUIT
- TABLEAU 18 MARCHÉ DES PLASTIQUES TECHNIQUES EN FRANCE, PAR APPLICATION
- TABLEAU 19 MARCHÉ DES PLASTIQUES TECHNIQUES AU R.-U., PAR PRODUIT
- TABLEAU 20 MARCHÉ DES PLASTIQUES TECHNIQUES AU R.-U., PAR APPLICATION
- TABLEAU 21 MARCHÉ DES PLASTIQUES TECHNIQUES DANS LE RESTE DE L'EUROPE, PAR PRODUIT
- TABLEAU 22 MARCHÉ DES PLASTIQUES TECHNIQUES DANS LE RESTE DE L'EUROPE, PAR APPLICATION
- TABLEAU 23 MARCHÉ DES PLASTIQUES TECHNIQUES EN ASIE-PACIFIQUE, PAR PAYS
- TABLEAU 24 MARCHÉ DES PLASTIQUES TECHNIQUES EN ASIE-PACIFIQUE, PAR PRODUIT
- TABLEAU 25 MARCHÉ DES PLASTIQUES TECHNIQUES EN ASIE-PACIFIQUE, PAR APPLICATION
- TABLEAU 26 MARCHÉ DES PLASTIQUES TECHNIQUES AU MOYEN-ORIENT & EN AFRIQUE, PAR PRODUIT
- TABLEAU 27 MARCHÉ DES PLASTIQUES TECHNIQUES AU MOYEN-ORIENT & EN AFRIQUE, PAR APPLICATION
- LISTE DES FIGURES
- FIGURE 1 TYPE DE RECHERCHE
- FIGURE 2 MARCHÉ MONDIAL DES PLASTIQUES TECHNIQUES : PAR PRODUIT (%)
- FIGURE 3 MARCHÉ MONDIAL DES PLASTIQUES TECHNIQUES : PAR APPLICATION (%)
- FIGURE 4 MARCHÉ MONDIAL DES PLASTIQUES TECHNIQUES : PAR RÉGION
- FIGURE 5 MARCHÉ DES PLASTIQUES TECHNIQUES EN AMÉRIQUE DU NORD, PAR PRODUIT (%)
- FIGURE 6 MARCHÉ DES PLASTIQUES TECHNIQUES EN AMÉRIQUE DU NORD, PAR APPLICATION (%)
- FIGURE 7 MARCHÉ DES PLASTIQUES TECHNIQUES EN AMÉRIQUE DU NORD, PAR PAYS (%)
- FIGURE 8 MARCHÉ DES PLASTIQUES TECHNIQUES EN EUROPE, PAR PRODUIT (%)
- FIGURE 9 MARCHÉ DES PLASTIQUES TECHNIQUES EN EUROPE, PAR APPLICATION (%)
- FIGURE 10 MARCHÉ DES PLASTIQUES TECHNIQUES EN EUROPE, PAR PAYS (%)
- FIGURE 11 MARCHÉ DES PLASTIQUES TECHNIQUES EN ASIE-PACIFIQUE, PAR PRODUIT (%)
- FIGURE 12 MARCHÉ DES PLASTIQUES TECHNIQUES EN ASIE-PACIFIQUE, PAR APPLICATION (%)
- FIGURE 13 MARCHÉ DES PLASTIQUES TECHNIQUES EN ASIE-PACIFIQUE, PAR PAYS (%)
- FIGURE 14 MARCHÉ DES PLASTIQUES TECHNIQUES DANS LE RESTE DU MONDE, PAR PRODUIT (%)
- FIGURE 15 MARCHÉ DES PLASTIQUES TECHNIQUES DANS LE RESTE DU MONDE, PAR APPLICATION (%)
Customer Stories

“This is really good guys. Excellent work on a tight deadline. I will continue to use you going forward and recommend you to others. Nice job”

“Thanks. It’s been a pleasure working with you, please use me as reference with any other Intel employees.”

“Thanks for sending the report it gives us a good global view of the Betaïne market.”

“Thank you, this will be very helpful for OQS.”

“We found the report very insightful! we found your research firm very helpful. I'm sending this email to secure our future business.”

“I am very pleased with how market segments have been defined in a relevant way for my purposes (such as "Portable Freezers & refrigerators" and "last-mile"). In general the report is well structured. Thanks very much for your efforts.”

“I have been reading the first document or the study, ,the Global HVAC and FP market report 2021 till 2026. Must say, good info! I have not gone in depth at all parts, but got a good indication of the data inside!”

“We got the report in time, we really thank you for your support in this process. I also thank to all of your team as they did a great job.”