
Egypt Honey Market
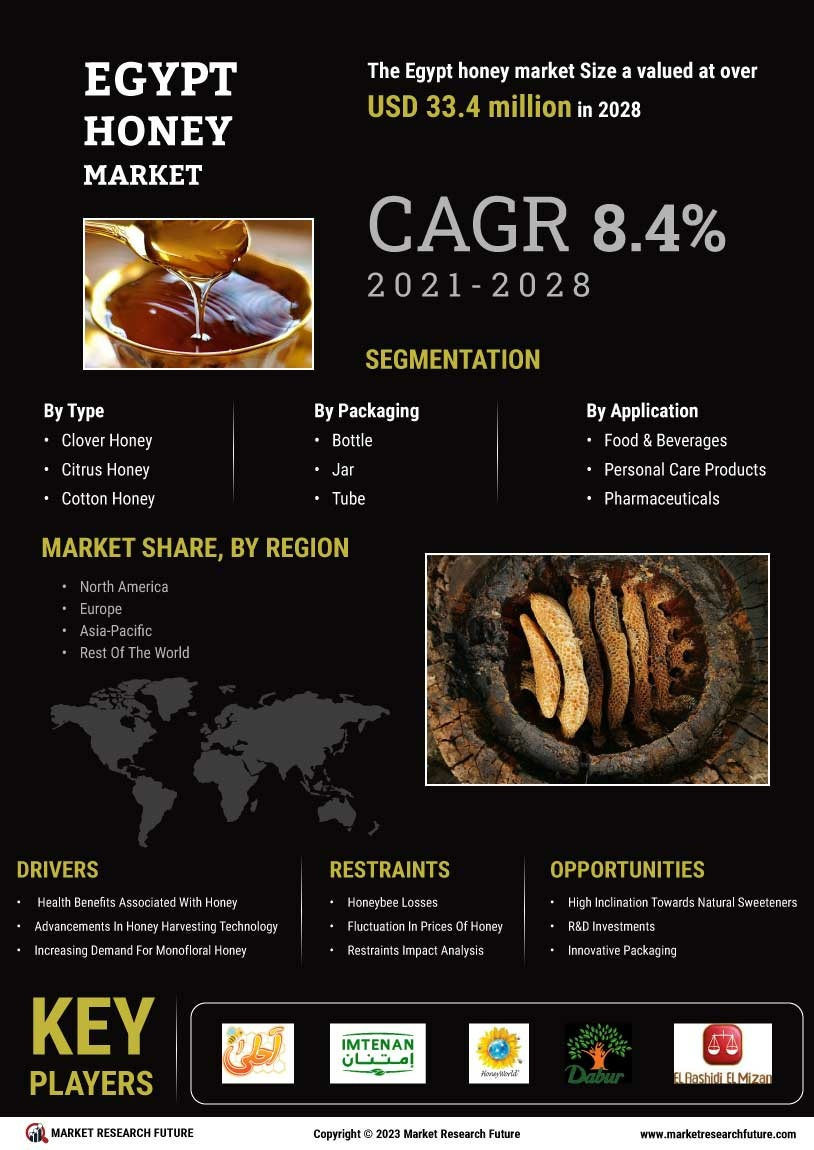
Rapport d'étude du marché du miel en Égypte : informations par type (miel de trèfle, miel d'agrumes, miel de coton, miel de fleurs sauvages, autres) emballage d'application (aliments et boissons, produits de soins personnels, produits pharmaceutiques, autres), par région (Égypte) — Prévisions jusqu'en 2027

-
1 SECTION I: EXECUTIVE SUMMARY AND KEY HIGHLIGHTS
-
1.1 EXECUTIVE SUMMARY
- 1.1.1 Market Overview
- 1.1.2 Key Findings
- 1.1.3 Market Segmentation
- 1.1.4 Competitive Landscape
- 1.1.5 Challenges and Opportunities
- 1.1.6 Future Outlook
-
1.1 EXECUTIVE SUMMARY
-
2 SECTION II: SCOPING, METHODOLOGY AND MARKET STRUCTURE
-
2.1 MARKET INTRODUCTION
- 2.1.1 Definition
-
2.1.2 Scope of the study
- 2.1.2.1 Research Objective
- 2.1.2.2 Assumption
- 2.1.2.3 Limitations
-
2.2 RESEARCH METHODOLOGY
- 2.2.1 Overview
- 2.2.2 Data Mining
- 2.2.3 Secondary Research
-
2.2.4 Primary Research
- 2.2.4.1 Primary Interviews and Information Gathering Process
- 2.2.4.2 Breakdown of Primary Respondents
- 2.2.5 Forecasting Model
-
2.2.6 Market Size Estimation
- 2.2.6.1 Bottom-Up Approach
- 2.2.6.2 Top-Down Approach
- 2.2.7 Data Triangulation
- 2.2.8 Validation
-
2.1 MARKET INTRODUCTION
-
3 SECTION III: QUALITATIVE ANALYSIS
-
3.1 MARKET DYNAMICS
- 3.1.1 Overview
- 3.1.2 Drivers
- 3.1.3 Restraints
- 3.1.4 Opportunities
-
3.2 MARKET FACTOR ANALYSIS
- 3.2.1 Value chain Analysis
-
3.2.2 Porter's Five Forces Analysis
- 3.2.2.1 Bargaining Power of Suppliers
- 3.2.2.2 Bargaining Power of Buyers
- 3.2.2.3 Threat of New Entrants
- 3.2.2.4 Threat of Substitutes
- 3.2.2.5 Intensity of Rivalry
-
3.2.3 COVID-19 Impact Analysis
- 3.2.3.1 Market Impact Analysis
- 3.2.3.2 Regional Impact
- 3.2.3.3 Opportunity and Threat Analysis
-
3.1 MARKET DYNAMICS
-
4 SECTION IV: QUANTITATIVE ANALYSIS
-
4.1 Food, Beverages & Nutrition, BY Application (USD Billion)
- 4.1.1 Food Industry
- 4.1.2 Cosmetics
- 4.1.3 Pharmaceuticals
- 4.1.4 Beverages
- 4.1.5 Nutraceuticals
-
4.2 Food, Beverages & Nutrition, BY Type (USD Billion)
- 4.2.1 Raw Honey
- 4.2.2 Processed Honey
- 4.2.3 Organic Honey
- 4.2.4 Flavored Honey
- 4.2.5 Manuka Honey
-
4.3 Food, Beverages & Nutrition, BY Distribution Channel (USD Billion)
- 4.3.1 Online Retail
- 4.3.2 Supermarkets
- 4.3.3 Specialty Stores
- 4.3.4 Direct Sales
- 4.3.5 Wholesale
-
4.4 Food, Beverages & Nutrition, BY Packaging Type (USD Billion)
- 4.4.1 Glass Jars
- 4.4.2 Plastic Containers
- 4.4.3 Bulk Packaging
- 4.4.4 Squeeze Bottles
- 4.4.5 Metal Tins
-
4.5 Food, Beverages & Nutrition, BY Form (USD Billion)
- 4.5.1 Liquid
- 4.5.2 Solid
- 4.5.3 Creamed
- 4.5.4 Comb Honey
- 4.5.5 Honey Powder
-
4.1 Food, Beverages & Nutrition, BY Application (USD Billion)
-
5 SECTION V: COMPETITIVE ANALYSIS
-
5.1 Competitive Landscape
- 5.1.1 Overview
- 5.1.2 Competitive Analysis
- 5.1.3 Market share Analysis
- 5.1.4 Major Growth Strategy in the Food, Beverages & Nutrition
- 5.1.5 Competitive Benchmarking
- 5.1.6 Leading Players in Terms of Number of Developments in the Food, Beverages & Nutrition
-
5.1.7 Key developments and growth strategies
- 5.1.7.1 New Product Launch/Service Deployment
- 5.1.7.2 Merger & Acquisitions
- 5.1.7.3 Joint Ventures
-
5.1.8 Major Players Financial Matrix
- 5.1.8.1 Sales and Operating Income
- 5.1.8.2 Major Players R&D Expenditure. 2023
-
5.2 Company Profiles
-
5.2.1 Al Shifa (AE)
- 5.2.1.1 Financial Overview
- 5.2.1.2 Products Offered
- 5.2.1.3 Key Developments
- 5.2.1.4 SWOT Analysis
- 5.2.1.5 Key Strategies
-
5.2.2 Dabur (IN)
- 5.2.2.1 Financial Overview
- 5.2.2.2 Products Offered
- 5.2.2.3 Key Developments
- 5.2.2.4 SWOT Analysis
- 5.2.2.5 Key Strategies
-
5.2.3 Bee Natural (ZA)
- 5.2.3.1 Financial Overview
- 5.2.3.2 Products Offered
- 5.2.3.3 Key Developments
- 5.2.3.4 SWOT Analysis
- 5.2.3.5 Key Strategies
-
5.2.4 Miel de Fleur (FR)
- 5.2.4.1 Financial Overview
- 5.2.4.2 Products Offered
- 5.2.4.3 Key Developments
- 5.2.4.4 SWOT Analysis
- 5.2.4.5 Key Strategies
-
5.2.5 Honeywell (AE)
- 5.2.5.1 Financial Overview
- 5.2.5.2 Products Offered
- 5.2.5.3 Key Developments
- 5.2.5.4 SWOT Analysis
- 5.2.5.5 Key Strategies
-
5.2.6 Safi Honey (SA)
- 5.2.6.1 Financial Overview
- 5.2.6.2 Products Offered
- 5.2.6.3 Key Developments
- 5.2.6.4 SWOT Analysis
- 5.2.6.5 Key Strategies
-
5.2.7 Manuka Health (NZ)
- 5.2.7.1 Financial Overview
- 5.2.7.2 Products Offered
- 5.2.7.3 Key Developments
- 5.2.7.4 SWOT Analysis
- 5.2.7.5 Key Strategies
-
5.2.8 Kefir Honey (TR)
- 5.2.8.1 Financial Overview
- 5.2.8.2 Products Offered
- 5.2.8.3 Key Developments
- 5.2.8.4 SWOT Analysis
- 5.2.8.5 Key Strategies
-
5.2.9 Nectar (EG)
- 5.2.9.1 Financial Overview
- 5.2.9.2 Products Offered
- 5.2.9.3 Key Developments
- 5.2.9.4 SWOT Analysis
- 5.2.9.5 Key Strategies
-
5.2.1 Al Shifa (AE)
-
5.3 Appendix
- 5.3.1 References
- 5.3.2 Related Reports
-
5.1 Competitive Landscape
-
6 LIST OF FIGURES
- 6.1 MARKET SYNOPSIS
- 6.2 MEA MARKET ANALYSIS BY APPLICATION
- 6.3 MEA MARKET ANALYSIS BY TYPE
- 6.4 MEA MARKET ANALYSIS BY DISTRIBUTION CHANNEL
- 6.5 MEA MARKET ANALYSIS BY PACKAGING TYPE
- 6.6 MEA MARKET ANALYSIS BY FORM
- 6.7 KEY BUYING CRITERIA OF FOOD, BEVERAGES & NUTRITION
- 6.8 RESEARCH PROCESS OF MRFR
- 6.9 DRO ANALYSIS OF FOOD, BEVERAGES & NUTRITION
- 6.10 DRIVERS IMPACT ANALYSIS: FOOD, BEVERAGES & NUTRITION
- 6.11 RESTRAINTS IMPACT ANALYSIS: FOOD, BEVERAGES & NUTRITION
- 6.12 SUPPLY / VALUE CHAIN: FOOD, BEVERAGES & NUTRITION
- 6.13 FOOD, BEVERAGES & NUTRITION, BY APPLICATION, 2024 (% SHARE)
- 6.14 FOOD, BEVERAGES & NUTRITION, BY APPLICATION, 2024 TO 2035 (USD Billion)
- 6.15 FOOD, BEVERAGES & NUTRITION, BY TYPE, 2024 (% SHARE)
- 6.16 FOOD, BEVERAGES & NUTRITION, BY TYPE, 2024 TO 2035 (USD Billion)
- 6.17 FOOD, BEVERAGES & NUTRITION, BY DISTRIBUTION CHANNEL, 2024 (% SHARE)
- 6.18 FOOD, BEVERAGES & NUTRITION, BY DISTRIBUTION CHANNEL, 2024 TO 2035 (USD Billion)
- 6.19 FOOD, BEVERAGES & NUTRITION, BY PACKAGING TYPE, 2024 (% SHARE)
- 6.20 FOOD, BEVERAGES & NUTRITION, BY PACKAGING TYPE, 2024 TO 2035 (USD Billion)
- 6.21 FOOD, BEVERAGES & NUTRITION, BY FORM, 2024 (% SHARE)
- 6.22 FOOD, BEVERAGES & NUTRITION, BY FORM, 2024 TO 2035 (USD Billion)
- 6.23 BENCHMARKING OF MAJOR COMPETITORS
-
7 LIST OF TABLES
- 7.1 LIST OF ASSUMPTIONS
-
7.1.1
-
7.2 MEA MARKET SIZE ESTIMATES; FORECAST
- 7.2.1 BY APPLICATION, 2026-2035 (USD Billion)
- 7.2.2 BY TYPE, 2026-2035 (USD Billion)
- 7.2.3 BY DISTRIBUTION CHANNEL, 2026-2035 (USD Billion)
- 7.2.4 BY PACKAGING TYPE, 2026-2035 (USD Billion)
- 7.2.5 BY FORM, 2026-2035 (USD Billion)
- 7.3 PRODUCT LAUNCH/PRODUCT DEVELOPMENT/APPROVAL
-
7.2 MEA MARKET SIZE ESTIMATES; FORECAST
-
7.3.1
- 7.4 ACQUISITION/PARTNERSHIP
- 7.4.1
Customer Stories

“This is really good guys. Excellent work on a tight deadline. I will continue to use you going forward and recommend you to others. Nice job”

“Thanks. It’s been a pleasure working with you, please use me as reference with any other Intel employees.”

“Thanks for sending the report it gives us a good global view of the Betaïne market.”

“Thank you, this will be very helpful for OQS.”

“We found the report very insightful! we found your research firm very helpful. I'm sending this email to secure our future business.”

“I am very pleased with how market segments have been defined in a relevant way for my purposes (such as "Portable Freezers & refrigerators" and "last-mile"). In general the report is well structured. Thanks very much for your efforts.”

“I have been reading the first document or the study, ,the Global HVAC and FP market report 2021 till 2026. Must say, good info! I have not gone in depth at all parts, but got a good indication of the data inside!”

“We got the report in time, we really thank you for your support in this process. I also thank to all of your team as they did a great job.”
